. 2022 Jul 19;119(29):e2202015119.
doi: 10.1073/pnas.2202015119. Epub 2022 Jul 15.

Sox9 directs divergent epigenomic states in brain tumor subtypes

Affiliations

Sox9 directs divergent epigenomic states in brain tumor subtypes

Debosmita Sardar et al. Proc Natl Acad Sci U S A. .

Abstract

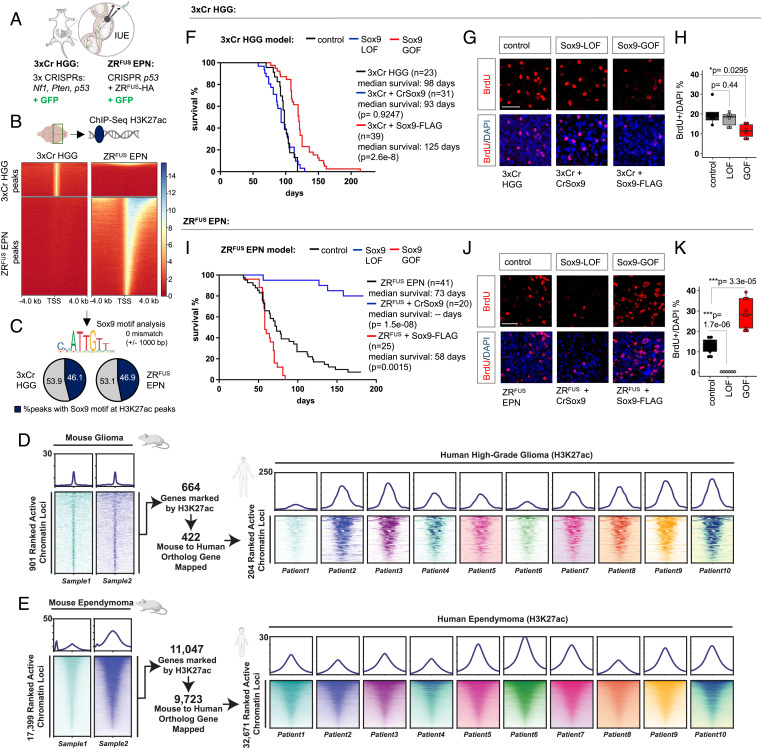
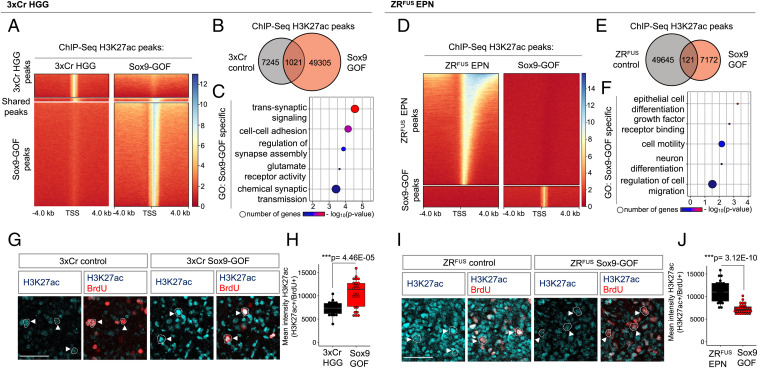
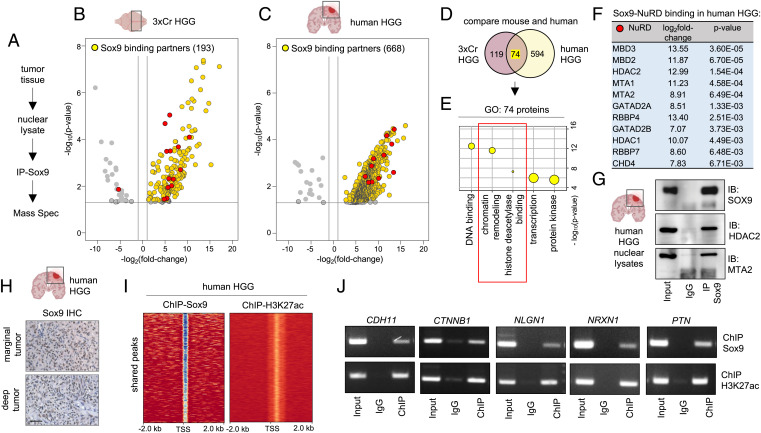
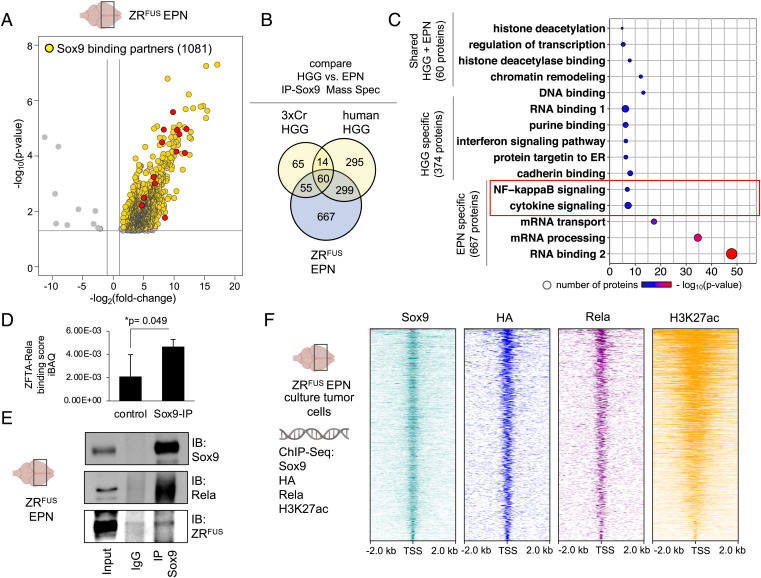
Epigenetic dysregulation is a universal feature of cancer that results in altered patterns of gene expression that drive malignancy. Brain tumors exhibit subtype-specific epigenetic alterations; however, the molecular mechanisms responsible for these diverse epigenetic states remain unclear. Here, we show that the developmental transcription factor Sox9 differentially regulates epigenomic states in high-grade glioma (HGG) and ependymoma (EPN). Using our autochthonous mouse models, we found that Sox9 suppresses HGG growth and expands associated H3K27ac states, while promoting ZFTA-RELA (ZRFUS) EPN growth and diminishing H3K27ac states. These contrasting roles for Sox9 correspond with protein interactions with histone deacetylating complexes in HGG and an association with the ZRFUS oncofusion in EPN. Mechanistic studies revealed extensive Sox9 and ZRFUS promoter co-occupancy, indicating functional synergy in promoting EPN tumorigenesis. Together, our studies demonstrate how epigenomic states are differentially regulated in distinct subtypes of brain tumors, while revealing divergent roles for Sox9 in HGG and EPN tumorigenesis.

Keywords: ependymoma; epigenetics; high-grade glioma; histone; transcription.


Conflict of interest statement

The authors declare no competing interest.

Figures

Fig. 1.
Fig. 1.
Epigenetic states of H3K27ac and the effect of Sox9 manipulation in 3xCr HGG and ZRFUS EPN tumor subtypes. (A) Schematic of IUE to generate HGG and EPN in a native mouse model. (B) Comparison showing heatmaps of ChIP-H3K27ac signal at 4 kb from peak center at transcription start site (TSS) in 3xCr HGG and ZRFUS EPN tumors. (C) Pie charts showing the percentage of total H3K27ac sites that carries the Sox9 motif allowing 0 mismatch at 1,000 bp from peak center. (D) Comparison of active H3K27ac peaks between mouse 3xCr HGG and 10 human HGG patient tumors. (E) Comparison of active H3K27ac peaks between mouse ZRFUS EPN and 10 human Rela-fusion-positive EPN patient tumors. (F) Kaplan–Meier survival curves of 3xCr HGG control (n = 23), Sox9-LOF (n = 31), and Sox9-GOF (n = 39). (G and H) Representative images of BrdU staining on P90 3xCr HGG tumors and box plots showing quantification of BrdU over DAPI-labeled cells (n = 3 mice per group, 2 sections each; scale bar: 50 μm). (I) Kaplan–Meier survival curves of ZRFUS EPN control (n = 41), Sox9-LOF (n = 20), and Sox9-GOF (n = 25). (J and K) Representative images of BrdU staining on P70 ZRFUS EPN tumors and box plots of quantification of BrdU over DAPI-labeled cells (n = 3 mice per group, 3 sections each; scale bar: 50 μm). P values in Kaplan–Meier curves were calculated using the log-rank test. P values in box plots were calculated using one-way ANOVA with Tukey’s test (*P < 0.05, ***P < 0.001).
Fig. 2.
Fig. 2.
Sox9 differentially regulates H3K27ac states in 3xCr HGG and ZRFUS EPN tumor subtypes. (A) Comparison showing heatmaps of ChIP-H3K27ac signal at 4 kb from peak center in 3xCr control versus Sox9-GOF HGG. (B) Venn diagram of the number peaks unique to HGG control and Sox9-GOF and overlapping across two independent biological replicates. (C) GO analysis of genes carrying H3K27ac peaks unique to Sox9-GOF compared with HGG control. (D) Comparison showing heatmaps of ChIP-H3K27ac signal at 4 kb from peak center in control versus Sox9-GOF EPN. (E) Venn diagram of the number peaks unique to EPN control and Sox9-GOF and overlapping across two independent biological replicates. (F) GO analysis of genes carrying H3K27ac peaks unique to Sox9-GOF compared with EPN control. (G) Representative images of H3K27ac colabeled with BrdU staining in P90 control and Sox9-GOF HGG tumors. (H) Box plots showing quantification of H3K27ac fluorescence intensity in BrdU-positive cells (n = 3 mice per group, 20 to 30 cells each; scale bar: 50 μm). (I) Representative images of H3K27ac colabeled with BrdU staining in P70 control and Sox9-GOF EPN tumors. (J) Box plots showing quantification of H3K27ac fluorescence intensity in BrdU-positive cells (n = 3 mice per group, 25 to 30 cells each; scale bar: 50 μm). P values in box plots were calculated using one-way ANOVA with Tukey’s test (*P < 0.05, ***P < 0.001).
Fig. 3.
Fig. 3.
Sox9 differentially regulates gene expression in 3xCr HGG and ZRFUS EPN tumor subtypes. (A and B) Volcano plots depicting RNA-Seq data comparing (A) 3xCr control versus Sox9-GOF HGG and (B) ZRFUS control versus Sox9-GOF EPN. RNA-Seq experiments were performed in independent biological triplicates (P < 0.05 and fold change of >2). (C) Expression heatmap analysis of up-regulated genes in Sox9-GOF HGG and down-regulated genes in Sox9-GOF EPN. (D) Bar graph showing the number of Sox9 GOF DEGs in 3xCr HGG compared with ZRFUS EPN; note the suppressed gene expression in Sox9-GOF EPN. (E) Venn diagram and (F and G) GO terms of DEGs from RNA-Seq data that overlap with genes acquiring or losing H3K27ac peaks in Sox9-GOF (F) 3xCr HGG and (G) ZRFUS EPN, respectively. (H and I) RT-qPCR shows fold enrichment of transcripts in Sox9-GOF relative to control in (H) 3xCr HGG and (I) ZRFUS EPN after normalization using Gapdh (n = 3 mice per group). Data shown as mean ± SEM; P values were calculated using Student’s t test (*P < 0.05, **P < 0.01, ***P < 0.001, ****P < 0.00001). RT-qPCR primer sequences are listed in Dataset S8.
Fig. 4.
Fig. 4.
Sox9 interacts with histone deacetylation complex in HGG. (A) Schematic of IP-Sox9 and MS proteomic experiment to identify Sox9 binding partners. (B and C) Volcano plots depicting IP-MS data of Sox9 interactome in (B) 3xCr HGG and (C) human HGG. Fold change was calculated over control samples of nuclear lysates incubated with beads only without antibody. IP-MS experiments were performed in independent biological triplicates for 3xCr HGG and two independent human patient HGG samples (P < 0.05 and fold change of >2). (D) Venn diagram showing the number of unique and overlapping Sox9 binding partners in mouse and human HGG. (E) GO terms associated with the 74 shared Sox9 interactors in mouse and human HGG showing enrichment of histone deacetylation. (F) Table showing Sox9 binding fold change and P values with NuRD complex members. Note all NuRD members are depicted by red circles in volcano plots shown in B and C. (G) Sox9 coimmunoprecipitation with NuRD members Hdac2 and Mta2 from human HGG nuclear lysates. (H) IHC of Sox9 in human HGG marginal and deep tumors (brown: Sox9; blue: hematoxylin counterstain; scale bar: 50 μm). (I) ChIP heatmaps at 2 kb from peak center of ChIP experiments with Sox9 and H3K27ac from human HGG tissue, showing that 9,539 of identified H3K27ac peaks are also co-occupied by Sox9 peaks. (J) ChIP-PCR validation of a subset of Sox9 and H3K27ac cotargets in human HGG. ChIP-PCR primer sequences are listed in Dataset S8.
Fig. 5.
Fig. 5.
Sox9 interacts with ZFTA-RELA and coregulates oncogenic programs in ZRFUS EPN. (A) Volcano plot depicting IP-MS data of Sox9 interactome in ZRFUS EPN. Fold change was calculated over control samples of nuclear lysates incubated with beads only without antibody. IP-MS experiments were performed in independent biological triplicates (P < 0.05 and fold change of >2). (B) Venn diagram showing the number of unique and overlapping Sox9 binding partners in 3xCr HGG, human HGG and ZRFUS EPN, and (C) GO terms associated with these interaction partners. NF-κB signaling unique to the ZRFUS EPN-specific Sox9 interactome is highlighted in red. (D) Quantification of Sox9 binding to ZFTA-RELA in ZRFUS EPN from IP-MS data. (E) Sox9 co-IP experiments with Rela proteins from ZRFUS EPN lysates. (F) Schematic of ChIP-Seq experiments from ZRFUS EPN cells and heatmap profiles demonstrating co-occupancy between Sox9, HA, Rela, and H3K27ac.

References

    1. Plass C., et al. , Mutations in regulators of the epigenome and their connections to global chromatin patterns in cancer. Nat. Rev. Genet. 14, 765–780 (2013). - PubMed
    1. Phillips R. E., Soshnev A. A., Allis C. D., Epigenomic reprogramming as a driver of malignant glioma. Cancer Cell 38, 647–660 (2020). - PMC - PubMed
    1. Brennan C. W., et al. ; TCGA Research Network, The somatic genomic landscape of glioblastoma. Cell 155, 462–477 (2013). - PMC - PubMed
    1. Gallo M., et al. , MLL5 orchestrates a cancer self-renewal state by repressing the histone variant H3.3 and globally reorganizing chromatin. Cancer Cell 28, 715–729 (2015). - PubMed
    1. Schwartzentruber J., et al. , Driver mutations in histone H3.3 and chromatin remodelling genes in paediatric glioblastoma. Nature 482, 226–231 (2012). - PubMed

Publication types

Substances

Supplementary concepts