. 2022 Jul 19;119(29):e2122420119.
doi: 10.1073/pnas.2122420119. Epub 2022 Jul 11.

Self-construction of actin networks through phase separation-induced abLIM1 condensates

Affiliations

Self-construction of actin networks through phase separation-induced abLIM1 condensates

Sen Yang et al. Proc Natl Acad Sci U S A. .

Abstract

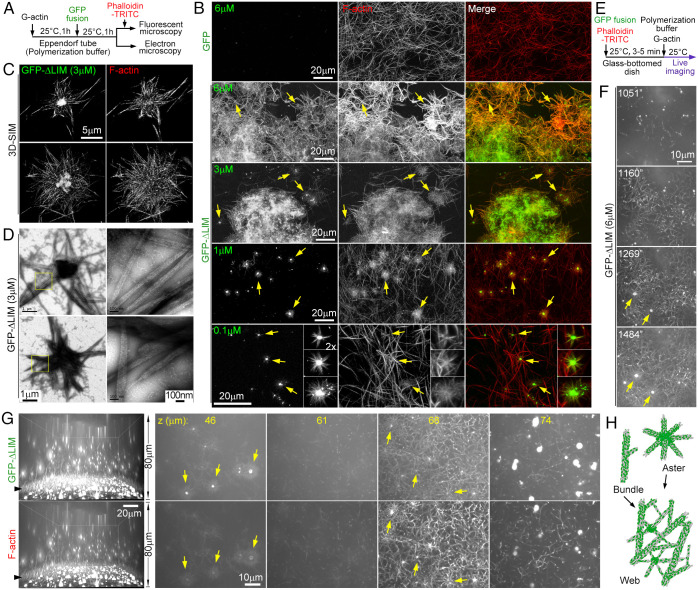
The abLIM1 is a nonerythroid actin-binding protein critical for stable plasma membrane-cortex interactions under mechanical tension. Its depletion by RNA interference results in sparse, poorly interconnected cortical actin networks and severe blebbing of migrating cells. Its isoforms, abLIM-L, abLIM-M, and abLIM-S, contain, respectively four, three, and no LIM domains, followed by a C terminus entirely homologous to erythroid cortex protein dematin. How abLIM1 functions, however, remains unclear. Here we show that abLIM1 is a liquid-liquid phase separation (LLPS)-dependent self-organizer of actin networks. Phase-separated condensates of abLIM-S-mimicking ΔLIM or the major isoform abLIM-M nucleated, flew along, and cross-linked together actin filaments (F-actin) to produce unique aster-like radial arrays and interconnected webs of F-actin bundles. Interestingly, ΔLIM condensates facilitated actin nucleation and network formation even in the absence of Mg2+. Our results suggest that abLIM1 functions as an LLPS-dependent actin nucleator and cross-linker and provide insights into how LLPS-induced condensates could self-construct intracellular architectures of high connectivity and plasticity.

Keywords: F-actin networks; actin polymerization; cell cortex; liquid–liquid phase separation; self-construction.


Conflict of interest statement

The authors declare no competing interest.

Figures

Fig. 1.
Fig. 1.
The abLIM1 isoforms associate with subcellular actin cytoskeletons, including aster-like arrays. (A) Isoforms of human abLIM1. Isoforms used in this study have identical amino acid sequences in their overlapping regions. Refer to SI Appendix, Fig. S1 for details on different isoforms. The ΔLIM mutant, which was used to represent abLIM-S in this study, contains a dematin-homologous sequence. LIM, LIM domain-containing region. (B) The abLIM-M was a widely and predominantly expressed abLIM1 isoform. The position of endogenous abLIM1-specific band was validated by RNAi. Flag-tagged isoforms transiently expressed in intact RPE1 cells were used as size markers. β-actin served as a loading control. Ctrl-i, control siRNA; abL1-i1 and abL1-i2, two independent siRNAs against human abLIM1 (31); IB, immunoblotting. (CE) Association of abLIM1 isoforms with actin networks. Cells expressing GFP-tagged constructs of abLIM1 were stained with phalloidin-TRITC to label F-actin and imaged with confocal microscopy (C), 3D-SIM (D), or GI-SIM (E). The framed regions in D show the GFP channel. Arrows point to typical F-actin-based astral arrays. The cyan and white arrows in D point to typical astral arrays at the ventral side and the dorsal site, respectively.
Fig. 2.
Fig. 2.
ΔLIM induces asters and webs of F-actin bundles in vitro. (A) Experimental scheme for BD, which is identical to our previous publication (31), for comparison. Actin induced to polymerize for 1 h was mixed with GFP or GFP-ΔLIM as illustrated, at the final actin concentration of 6 μM. Actin filaments were then visualized through EM or fluorescent microscopy. Phalloidin-TRITC (final concentration: 1 μM) was used to label F-actin for fluorescent microscopy. (B) Effects of GFP-ΔLIM on F-actin organizations in vitro. GFP served as a negative control. Arrows indicate representative astral structures. Note that a different scale is used for the 0.1-μM sample. A typical batch of purified proteins is shown in SI Appendix, Fig. S2A. (C and D) Detailed morphologies of asters, visualized by 3D-SIM (C) or EM with negative staining (D). Magnified Insets in D show actin bundles in the framed regions. (E) Experimental scheme for live imaging in F and G. The final concentration of G-actin was 6 μM. Phalloidin-TRITC (final concentration: 4 μM) was used to label F-actin. (F) Representative time-lapse images showing the formation of His-GFP-ΔLIM-induced actin webs. Z-stack images of 1-μm intervals were captured for the GFP autofluorescence to cover a depth of 6 μm close to the bottom of the substratum by spinning disk microscopy at ∼3.6-s intervals. The time started immediately after the addition of G-actin. Arrows denote two asters integrated into the web from outside the imaged zone. (G) Spatial distribution of ΔLIM-induced actin networks. The same sample was reimaged at a different field of view and at 0.5-μm intervals to cover a z depth of 80 μm after the live imaging in F. Shown is the xz view of 3D reconstructed images and representative z sections (from top to bottom). Arrowheads point to the dense web around the 68-μm position. Also refer to Movie S1. (H) Illustrations showing ΔLIM (green)-induced F-actin-based aster, bundle, and web and their relationship.
Fig. 3.
Fig. 3.
The abLIM1 undergoes LLPS through its DHU region. (A) The abLIM1 mutants used for in vitro assays in BG and a summary of their LLPS properties. (B) His-tagged GFP-ΔLIM underwent reversible clear–turbid cycles upon temperature shifts. Two equal aliquots of the protein were treated as depicted and photographed immediately. (C) Concentration-dependent LLPS of GFP-ΔLIM. The protein preparation was serially diluted on ice. Each sample was then incubated at 25 °C for 5 min, followed by fluorescent imaging. (D) Rapid fusion of GFP-ΔLIM liquid droplets. The protein preparation was incubated at 25 °C for 5 min and live imaged. (E) FRAP assays. In the image sequences, arrows indicate a typical droplet before (−10 s) and after (0 s to 150 s) photobleaching. The recovery curve was summarized from 23 droplets. Error bars represent mean ± SEM. (F) Concentration-dependent LLPS of His-tagged GFP-DHU. (G) His-tagged GFP and GFP-VHP, GFP-DHU25S, and GFP-ΔLIM25S did not undergo LLPS at even 120 μM. (H and I) GFP-DHU, GFP-ΔVHP, and abLIM-L-GFP formed liquid droplets in cells. RPE1 cells expressing GFP-tagged proteins illustrated in H were fixed at 24 h posttransfection and stained with phalloidin-TRITC and DAPI to respectively label actin cytoskeletons and nuclei (I). (J) The droplets displayed dynamic protein exchanges with the cytosol. FRAP assays were performed with living cells transfected for 24 h as in I. In the representative image sequences, arrows indicate droplets before and after photobleaching. Each recovery curve was summarized from 20 droplets. Error bars represent mean ± SEM.
Fig. 4.
Fig. 4.
Liquid droplets of ΔLIM or abLIM-M polymerize and bundle actin filaments into asters. (A and B) Massive actin polymerization from liquid droplets of GFP-ΔLIM. In A, the experiments were performed without phalloidin-TRITC to show that the aster formation is not due to the presence of phalloidin. The experiments in B were performed in the presence of 4 μM phalloidin-TRITC, as depicted in Fig. 2E, to label F-actin. G-actin (final concentration: 6 μM) was added (t = 0 s) into actin polymerization buffer containing preformed liquid droplets of GFP-ΔLIM, followed by live imaging at a single optical section. Three droplets (B, arrows) were magnified to show details. Refer to Movie S3 for detailed processes of B. (C) Positive size–length correlations between GFP-ΔLIM droplets and astral F-actin bundles. The size (volumes) of each droplet and the mean length of its astral bundles were measured from time-lapse images captured at 0 and 30 min, respectively. (D) CytoD and LatA inhibited the aster formation. GFP-ΔLIM liquid droplets were assayed as in B, except that GFP-ΔLIM liquid droplets formed in the presence of dimethyl sulfoxide (mock), CytoD, or LatA were used. (E) F-actin did not grow from GFP-ΔLIM immobilized on beads. GFP-ΔLIM expressed in HEK293T cells for 48 h was concentrated with anti-GFP antibody–conjugated magnetic beads. After the addition of G-actin as in B, the beads were live imaged immediately for 30 min (Top). A parallel sample with preformed liquid droplets of His-GFP-ΔLIM (3 μM) served as a positive control (Bottom). (F and G) Liquid droplets of abLIM-M were also able to generate asters. His-tagged GFP-abLIM-M purified from E. coli (F) formed liquid droplets in the presence of 1% PEG and induced aster formation after the addition of G-actin (G) as in B. A typical droplet (framed) was magnified to show details.
Fig. 5.
Fig. 5.
ΔLIM requires both DHU and VHP for the nucleation and tight bundling of F-actin. (A) Liquid droplets of DHU did not induce aster formation. Aster formation assays were performed in 6 μM His-tagged GFP-DHU as depicted in Fig. 2E. Arrows indicate typical F-actin streaks. Note that the majority of droplets were free of F-actin, although some appeared to become adhered to F-actin streaks during the imaging. Also see Movie S4. (B) DHU mildly bundled actin filaments. G-actin (6 μM) was polymerized in 6 μM His-GFP or His-GFP-tagged VHP, DHU, or ΔLIM. Actin bundles were then precipitated through centrifugation. Proteins in equivalent volumes of the supernatant (S) and pellet (P) fractions from each sample were resolved by SDS/PAGE, followed by Coomassie blue staining. Arrows point to full-length GFP or GFP-tagged proteins. Actin levels relative to the total levels (S + P) in the S or the P fractions were quantified from gels from three independent experiments (mean ± SD). Paired Student’s t test: ns, no significance (P > 0.05); **P < 0.01; ***P < 0.001. (C) ΔLIM potently stimulated polymerization of 2 μM G-actin. G-actin (containing 10% pyrene actin) was mixed with the indicated proteins (final concentrations: 3 μM for GFP-ΔLIM or GFP-DHU; 6 μM for GFP, GFP-VHP, or GFP-ΔLIM25S) in Ca2+-containing actin storage buffer and incubated as illustrated. After the addition of Mg2+-abundant 10× polymerization buffer, polymerization kinetics was monitored with a microplate reader that measured the increased fluorescence of pyrene actin in actin filaments. The curves were summarized from three sets of independent experiments (mean ± SEM). (D) ΔLIM effectively stimulated actin polymerization in the absence of polymerization buffer. GFP-ΔLIM or GFP (final concentration: 6 μM) was mixed with G-actin in actin storage buffer (final concentration: 2 or 6 μM), followed immediately by the measurement of pyrene fluorescence. The curves were summarized from three sets of independent experiments (mean ± SEM). (E) ΔLIM induced actin polymerization into asters or webs even in the absence of polymerization buffer. After the completion of biochemical measurements in D, the samples were mounted into coverslips with mounting medium and directly imaged for GFP and pyrene autofluorescence. Framed regions were magnified to show details. Arrows point to typical asters, with cyan ones pointing to asters containing a hollow center. (F) A model illustrating roles of abLIM1. The abLIM1, at least its abLIM-S or abLIM-M isoform, undergoes LLPS to form condensates that nucleate actin and cross-link together actin filaments to generate asters and sporadic bundles, which further develop into webs.
Fig. 6.
Fig. 6.
F-actin-associated ΔLIM and abLIM-M are phase separated in cells. (A and B) ΔLIM and abLIM-M molecules constantly spread along cellular F-actin bundles. RPE1 cells were transfected to express the indicated Dendra-tagged fusion proteins. A fraction of the proteins in the framed regions was photoconverted to emit red fluorescence, followed by dual-color live imaging (A). The length changes of red fluorescence along F-actin bundles over time, relative to the initial (t = 0 s) time point, were quantified from 15 cells for each construct (B). Data points are presented as mean ± SEM. (C) Liquid droplets of GFP-ΔLIM emerged during the disassembly of intracellular F-actin and were rapidly resorbed by repolymerizing F-actin. RPE1 cells transiently expressing GFP-ΔLIM were treated with LatA (1 μg/mL), followed by live imaging (Top). Arrows indicate liquid droplets undergoing fusion over time in the framed region. See Movie S5. After imaging for ∼4.5 h, LatA was washed out to allow actin repolymerization and the same cell was imaged (Bottom). Arrowheads point to representative liquid droplets resorbed over time in the framed region. Also see Movie S6. (D) GFP-ΔLIM molecules actively exchanged between liquid droplets and the cytosol. RPE1 cells expressing GFP-ΔLIM were treated with LatA for 1 h to induce liquid droplets, followed by FRAP assays. Arrows indicate dynamic changes of a representative droplet after photobleaching. In the recovery curve, data points are presented as mean ± SEM. (E) GFP-ΔLIM25S in cells did not show F-actin association or form liquid droplets upon the LatA treatment. (F) Droplet absorptions were observed during the formation of in vitro actin webs. Actin polymerization was performed in 3 μM His-GFP-ΔLIM as depicted in Fig. 2E but without phalloidin-TRITC, to exclude potential influence of the drug on actin polymerization and organization. Z-stack GFP fluorescent images were captured for a droplet-abundant area at 1-μm intervals to cover a depth of 6 μm and ∼3.6-s intervals by spinning disk microscopy. The time started immediately after the addition of G-actin freshly diluted in polymerization buffer on ice. Arrows denote liquid droplets that were gradually absorbed during the dense F-actin web formation.

Similar articles

Cited by

References

    1. Bennett V., Baines A. J., Spectrin and ankyrin-based pathways: Metazoan inventions for integrating cells into tissues. Physiol. Rev. 81, 1353–1392 (2001). - PubMed
    1. Baines A. J., The spectrin-ankyrin-4.1-adducin membrane skeleton: Adapting eukaryotic cells to the demands of animal life. Protoplasma 244, 99–131 (2010). - PubMed
    1. Köster D. V., Mayor S., Cortical actin and the plasma membrane: Inextricably intertwined. Curr. Opin. Cell Biol. 38, 81–89 (2016). - PubMed
    1. Tinevez J. Y., et al. , Role of cortical tension in bleb growth. Proc. Natl. Acad. Sci. U.S.A. 106, 18581–18586 (2009). - PMC - PubMed
    1. Chugh P., et al. , Actin cortex architecture regulates cell surface tension. Nat. Cell Biol. 19, 689–697 (2017). - PMC - PubMed

Publication types

MeSH terms

LinkOut - more resources