. 2022 Jul 19;119(29):e2114365119.
doi: 10.1073/pnas.2114365119. Epub 2022 Jul 11.

Mass spectrometry imaging to explore molecular heterogeneity in cell culture

Affiliations

Mass spectrometry imaging to explore molecular heterogeneity in cell culture

Tanja Bien et al. Proc Natl Acad Sci U S A. .

Abstract

Molecular analysis on the single-cell level represents a rapidly growing field in the life sciences. While bulk analysis from a pool of cells provides a general molecular profile, it is blind to heterogeneities between individual cells. This heterogeneity, however, is an inherent property of every cell population. Its analysis is fundamental to understanding the development, function, and role of specific cells of the same genotype that display different phenotypical properties. Single-cell mass spectrometry (MS) aims to provide broad molecular information for a significantly large number of cells to help decipher cellular heterogeneity using statistical analysis. Here, we present a sensitive approach to single-cell MS based on high-resolution MALDI-2-MS imaging in combination with MALDI-compatible staining and use of optical microscopy. Our approach allowed analyzing large amounts of unperturbed cells directly from the growth chamber. Confident coregistration of both modalities enabled a reliable compilation of single-cell mass spectra and a straightforward inclusion of optical as well as mass spectrometric features in the interpretation of data. The resulting multimodal datasets permit the use of various statistical methods like machine learning-driven classification and multivariate analysis based on molecular profile and establish a direct connection of MS data with microscopy information of individual cells. Displaying data in the form of histograms for individual signal intensities helps to investigate heterogeneous expression of specific lipids within the cell culture and to identify subpopulations intuitively. Ultimately, t-MALDI-2-MSI measurements at 2-µm pixel sizes deliver a glimpse of intracellular lipid distributions and reveal molecular profiles for subcellular domains.

Keywords: cellular heterogeneity; lipidomics; single-cell mass spectrometry; t-MALDI-2-MSI.


Conflict of interest statement

The authors declare no competing interest.

Figures

Fig. 1.
Fig. 1.
(A and B) Vero-B4 cell culture visualized in (A) a fluorescence microscopy image using WGA stain and (B) the corresponding ion signal intensity distribution of [DAG(34:1)−H2O+H]+ registered at m/z 577.520 using t-MALDI-2-MSI. (C) Zoom-in of t-MALDI-2-MS image overlaid with the result of a single-cell segmentation based on microscopy data (orange outlines). (Scale bars, 200 µm.)
Fig. 2.
Fig. 2.
Illustration of the workflow for single-cell analysis by the combination of microscopy and high-resolution MALDI-MSI. Segmentation of the microscopy data are followed by a pixelwise coregistration with MALDI-MSI data. Mass spectra from pixels associated with a specific cell are summed to single-cell mass spectra and are considered as the absolute single-cell intensities. Pixels that are associated with more than one cell are discarded. Single-cell data can subsequently be used for ML classification or any desired method of statistical data analysis. (Scale bar, 50 µm.)
Fig. 3.
Fig. 3.
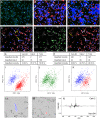
Classification results for cocultured Vero-B4 and Caki-2 cells. (A) Microscopy overlay of the WGA and DAPI channels. (B) Classification results for the cocultured system using an SVM based on single-cell mass spectra, trained with a set of a few hundred m/z values on the respective monocultures. (C) Classification of the coculture based on three microscopic images (bright-field, Hoechst stain, and WGA stain) using Olympus TruAI software, trained on the respective monocultures. White arrows point to differences in the classification for individual cells. (D) Classification results for a biological replicate of the cocultured system using the SVM trained on the original dataset. (E) Ground-truth identification of Vero-B4 (gray) and Caki-2 cells (green) based on live-cell staining. (F) Classification results for the biological replicate of the cocultured system using the SVM trained on a dataset based on the same cell cultures. Arrows are used to point to exemplary differences in classification in D and F: white arrows, cells correctly classified; yellow arrows, cells misclassified according to the ground-truth data. (G and H) Numerical classification results of D (trained on a different biological replicate) and F (trained on the same biological replicate). (IK) Unsupervised statistical analysis: PCA of pooled data from (I) both monocultures, (J) the coculture, and (K) the coculture, with cells colored according to their classification by the SVM. (LN) Microscopy images of individual Caki-2 (L; colored in blue) and Vero-B4 (M; colored in red) cells, as selected and marked in the PCA plot with outlines, and (N) their respective MALDI-2 difference mass spectra. (Scale bar, 200 µm.)
Fig. 4.
Fig. 4.
Histograms of selected ion signal intensities for mono- and cocultured Vero-B4 and Caki-2 cells. (A) Histograms for [DAG(34:1)−H2O+H]+ found with a homogeneous distribution in both cell types with similar ion intensities. (B) Histograms for [HexCer(d18:1/16:0)+H]+ with a homogeneous distribution in Caki-2 and heterogeneous distribution in Vero-B4 monocultures and a broad, overlapping distribution in coculture. (C) Histograms for [Cer(d18:1/24:1)−H2O+H]+ displaying a heterogeneous distribution in Caki-2 and homogeneous distribution in Vero-B4 monocultures but a heterogeneous distribution for both cell types in coculture. (Bottom) Overlay of histograms of subpopulations within the coculture based on classification results described in the text.
Fig. 5.
Fig. 5.
(A) PCA based on single-cell mass spectra of THP-1 cells for three time points during differentiation from monocytes to M0 macrophages. (BD) Histograms of selected ion signal intensities. Cells show (B) an increase of [TAG(50:1)+H]+ signal and (C) a decrease of [PE(38:2)+H]+ signal during differentiation. (D) For [PE(38:5)+H]+, no change is observed. Differences in lipid expression profiles correlate with changes in morphology from typical monocyte cells at 24 h (e.g., cell in blue square) to typical macrophage cells at 72 h (green square). Asterisks indicate the position of the selected cells in the histograms.
Fig. 6.
Fig. 6.
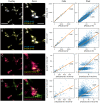
Visualization of inter- and intracellular heterogeneity for Vero-B4 cells of selected ions. (Left) t-MALDI-2-MS images of the respective m/z values at a pixel size of 2 µm and a zoom-in of individual cells point to different characteristics of heterogeneity. (Right) Correlation plots for selected lipid ion pairs on the single-cell and cell-associated pixel level. (A) [PE(34:1)+H]+ and [PE(36:2)+H]+. (B) [PE(34:1)+H]+ and [PC(34:1)+H]+. (C) [HexCer(d18:1/16:0)+H]+ and Cer(d18:1/16:0)+H]+. (D) [HexCer(d18:1/16:0)+H]+ and [Hex2Cer(d18:1/16:0)+H]+. (Scale bars, 100 and 50 µm [zoom-in].).

References

    1. Armbrecht L., Dittrich P. S., Recent advances in the analysis of single cells. Anal. Chem. 89, 2–21 (2017). - PMC - PubMed
    1. Taylor M. J., Lukowski J. K., Anderton C. R., Spatially resolved mass spectrometry at the single cell: Recent innovations in proteomics and metabolomics. J. Am. Soc. Mass Spectrom. 32, 872–894 (2021). - PMC - PubMed
    1. Avery S. V., Microbial cell individuality and the underlying sources of heterogeneity. Nat. Rev. Microbiol. 4, 577–587 (2006). - PubMed
    1. Davidson C. J., Surette M. G., Individuality in bacteria. Annu. Rev. Genet. 42, 253–268 (2008). - PubMed
    1. Raj A., van Oudenaarden A., Nature, nurture, or chance: Stochastic gene expression and its consequences. Cell 135, 216–226 (2008). - PMC - PubMed

Publication types

MeSH terms

LinkOut - more resources