. 2022 Jul 26;119(30):e2123065119.
doi: 10.1073/pnas.2123065119. Epub 2022 Jul 12.

The global succinylation of SARS-CoV-2-infected host cells reveals drug targets

Affiliations

The global succinylation of SARS-CoV-2-infected host cells reveals drug targets

Quan Liu et al. Proc Natl Acad Sci U S A. .

Abstract

SARS-CoV-2, the causative agent of the COVID-19 pandemic, undergoes continuous evolution, highlighting an urgent need for development of novel antiviral therapies. Here we show a quantitative mass spectrometry-based succinylproteomics analysis of SARS-CoV-2 infection in Caco-2 cells, revealing dramatic reshape of succinylation on host and viral proteins. SARS-CoV-2 infection promotes succinylation of several key enzymes in the TCA, leading to inhibition of cellular metabolic pathways. We demonstrated that host protein succinylation is regulated by viral nonstructural protein (NSP14) through interaction with sirtuin 5 (SIRT5); overexpressed SIRT5 can effectively inhibit virus replication. We found succinylation inhibitors possess significant antiviral effects. We also found that SARS-CoV-2 nucleocapsid and membrane proteins underwent succinylation modification, which was conserved in SARS-CoV-2 and its variants. Collectively, our results uncover a regulatory mechanism of host protein posttranslational modification and cellular pathways mediated by SARS-CoV-2, which may become antiviral drug targets against COVID-19.

Keywords: NSP14; SARS-CoV-2; SIRT5; antiviral; succinylproteomics.


Conflict of interest statement

The authors declare no competing interest.

Figures

Fig. 1.
Fig. 1.
Global proteomics of succinylation and abundance upon SARS-CoV-2 infection. (A) Workflow of multiomics of SARS-CoV-2–infected cells. Infected Caco-2 cells were harvested at 0, 12, and 24 hpi, and the lysates were subjected to transcriptomics, quantitative proteomics, and succinyl-proteomics analysis. (B) Protein abundance in cells upon viral infection. The increased (orange) or decreased (blue) protein number across the infection course (Left). Volcano plot of protein abundance quantification at 24 hpi as comparison with 0 hpi (Right). (C) Succinylated protein abundance in cells upon viral infection. The increased (orange) or decreased (blue) number of succinylated proteins across the infection course (Left). Volcano plot of succinylated protein abundance quantification at 24 hpi as comparison with 0 hpi (Right). (D) Succinylated sites in cells upon viral infection. The increased (orange) or decreased (blue) number of succinylated sites across the infection course (Left). Volcano plot of succinylated sites at 24 hpi as comparison with 0 hpi (Right). We defined log2 fold-change > 0.5 as up-regulated proteins/sites (P < 0.01), and log2 fold-change < −0.5 as down-regulated proteins/sites (P < 0.01). SLC25A5, the mitochondrial solute carrier family 25, was the most up-regulated protein. (E) Changed succinylated proteins across the infection course. Scatterplot showed the fold-change of succinylated proteins in infected cells at 12/0 h (x axis) and 24/0 h (y axis). The dashed line represents log2 fold-change of 0. (F) Merged succinylated protein abundance with total protein abundance in infected cells. Scatterplot showed the fold-changes of total protein abundance in infected cells at 24/0 h (x axis) and succinylated protein abundance at 24/0 h (y axis). The dashed line represents log2 fold-change of ± 0.5.
Fig. 2.
Fig. 2.
Succinylation of SARS-CoV-2 N and M proteins. (A) Succinylated sites in the SARS-CoV-2 N and M proteins. The number represents the location of succinylation. M contained two succinylated sites, and N contained 12 succinylated sites. The viral protein abundance was expressed as label-free quantification (LFQ). (B) Abundance of M and N proteins in SARS-CoV-2-infected cells during the infection course. (C) Succinylated sites in the N protein of SARS-CoV-2. Two structural domains of RNA binding domain and dimerization domain predicted by InterPro are shown (51). (D) Amino acid sequence alignment of N protein succinylated site K65 between SARS-CoV-2 and other coronaviruses. Other succinylated sites of N protein are shown in SI Appendix, Fig. S9. (E and F) The succinylated site was mapped to the crystal structure of N protein RNA binding domain (E) and dimerization domain (F). (G) Succinylated sites K166 and K180 in the M protein of SARS-CoV-2. (H) Amino acid sequence alignment of M protein from SARS-CoV-2 and coronaviruses. (I) The succinylated sites were mapped to the crystal structure of M protein. Two succinyl lysine sites were highlighted within the crystal structure of SARS-CoV-2 M that was in silico predicted by AlphaFold (52).
Fig. 3.
Fig. 3.
Cluster analysis of host protein succinylation sites upon SARS-CoV-2 infection. (A) Scatterplot illustrated all succinylated sites were divided into nine clusters based on the log2 fold-changes of ± 0.5 in 12/0h (x axis) compared to 24/0h (y axis). The dashed lines represent log2 fold-change of ± 0.5. (B) Changes of the succinylated sites in each cluster at 12 and 24 h compared with 0 h post infection. The color of each cluster in B corresponds to that in A.
Fig. 4.
Fig. 4.
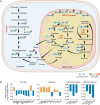
Succinylation of enzymes associated with metabolic pathways upon SARS-CoV-2 infection. (A) Succinylated enzymes involved in carbon metabolisms of glycolysis, TCA cycle, and fatty acid oxidation, and mitochondrial transport. The blue ovals represent succinylated proteins, the numbers of pie charts represent the succinylated sites, and the color of pie chart represents the succinylated sites level at 24 h compared to 0 h after infection. The enzymes for glycolysis included PFKP, ALDOA, TPI1, GAPDH, ENO1, ME2, PKM, and PCK2. The enzymes for the TCA cycle included CS, ACO2, DLST, SUCLG1, SDHA, FH, OGDH, MDH2, IDH1, IDH2, and PDHA1. The enzymes for fatty acid oxidation contained ACADVL, HADHA and HADHB. The enzymes for mitochondrial transport included SLC25A1, SLC25A4, SLC25A5, SLC25A6, SLC25A13, and SLC25A24. (B) Fold-changes of succinylated proteins in abundance at 24 h postinfection as comparison with 0 h postinfection. Nine succinylated proteins in TCA cycle, eight succinylated proteins in glycolysis, three succinylated proteins in ADP/ATP transport, and three succinylated proteins in fatty acid oxidation are shown.
Fig. 5.
Fig. 5.
Regulation of protein succinylation and its effects on virus proliferation. (A) Co-IP analysis of NSP14 and SIRT5 in HEK293T cells. Vector Flag-NSP14 or HA-SIRT5 was transfected into HEK293T cells, and anti-Flag and HA IPs were analyzed by immunoblot with HA or Flag antibody. (B) Confocal imaging of NSP14 (red) and SIRT5 (green) in HEK293T cells. (Scale bars, 10 µm.) (C) Western blot analysis of pan-succinyllysine in HEK293T cells. Vector Flag-NSP14 or HA-SIRT5 with increasing amounts was transfected into HEK293T cells, following by the Western blot analysis with corresponding antibody. EV, empty vector; Con, control. (D) The succinylation levels after knockdown of SIRT5 by siRNA or overexpressed NSP14 were detected by the RT-qPCR in HEK293T cells. (EG) Overexpression of SIRT5 reduced virus replication. Caco-2 and HEK293T-hACE2 cells were transfected with HA-SIRT5 vector, and infected with into SARS-CoV-2 after 24 h, then the viral replication was detected by the RT-qPCR (E) and Western blot (F) at 24 hpi. Student’s t tests were used for statistical analysis and the results are shown as smean ± SEM. Each experiment has three biological samples. (G) SIRT5 reduced SARS-CoV-2 proliferation in Caco-2 cells by IFA. After transfection of vector HA-SIRT5, viral N protein (green) and SIRT5 (red) were detected, nucleic DNA was stained by DAPI. (Scale bars, 100 µm.)
Fig. 6.
Fig. 6.
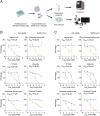
Inhibitors of succinylation in host cells reduce virus replication of SARS-CoV-2. (A) Schematic of viral infectivity and detection assays. Caco-2 and 293T-hACE2 cells were infected with SARS-CoV-2 (MOI = 0.01) and treated with 10 μM different drugs, and virus replication was detected by RT-qPCR and IFA. The detailed data of drugs used in the study are shown in SI Appendix, Table S1. (B and C) Cell viability was detected by cell counting (CCK-8) assay in Caco-2 (B) and 293T-hACE2 cells (C). Orange, viral infectivity; blue, cell viability. Independent experiments were repeated three times. Error bars represent the mean ± SEM of three biological replicates.

References

    1. Zhu N., et al. ; China Novel Coronavirus Investigating and Research Team, A novel coronavirus from patients with pneumonia in China, 2019. N. Engl. J. Med. 382, 727–733 (2020). - PMC - PubMed
    1. Wang D., et al. , Clinical characteristics of 138 hospitalized patients with 2019 novel coronavirus-infected pneumonia in Wuhan, China. JAMA 323, 1061–1069 (2020). - PMC - PubMed
    1. Dhama K., et al. , Coronavirus disease 2019-COVID-19. Clin. Microbiol. Rev. 33, e00028-20 (2020). - PMC - PubMed
    1. Blachere N. E., Hacisuleyman E., Darnell R. B., Vaccine breakthrough infections with SARS-CoV-2 variants. Reply. N. Engl. J. Med. 385, e7 (2021). - PubMed
    1. Blanquart F., et al. , Characterisation of vaccine breakthrough infections of SARS-CoV-2 Delta and Alpha variants and within-host viral load dynamics in the community, France, June to July 2021. Euro Surveill. 26, 2100824 (2021). - PMC - PubMed

Publication types

MeSH terms