. 2022 Jul 26;119(30):e2119872119.
doi: 10.1073/pnas.2119872119. Epub 2022 Jul 18.

A general theory for temperature dependence in biology

Affiliations

A general theory for temperature dependence in biology

José Ignacio Arroyo et al. Proc Natl Acad Sci U S A. .

Abstract

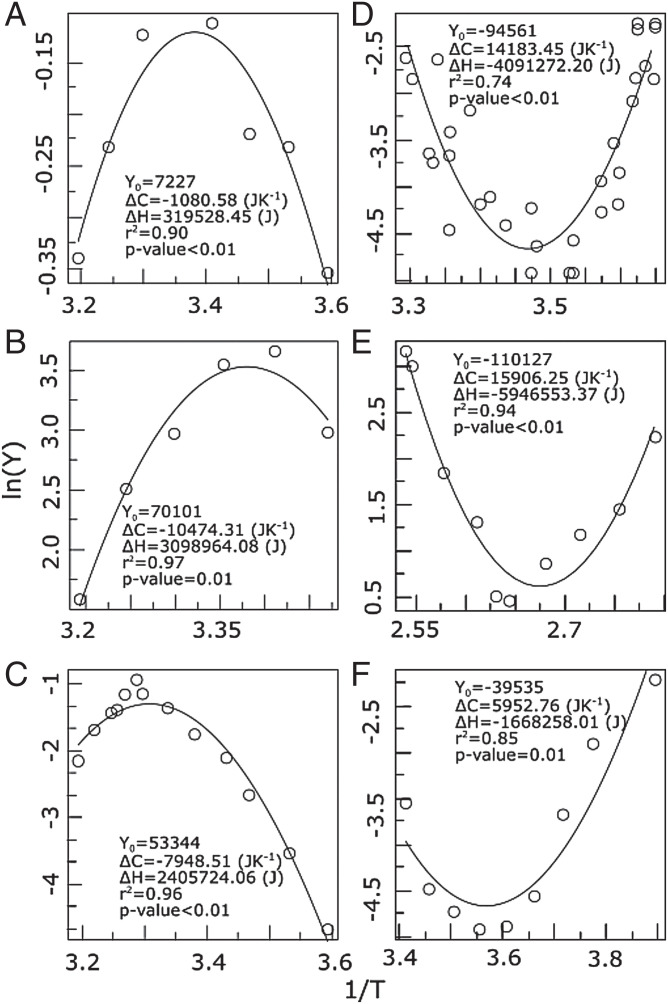
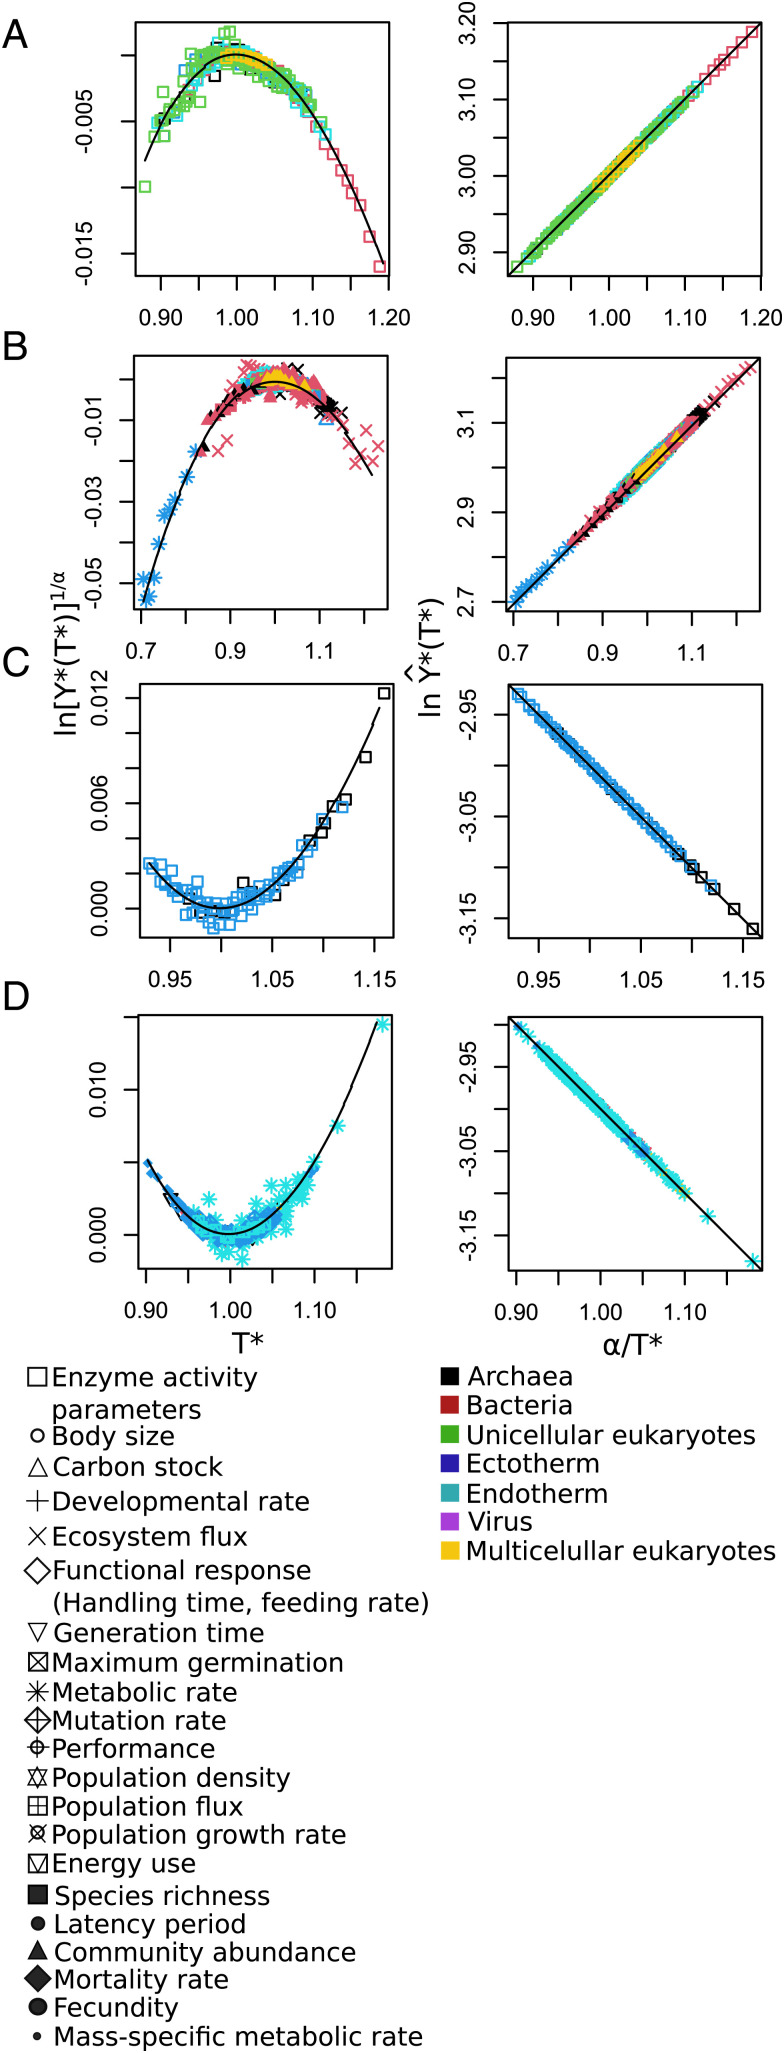
At present, there is no simple, first principles-based, and general model for quantitatively describing the full range of observed biological temperature responses. Here we derive a general theory for temperature dependence in biology based on Eyring-Evans-Polanyi's theory for chemical reaction rates. Assuming only that the conformational entropy of molecules changes with temperature, we derive a theory for the temperature dependence of enzyme reaction rates which takes the form of an exponential function modified by a power law and that describes the characteristic asymmetric curved temperature response. Based on a few additional principles, our model can be used to predict the temperature response above the enzyme level, thus spanning quantum to classical scales. Our theory provides an analytical description for the shape of temperature response curves and demonstrates its generality by showing the convergence of all temperature dependence responses onto universal relationships-a universal data collapse-under appropriate normalization and by identifying a general optimal temperature, around 25 C, characterizing all temperature response curves. The model provides a good fit to empirical data for a wide variety of biological rates, times, and steady-state quantities, from molecular to ecological scales and across multiple taxonomic groups (from viruses to mammals). This theory provides a simple framework to understand and predict the impact of temperature on biological quantities based on the first principles of thermodynamics, bridging quantum to classical scales.

Keywords: metabolic theory; scaling; temperature kinetics.


Conflict of interest statement

The authors declare no competing interest.

Figures

Fig. 1.
Fig. 1.
Temperature response curves compared to the predictions of Eqs. 5 and 7 for a wide diversity of biological examples. Plotted are ln(Y) vs. 1/T (in 1/K, where K is kelvin) showing (AC) convex patterns and (DF) concave patterns: (A) metabolic rate in the multicellular insect Blatella germanica, (B) maximum relative germination in alfalfa (for a conductivity of 32.1 dS/m), (C) growth rate in Saccharomyces cerevisiae, (D) mortality rate in the fruit fly (Drosophila suzukii), (E) generation time in the archaea Geogemma barossii, and (F) metabolic rate (during steady-state torpor) in the rodent Spermophilus parryii. Here the curve corresponds to the metabolic rate in response to environmental temperature and not body temperature. The x axis is in units of (1/K)×103. Examples come from references 58–63.
Fig. 2.
Fig. 2.
Universal patterns of temperature response predicted by Eqs. 9 and 10. (Left) The convex and concave nonlinear patterns predicted when lnY* is plotted vs. 1/T* (Eq. 9) and (Right) the straight lines predicted when lnY^* is plotted vs. 1/T* (Eq. 10). In theory, if rescaled data collapse into a single relationship, it means that all respond to the same general law. As expected, all curves regardless of variable, environment, and taxa collapse onto a single curve when plotted in either of these ways. These rescalings explicitly show the universal temperature dependence of the data used in Fig. 1, as well as additional data from compiled studies. (A and B) Molecular (enzymatic) data exhibiting the predicted concave and convex patterns on the left, while (C and D) show corresponding concave and convex patterns for data above the molecular level. Note that there appears to be no variance in the fits to the linear predictions (Right), whereas there is significant variation in the nonlinear ones (Left). This is basically because ln(Y^*)ln(Y*). The value of ln(Y*) is typically around 0.01 with a variance much smaller than 0.005. Since ln(Y^*)=ln(Y*)+aln(e/T*) and ln(Y^*) is typically around 3, fluctuations in ln(Y*) are very much smaller and consequently completely lost. The point is that the difference between what is plotted in Left vs. that in Right, namely, aln(e/T*), is in absolute value very large [more than 10 times the value of ln(Y^*)]; furthermore, it is almost a constant over the range of temperatures since it is logarithmic, whereas all of the temperature variation is in the much smaller term ln(Y^*).

References

    1. Hochachka P. W., Somero G. N., Biochemical Adaptation: Mechanism and Process in Physiological Evolution (Oxford University Press, 2002).
    1. Brown J. H., Gillooly J. F., Allen A. P., Savage V. M., West G. B., Toward a metabolic theory of ecology. Ecology 85, 1771–1789 (2004).
    1. Schulte P. M., Healy T. M., Fangue N. A., Thermal performance curves, phenotypic plasticity, and the time scales of temperature exposure. Integr. Comp. Biol. 51, 691–702 (2011). - PubMed
    1. Dell A. I., Pawar S., Savage V. M., Systematic variation in the temperature dependence of physiological and ecological traits. Proc. Natl. Acad. Sci. U.S.A. 108, 10591–10596 (2011). - PMC - PubMed
    1. Grimaud G. M., Mairet F., Sciandra A., Bernard O., Modeling the temperature effect on the specific growth rate of phytoplankton: A review. Rev. Environ. Sci. Biotechnol. 16, 625–645 (2017).

Publication types

LinkOut - more resources