. 2022 Jul 26;119(30):e2122202119.
doi: 10.1073/pnas.2122202119. Epub 2022 Jul 18.

Competition between growth and shear stress drives intermittency in preferential flow paths in porous medium biofilms

Affiliations

Competition between growth and shear stress drives intermittency in preferential flow paths in porous medium biofilms

Dorothee L Kurz et al. Proc Natl Acad Sci U S A. .

Abstract

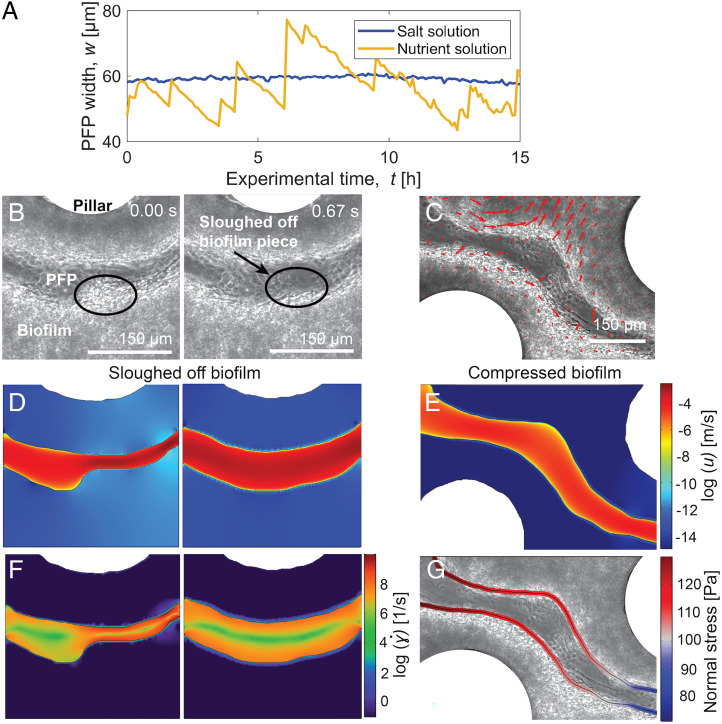
Bacteria in porous media, such as soils, aquifers, and filters, often form surface-attached communities known as biofilms. Biofilms are affected by fluid flow through the porous medium, for example, for nutrient supply, and they, in turn, affect the flow. A striking example of this interplay is the strong intermittency in flow that can occur when biofilms nearly clog the porous medium. Intermittency manifests itself as the rapid opening and slow closing of individual preferential flow paths (PFPs) through the biofilm-porous medium structure, leading to continual spatiotemporal rearrangement. The drastic changes to the flow and mass transport induced by intermittency can affect the functioning and efficiency of natural and industrial systems. Yet, the mechanistic origin of intermittency remains unexplained. Here, we show that the mechanism driving PFP intermittency is the competition between microbial growth and shear stress. We combined microfluidic experiments quantifying Bacillus subtilis biofilm formation and behavior in synthetic porous media for different pore sizes and flow rates with a mathematical model accounting for flow through the biofilm and biofilm poroelasticity to reveal the underlying mechanisms. We show that the closing of PFPs is driven by microbial growth, controlled by nutrient mass flow. Opposing this, we find that the opening of PFPs is driven by flow-induced shear stress, which increases as a PFP becomes narrower due to microbial growth, causing biofilm compression and rupture. Our results demonstrate that microbial growth and its competition with shear stresses can lead to strong temporal variability in flow and transport conditions in bioclogged porous media.

Keywords: bacterial biofilms; bioclogging; biofilm dynamics; biofouling; porous medium flow.


Conflict of interest statement

The authors declare no competing interest.

Figures

Fig. 1.
Fig. 1.
PFP formation and intermittency in a model porous medium. Fluid flow rate, Q = 1 mL/h. (A) Schematic of the microfluidic device showing the porous domain (height, h = 100 µm; pore size, d = 300 µm) and locations of the pressure measurements (P). (B–E) Bright-field time-lapse images of biofilm formation, from initial attachment (B), through the formation of streamers (orange outline) and clusters (white outline) (C), to near clogging (D and E). (FH) Segmented images of the porous medium at three points in time, showing the pillars (white), biofilm (black), and PFPs (yellow). The images were taken at times t = 33.7 h (F), t = 33.8 h (G), and t = 35.2 h (H), with the recorded pressure difference Δp = 185 mbar (F), Δp = 50 mbar (G), and Δp = 160 mbar (H). Closing PFPs have a narrow width (F and H), while open PFPs have a larger width (G). PFPs can branch (blue circle) and coalesce (green circle). (I) Mean PFP width, w, (yellow curve) and pressure difference, Δp, (red curve) across the entire porous domain as a function of time. Gray bars indicate every second cycle of rapid PFP opening and gradual PFP closing. An opening event was defined to occur at a PFP width change of 5 µm. Biofilm behavior causes a decrease in pressure difference across the porous domain when PFPs open and an increase in pressure difference when PFPs close. For example, narrowing of the PFPs by 27 µm over a period of 1.4 h (G, H) increases the pressure difference by 110 mbar, and very rapid widening of the PFPs by 54 µm decreases the pressure difference by 135 mbar (F, G). Letters correspond to the experimental images in F–H. Note that the pressure difference for the initial biofilm-free porous domain at the imposed fluid flow rate was subtracted, in order to isolate the impact of the biofilm on the pressure difference.
Fig. 2.
Fig. 2.
In the intermittency observed in PFPs, PFP closing is driven by microbial growth, while PFP opening is driven by hydrodynamically induced stresses on the biofilm. (A) For a mature biofilm, replacing the flowing nutrient solution with a nutrient-free salt solution causes the intermittency in the PFP width to cease (blue curve), in comparison with continued intermittency under constant nutrient flow (yellow curve). This demonstrates that PFP closing is driven by microbial growth. Before data collection, biofilms were allowed to develop for 24 h, and the solution within the porous medium was allowed to equilibrate for 2 h after the change to a salt solution, before flow was resumed. Bright-field image sequences of the biofilms corresponding to this data are shown in SI Appendix, Fig. S4. (B) Images acquired in rapid sequence during PFP opening, showing the detachment of a portion of the biofilm (area ∼3,600 µm2) adjacent to the PFP. The black ellipse indicates the location of the sloughed-off biofilm. (C) DIC analysis of high-speed videos showing biofilm movement during PFP opening through compression of the biofilm structure. Red arrows indicate local movement within the biofilm mostly normal to the PFP, with larger arrows signifying a larger local biofilm movement. (D, E) Numerically computed fluid velocity u (note logarithmic color scale) for the geometries corresponding to the images in B and C, showing higher velocities in the narrower PFP regions. (F) Shear rate (note logarithmic color scale) computed from the numerical velocity field. Shear rates next to the PFP boundaries are much higher in a narrow path compared to an open path. (G) The stress normal to the PFP boundaries, obtained from the numerical simulations.
Fig. 3.
Fig. 3.
A model of biofilm formation and behavior in flow predicts that PFP intermittency is dependent on microbial growth and fluid flow velocity. (AC) Simulated biofilm growth and PFP intermittency, similar to experimental images in Fig. 1 FH. The segmented images represent the simulation of a porous domain of 5 × 2 mm at time points t = 77.4 h (A), t = 77.6 h (B), and t = 79.2 h (C). PFPs are highlighted in yellow, biofilm is shown in black, and pillars are shown in white. The mathematical model was implemented using the same parameters and boundary conditions as the experimental setup (Fig. 1A), with d = 300 µm, h = 100 µm, porosity = 0.77, and fluid flow rate = 1 mL/h. Biofilm-related parameters such as kinematic viscosity = 6.67 × 10⁻⁶ m2/s, yield stress = 0.4 Pa, and permeability = 2.2 × 10⁻¹⁴ m2 were taken from experimental measurements following existing protocols (SI Appendix). Biofilm density = 1,200 kg/m3 was obtained from the literature (37). A detailed description of the derivation of these parameters can be found in SI Appendix. (D) Predicted PFP width showed intermittency when microbial growth was included (yellow curve) but not when growth was excluded from the model (blue curve). A lower fluid flow rate of 0.05 mL/h (green line) induced a decrease in mean PFP width and subsequent disappearance of the PFPs. Letters correspond to the images in A–C. Shading indicates the error bars showing the SD of PFP width.
Fig. 4.
Fig. 4.
PFP intermittency occurs at high flow velocities and large pore sizes. (A) Schematics of part of the porous domain showing the three pore sizes, d, considered in experiments (300 µm, yellow; 150 µm, purple; 75 µm, blue) and magnified views of the initial velocity field and shear rate field before biofilm growth obtained from a mathematical model at fluid flow rate, Q = 1 mL/h. The porosity of all models is 0.77. (B) Time course of mean PFP width, w, for different pore sizes, d (color-coding as in A), for a fluid flow rate of Q = 1 mL/h. Shading indicates the SD of w computed over the length of the PFPs. (C) Phase diagram for PFP intermittency in experiments as a function of pore size and fluid flow rate.
Fig. 5.
Fig. 5.
Bioclogging of porous media and PFP closing speeds depend on the nutrient mass flow, while the frequency of PFP opening depends on the average shear rate within PFPs. (A) Mean pore-clogging speed, vmc, depends on the pore size, d, and the fluid flow rate, Q. Data points (black) represent the mean of experimental replicates (SI Appendix, Table S1), and error bars represent the SD. The plane was fitted by linear interpolation and colored according to values of vmc. Stars indicate conditions in which PFP intermittency was observed. (B) The relationship between nutrient mass flow per pore, M, and the mean pore-clogging speed, vmc, follows a Monod kinetic (dashed line). Mean values of vmc for each nutrient mass flow rate are shown as black circles with their corresponding SD. Values of vmc are also shown for each experimental combination of fluid flow rate (symbols: circle, 0.2 mL/h; square, 0.5 mL/h; upward-pointing triangle, 1 mL/h; downward-pointing triangle, 2 mL/h) and pore size (colors: yellow, 300 µm; purple, 150 µm; blue, 75 µm). The fitted parameters for the Monod kinetic equation (Eq. 1) are vmc,max = 84.13 µm/h and KNQ = 0.086. (C) The relationship between the relative nutrient mass flow rate, MPFP, and the mean PFP closing speed, vpcs, follows a Monod kinetic (solid line) with fitted parameters of the Monod equation vpcs,max = 7.75 µm/h and KNQ = 0.178. For this analysis, the nutrient mass flow rate in the PFPs, MPFP, was assumed proportional to the imposed fluid flow rate. Circles represent the mean for each nutrient mass flow rate, and bars represent the SD. Other symbols show the values for individual experimental combinations of fluid flow rate and pore size, with symbols and colors as in B. (D) The frequency of opening, F, of the PFPs increases with the shear rate, γ˙w. Shear rate within the PFPs was estimated from the flow rate and mean PFP dimensions (Results). Data are shown for each combination of fluid flow rate and pore size (symbols and colors as in B). Only data from experiments with more than one opening event were used to determine the frequencies.

Similar articles

Cited by

References

    1. Cunningham A. B., Sharp R. R., Hiebert R., James G., Subsurface biofilm barriers for the containment and remediation of contaminated groundwater. Bioremediat. J. 7, 151–164 (2003).
    1. Stewart T. L., Scott Fogler H., Pore-scale investigation of biomass plug development and propagation in porous media. Biotechnol. Bioeng. 77, 577–588 (2002). - PubMed
    1. Baveye P., Vandevivere P., Hoyle B. L., DeLeo P. C., Sanchez De Lozada D., Environmental impact and mechanisms of the biological clogging of saturated soils and aquifer materials. Crit. Rev. Environ. Sci. Technol. 28, 123–191 (1998).
    1. Mitchell J. K., Santamarina J. C., Biological considerations in geotechnical engineering. J. Geotech. Geoenviron. Eng. 131, 1222–1233 (2005).
    1. Davey M. E., O’toole G. A., Microbial biofilms: From ecology to molecular genetics. Microbiol. Mol. Biol. Rev. 64, 847–867 (2000). - PMC - PubMed

Publication types

LinkOut - more resources