. 2022 Jul 26;119(30):e2114094119.
doi: 10.1073/pnas.2114094119. Epub 2022 Jul 19.

Pain hypersensitivity in a pharmacological mouse model of attention-deficit/hyperactivity disorder

Affiliations

Pain hypersensitivity in a pharmacological mouse model of attention-deficit/hyperactivity disorder

Otmane Bouchatta et al. Proc Natl Acad Sci U S A. .

Abstract

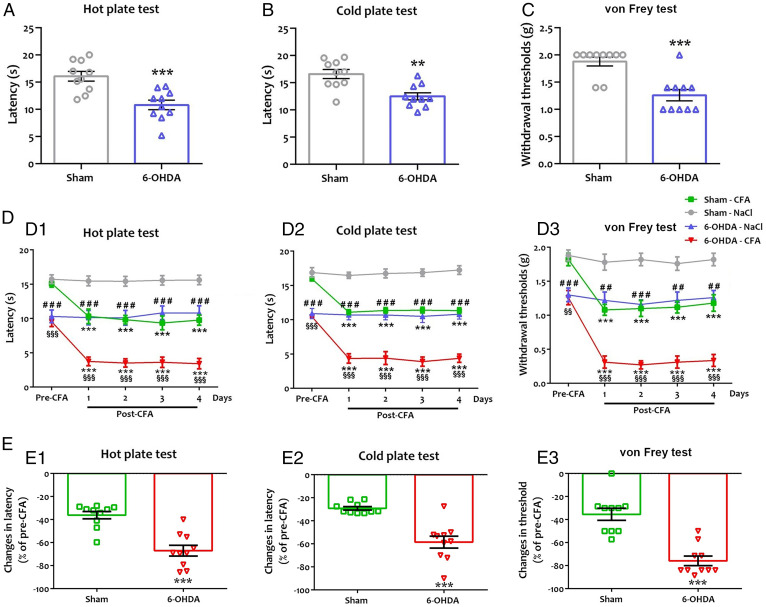
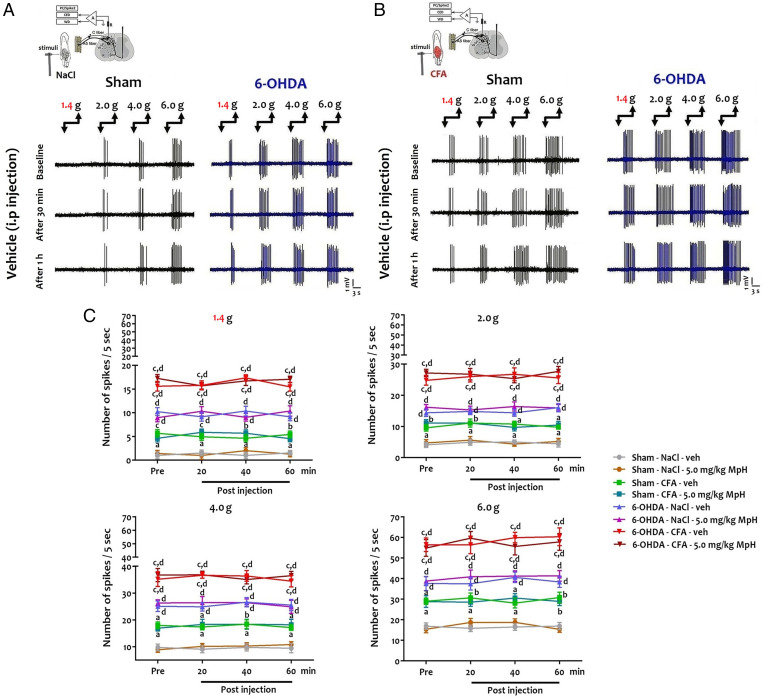
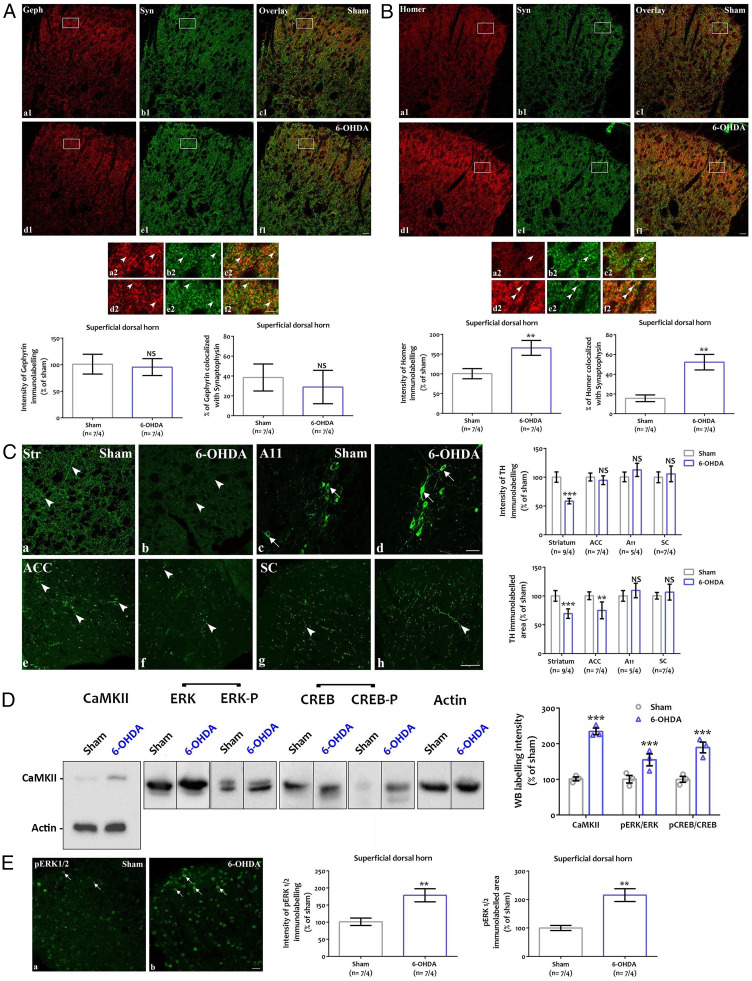
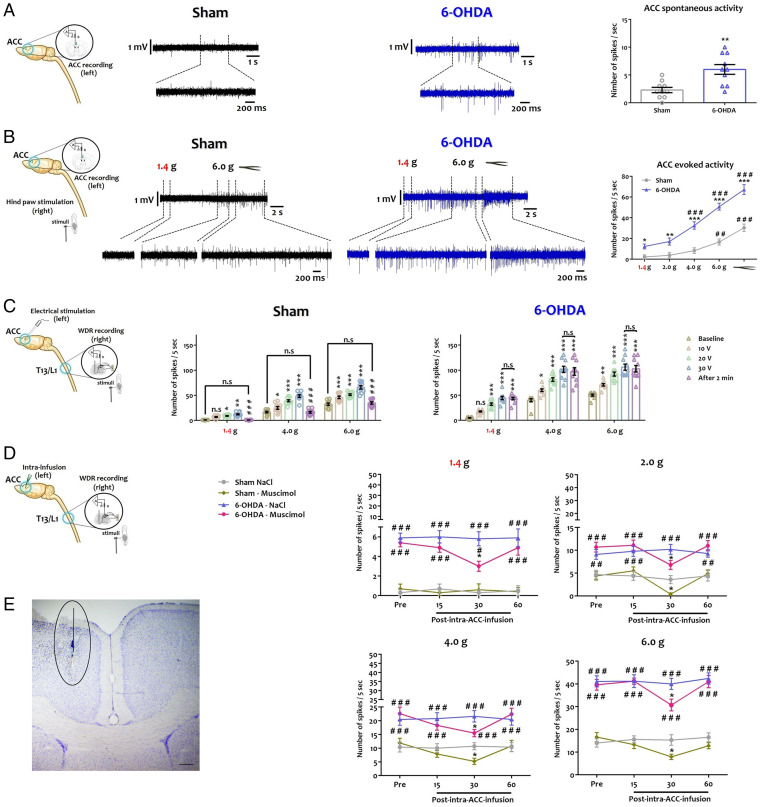
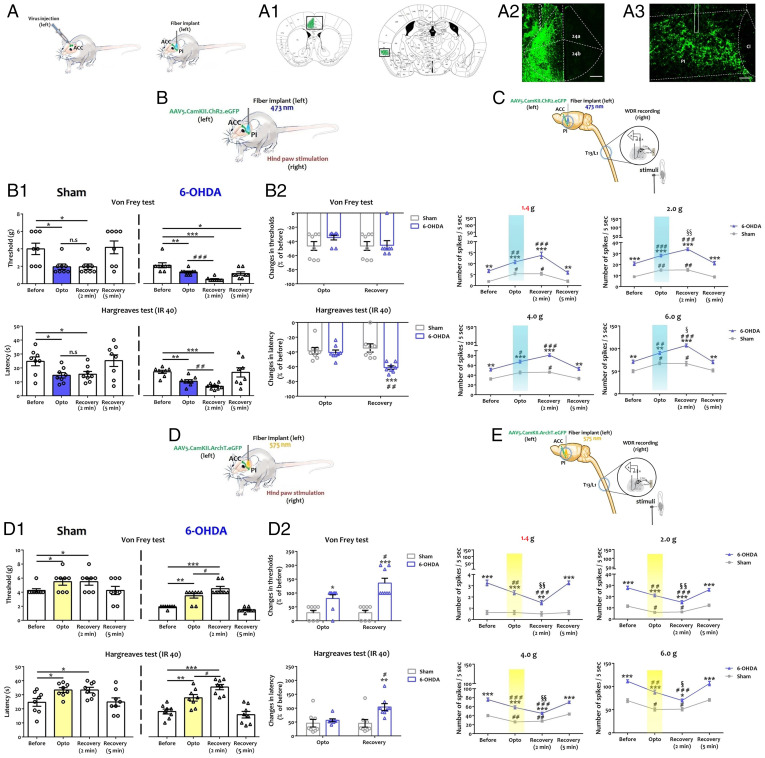
Clinical evidence suggests that pain hypersensitivity develops in patients with attention-deficit/hyperactivity disorder (ADHD). However, the mechanisms and neural circuits involved in these interactions remain unknown because of the paucity of studies in animal models. We previously validated a mouse model of ADHD obtained by neonatal 6-hydroxydopamine (6-OHDA) injection. Here, we have demonstrated that 6-OHDA mice exhibit a marked sensitization to thermal and mechanical stimuli, suggesting that phenotypes associated with ADHD include increased nociception. Moreover, sensitization to pathological inflammatory stimulus is amplified in 6-OHDA mice as compared to shams. In this ADHD model, spinal dorsal horn neuron hyperexcitability was observed. Furthermore, ADHD-related hyperactivity and anxiety, but not inattention and impulsivity, are worsened in persistent inflammatory conditions. By combining in vivo electrophysiology, optogenetics, and behavioral analyses, we demonstrated that anterior cingulate cortex (ACC) hyperactivity alters the ACC-posterior insula circuit and triggers changes in spinal networks that underlie nociceptive sensitization. Altogether, our results point to shared mechanisms underlying the comorbidity between ADHD and nociceptive sensitization. This interaction reinforces nociceptive sensitization and hyperactivity, suggesting that overlapping ACC circuits may be targeted to develop better treatments.

Keywords: anterior cingulate cortex; attention-deficit/hyperactivity disorder; comorbidity; pain sensitization; spinal cord.


Conflict of interest statement

The authors declare no competing interest.

Figures

Fig. 1.
Fig. 1.
Hypersensitivity to hot (A), cold (B) and mechanical (C) nociceptive stimuli in ADHD-like conditions, and after CFA injection (D, E). (A, D1, and E1) Paw-licking latency in hot plate (55 °C). (B, D2, and E2) Paw-licking latency in cold plate (5 °C). (C, D3, and E3) Paw withdrawal thresholds using von Frey filaments. (AC) A significant decrease was found in paw-licking latency of 6-OHDA mice to hot (A, 10.81 ± 0.89 s vs. 16.07 ± 0.90 s; t = 4.16, P = 0.0006) and cold (B, 12.51 ± 0.66 s vs. 16.60 ± 0.83 s; t = 3.87, P = 0.002) stimuli and in paw withdrawal from mechanical stimulus (C, 1.26 ± 0.10 g vs. 1.88 ± 0.08 g; t = 4.74, P = 0.0002), in comparison to sham mice. All data are means ± SEM (10 mice per group), **P < 0.01; ***P < 0.001 vs. sham. (D1D3) We evaluated ADHD-induced sensitization under inflammatory conditions. After the pretest (1 d before CFA injection; pre-CFA), CFA or saline was injected in the sole of the right hind paw. The posttest (post-CFA) was done 4 d after CFA injection. A 2-way repeated-measures ANOVA showed a significant effect of the lesion (6-OHDA) ([heat]: F(3,27) = 98.48, P = 0.0001; [cold]: F(3,27) = 257.0, P = 0.0001; [von Frey]: F(3,27) = 243.4, P = 0.0001), inflammation (CFA) ([heat]: F(4,36) = 9.69; P = 0.0001; [cold]: F(4,36) = 14.64, P = 0.0001; [von Frey]: F(4,36) = 20.40, P = 0.0001), and interaction 6-OHDA × CFA ([heat]: F(12,108) = 3.62, P = 0.0001; [cold]: F(12,108) = 5.47, P = 0.0001; [von Frey]: F(12,108) = 3.60, P = 0.0002) on thermal and mechanical sensitivity. There was a significant decrease in licking latency to thermal stimuli in sham mice ([heat]: 9.77 ± 0.75 s vs. 15.11 ± 0.54 s; q = 6.87, P = 0.0001; [cold]: 11.33 ± 0.41 s vs. 15.95 ± 0.29 s; q = 7.72, P = 0.0001) and 6-OHDA mice ([heat]: 3.42 ± 0.75 s vs. 9.53 ± 0.72 s; q = 7.86, P = 0.0001; [cold]: 4.38 ± 0.59 s vs. 10.43 ± 0.13 s; q = 10.11, P = 0.0001) 4 d post-CFA in comparison to the pre-CFA. CFA injection also resulted in a lowering of the mechanical threshold in sham mice (1.18 ± 0.12 g vs. 1.82 ± 0.09 g; q = 6.12, P = 0.0001) and 6-OHDA mice (0.34 ± 0.09 g vs. 1.26 ± 0.10 g; q = 8.87, P = 0.0001) 4 d post-CFA in comparison to the pre-CFA. In contrast, intraplantar injection of NaCl in the hind paw had no effect on thermal sensitivity (sham: [heat]: 15.62 ± 0.70 s vs. 15.73 ± 0.63 s; q = 0.15, P > 0.05; [cold]: 17.24 ± 0.64 s vs. 16.89 ± 0.71 s; q = 0.59, P > 0.05; 6-OHDA: [heat]: 10.80 ± 1.05 s vs. 10.31 ± 0.93 s; q = 0.63, P > 0.05; [cold]: 10.81 ± 0.71 s vs. 10.90 ± 0.74 s; q = 0.16, P > 0.05) and mechanical sensitivity (sham: 1.82 ± 0.09 g vs. 1.88 ± 0.08 g; q = 0.57, P > 0.05; 6-OHDA: 1.26 ± 0.10 g vs. 1.30 ± 0.10 g; q = 0.38, P > 0.05) in both groups. All data are means ± SEM (10 mice per group), ***P < 0.001 vs. pre-CFA; ##P < 0.01; ###P < 0.001 vs. NaCl; §§P < 0.01; §§§P < 0.001 vs. sham CFA. (E1E3) Amplitude of changes in latency (E1, hot plate; E2, cold plate) or threshold (E3, von Frey). ADHD-like conditions increased CFA-induced sensitization in response to thermal ([heat]: −67.01 ± 4.60% vs. −36.20 ± 3.21%; t = 10.44, P = 0.0001; [cold]: −58.48 ± 5.22% vs. −29.12 ± 1.49%; t = 6.92, P = 0.0001) and mechanical (−75.86 ± 4.15% vs. −35.43 ± 5.32%; t = 12.19, P = 0.0001) stimuli. All data are mean percentage of pre-CFA ± SEM (10 mice per group), **P < 0.01; ***P < 0.001 vs. sham.
Fig. 2.
Fig. 2.
Hyperexcitability of deep DHNs in ADHD-like conditions. (A and B) Single-unit in vivo extracellular recordings of deep DHNs in response to peripheral mechanical stimulation (1.4–6.0 g von Frey filament) under control (NaCl) and inflammatory conditions (CFA). (C) Quantification of the number of action potentials (number of spikes/5 s) after peripheral mechanical stimulation. Two-way repeated-measures ANOVA showed a significant effect of the group ([1.4 g]: F(7,63) = 207.7, P = 0.0001; [2.0 g]: F(7,63) = 184.3, P = 0.0001; [4.0 g]: F(7,63) = 159.0, P = 0.0001; [6.0 g]: F(7,63) = 108.5, P = 0.0001) on DHN electrical discharges. In contrast, Mph treatment (5.0 mg/kg Mph) ([1.4 g]: F(3,27) = 0.13; P = 0.094; [2.0 g]: F(3,27) = 0.20, P = 0.90; [4.0 g]: F(3,27) = 0.21; P = 0.89; [6.0 g]: F(3,27) = 0.63, P = 0.60) and interaction group × Mph ([1.4 g]: F(21,189) = 0.85, P = 0.66; [2.0 g]: F(21,189) = 0.34, P = 0.99; [4.0 g]: F(21,189) = 0.20, P = 0.99; [6.0 g]: F(21,189) = 0.29, P = 0.099) had no effect. There was a significant increase in the discharge of 6-OHDA mouse DHNs in response to innocuous ([1.4 g]: 10.25 ± 0.83 vs. 1.0 ± 0.73; q = 12.73, P = 0.0001) and noxious stimuli ([6.0 g]: 37.63 ± 3.42 vs. 16.88 ± 1.57; q = 7.77, P = 0.0001) in comparison to sham mice. In inflammatory conditions, there was a significant increase of DHN activity in response to innocuous ([1.4 g]: 5.67 ± 0.79 vs. 1.00 ± 0.73; q = 6.43, P = 0.001) and noxious stimuli ([6.0 g]: 29.02 ± 1.56 vs. 16.88 ± 1.57; q = 4.54, P < 0.05) in sham mice as compared to their controls (NaCl-injected sham mice). In contrast, CFA injection caused a further increase of DHN activity in 6-OHDA mice in response to both innocuous ([1.4 g]: 15.60 ± 1.03 vs. 10.25 ± 0.83; q = 7.36, P = 0.0001) and noxious stimuli ([6.0 g]: 56.49 ± 3.30 vs. 37.63 ± 3.42; q = 7.06, P = 0.0001) as compared to their controls (NaCl-injected 6-OHDA mice). After recording the baseline electrical activity of DHNs, Mph or vehicle (veh; 0.9% NaCl) was injected intraperitoneally and the single-unit extracellular recording was done every 20 min postinjection for 1 h. There was no significant effect of ADHD medication on electrical DHN activity in both the sham and 6-OHDA groups in response to peripheral innocuous and noxious mechanical stimulation under control (sham: [1.4 g]: 1.41 ± 0.65 vs. 1.28 ± 0.57; q = 0.18, P > 0.05; [6.0 g]: 15.42 ± 1.77 vs. 15.37 ± 1.49; q = 0.02, P > 0.05; 6-OHDA: [1.4 g]: 8.96 ± 0.87 vs. 10.38 ± 1.07; q = 1.95, P > 0.05; [6.0 g]: 38.84 ± 2.07 vs. 41.33 ± 2.55; q = 0.93, P > 0.05) and inflammatory conditions (sham: [1.4 g]: 4.63 ± 0.76 vs. 4.55 ± 0.64; q = 0.11, P > 0.05; [6.0 g]: 28.86 ± 2.80 vs. 28.97 ± 2.07; q = 0.04, P > 0.05; 6-OHDA: [1.4 g]: 28.86 ± 2.81 vs. 28.97 ± 2.08; q = 0.26, P > 0.05; [6.0 g]: 54.90 ± 4.08 vs. 57.87 ± 4.07; q = 1.11, P > 0.05). In addition, vehicle injection had no effect on DHN discharge in response to peripheral innocuous and noxious mechanical stimulation under control and inflammatory conditions in both sham and 6-OHDA groups. All data are means ± SEM (10 neurons per group), aP < 0.05; bP < 0.01; cP < 0.001 vs. NaCl; dP < 0.001 vs. sham.
Fig. 3.
Fig. 3.
ADHD-like conditions modify dorsal spinal networks. (A and B) Expression of synaptic markers in the dorsal spinal cord. Coexpression of postsynaptic gephyrin (A, red; a1, d1, c1, f1) or homer 1 (B, red; a1, d1, c1, f1) and presynaptic synaptophysin (A and B, green; b1, c1, e1, f1) in the dorsal horn of sham and 6-OHDA mice. Frames in A, a1f1 and B, a1f1 are displayed at higher magnification in A, a2f2 and B, a2f2. Arrowheads point to close apposition between markers in A, a2f2 and B, a2f2. Quantification of postsynaptic immunolabeling intensity (Left) and colocalization with the presynaptic marker synaptophysin (Right) shown in A and B. Homer 1, but not gephyrin, is overexpressed at synaptic sites in 6-OHDA mice (n = 7 sections in 4 mice; t test, A: P > 0.05; B: intensity: **P < 0.01, P = 0.0056; colocalization: P = 0.0019) (Scale bar, 50 µm [a1f1], 20 µm [a2f2]). Geph: gephyrin, NS: nonsignificant, Syn: synaptophysin. (C) TH immunodetection of fibers (arrowheads) or cell bodies (arrows) in adult sham (a, c, e, g) and 6-OHDA (b, d, f, h) mice in the striatum (a, b), the A11 hypothalamic area (c, d), the ACC (e, f) and the spinal cord (g, h). The quantification shows that TH intensity is lowered in the striatum but not in the other areas, while the TH immunolabeled area is decreased in the striatum and ACC but is not affected in the A11 or the spinal cord (n = 9 [striatum], 7 [ACC and spinal cord], or 5 [A11] sections in 4 mice; t test, intensity in the striatum: P = 0.000028; area in the striatum: P < 0.00001; area in the ACC: P = 0.0048) (Scale bar, 50 µm). ACC: anterior cingulate cortex, NS: nonsignificant, SC: spinal cord, Str: striatum. **P < 0.01, ***P < 0.001. (D) Western blotting detection of CaMKIIα, and total and phosphorylated forms of activation-dependent intracellular kinases (ERK) and transcription factor (CREB). CaMKII, pERK, and pCREB are overexpressed in 6-OHDA mice (n = 4 mice; t test, ***P < 0.0001, CaMKIIα: P = 0.00086; pERK/ERK: P = 0.0063; pCREB/CREB: P = 0.00072). (E) Immunodetection of pERK (arrows) in the dorsal horn of sham (a) and 6-OHDA (b) mice. The quantification of pERK labeling intensity and area indicates ERK activation in 6-OHDA mice (n = 7 sections in 4 mice; t test, **P < 0.01, intensity: P = 0.0057, area: P = 0.0069) (Scale bar, 25 µm).
Fig. 4.
Fig. 4.
The ACC is a key brain area of descending regulatory dysfunction in ADHD-like conditions. (A) From left to right: Representative diagram of the in vivo recording procedure of ACC neuron spontaneous activity. Single-unit in vivo extracellular recording of spontaneous activity of ACC neuron. Quantification of the number of action potential measured per second (see SI Appendix). **P < 0.01 vs. sham. (B) From left to right: Representative diagram of the in vivo recording procedure of ACC neuron evoked activity. Single-unit extracellular recording of evoked activity recording of ACC neuron. Quantification of the number of action potential measured per 5 s upon peripheral mechanical stimulus of the hind paw, contralateral to the recorded ACC (von Frey filament: 1.4 g, 2.0 g, 4.0 g, 6.0 g, and pressure) (see SI Appendix). *P < 0.05; **P < 0.01; ***P < 0.001 vs. sham; ##P < 0.01; ###P < 0.001 vs. 1.4 g. (C) From left to right: Representative diagram of contralateral DHN neuron recording upon ACC electrical stimulation in response to different peripheral mechanical stimuli. Quantification of the number of action potentials per 5 s upon peripheral stimulus (von Frey filament: 1.4 g, 2.0 g, 4.0 g, 6.0 g) at different ACC electrical stimulation intensities (100 Hz: 10 V, 20 V, 30 V), and after 2 min of recovery (see SI Appendix). *P < 0.05 vs. preinfusion; ###P < 0.001 vs. sham. T13: thoracic vertebrae 13, L1: lumbar vertebrae 1. (D) From left to right: Representative diagram of contralateral DHN neuron recording upon ACC inhibition in responses to different peripheral mechanical stimuli. Quantification of the number of action potentials per 5 s upon peripheral stimulus (von Frey filament: 1.4 g, 2.0 g, 4.0 g, 6.0 g), every 15 min before and 1 h after muscimol infusion in the ACC (see SI Appendix). *P < 0.05 vs Pre-infusion; #P < 0.05, ##P < 0.01, ###P < 0.001 vs Sham T13: thoracic vertebrae 13, L1: lumbar vertebrae 1. (E) Histological verification of the infusion site in the ACC. All data are means ± SEM (10 neurons per group).
Fig. 5.
Fig. 5.
Optogenetic modulation of the ACC–PI excitatory pathway potentiates sensitization of the contralateral paw in 6-OHDA mice. (A) Representative diagram of viral injection site in the left ACC (Left) and optic cannula placement (Right) in the left PI. (A1) Atlas representation of the ACC–PI pathway targeted in this study [Images modified from Paxinos and Franklin, 2001, with permission (42)]. (A2 and A3) Examples of viral expression of ChR2-transduced ACC excitatory neurons (A2) projecting to the PI (A3). (Scale bar: ACC, 1 mm; PI, 200 μm.) (B) Activation of the left ACC–PI pathway in mice injected with AAV5.CaMKII.ChR2.eGFP and behavioral assessment on the contralateral (right) hind paw. (B1) von Frey and Hargreaves (infra-red radiant heat [40] 40) tests before (Before), during (Opto), and at 2 and 5 min after (Recovery) illumination (see SI Appendix). *P < 0.05; **P < 0.01; ***P < 0.001 vs. Before; ##P < 0.01; ###P < 0.001 vs. Opto. (B2) Amplitude of changes in withdrawal threshold and latency between Before and Opto or Recovery (2 min) conditions (% of values before illumination) (see SI Appendix). ***P < 0.001 vs. sham; ##P < 0.01; vs. Opto. Circles: individual values for sham; triangles: individual values for 6-OHDA. (C) Activation of the left ACC–PI pathway of mice injected with AAV5.CaMKII.ChR2.eGFP and contralateral (right) DHN recording. Quantification of action potentials per 5 s upon peripheral stimulus before, during, and at 2 or 5 min after illumination (see SI Appendix). **P < 0.01; ***P < 0.001 vs. sham; #P < 0.05; ##P < 0.01; ###P < 0.001 vs. Before; §P < 0.05 vs. Opto. (D) Silencing of the left ACC–PI pathway in mice injected with AAV5.CaMKII.ArchT.eGFP and behavioral assessment on the contralateral (right) hind paw. (D1) von Frey and Hargreaves tests before (Before), during (Opto), and at 2 or 5 min after (Recovery) illumination (see SI Appendix). *P < 0.05; **P < 0.01; ***P < 0.001 vs. Before; #P < 0.05 vs. Opto. (D2) Amplitude of changes in withdrawal threshold and latency between Before and Opto or Recovery (2 min) conditions (% of values before illumination) (see SI Appendix). *P < 0.05; **P < 0.01; ***P < 0.001 vs. sham; #P < 0.05 vs. Opto. Circles: individual values for sham; triangles: individual values for 6-OHDA. (E) Silencing of the left ACC–PI pathway in mice injected with AAV5.CaMKII.ArchT.eGFP and contralateral (right) DHN recording. Quantification of action potentials per 5 s upon peripheral stimulus before, during, and at 2 or 5 min after illumination (see SI Appendix). *P < 0.05; ***P < 0.001 vs. sham; #P < 0.05; ##P < 0.01; ###P < 0.001 vs. Before; §P < 0.05; §§P < 0.01 vs. Opto. All data are means ± SEM (8 neurons per group).

Similar articles

Cited by

References

    1. Biederman J., Attention-deficit/hyperactivity disorder: A selective overview. Biol. Psychiatry 57, 1215–1220 (2005). - PubMed
    1. Faraone S. V., Sergeant J., Gillberg C., Biederman J., The worldwide prevalence of ADHD: Is it an American condition? World Psychiatry 2, 104–113 (2003). - PMC - PubMed
    1. American Psychiatric Association, Diagnostic and Statistical Manual of Mental Disorders (American Psychiatric Association, Washington, DC, ed. 5, 2013).
    1. Kooij J. J., et al. , Distinguishing comorbidity and successful management of adult ADHD. J. Atten. Disord. 16, 3S–19S (2012). - PubMed
    1. Schatz D. B., Rostain A. L., ADHD with comorbid anxiety: A review of the current literature. J. Atten. Disord. 10, 141–149 (2006). - PubMed

Publication types