. 2022 Jul 26;119(30):e2203659119.
doi: 10.1073/pnas.2203659119. Epub 2022 Jul 12.

Transient and durable T cell reactivity after COVID-19

Affiliations

Transient and durable T cell reactivity after COVID-19

Anna Martner et al. Proc Natl Acad Sci U S A. .

Abstract

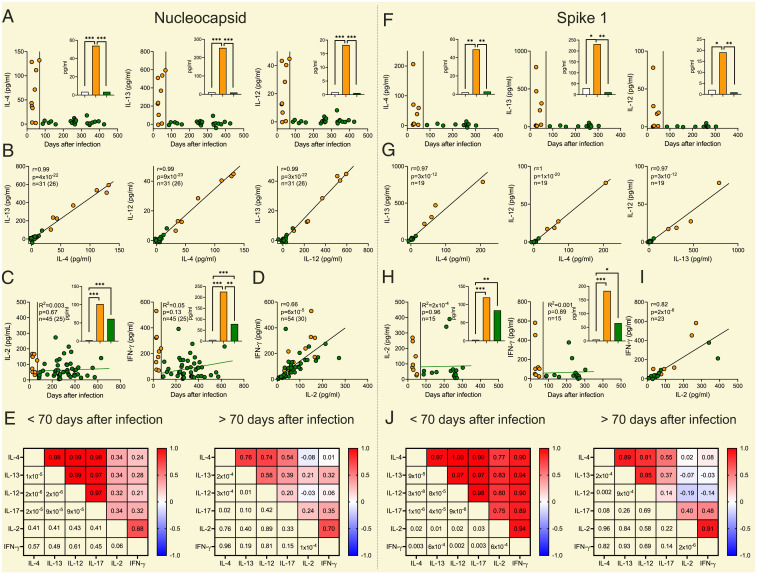
This study analyzed whole blood samples (n = 56) retrieved from 30 patients at 1 to 21 (median 9) mo after verified COVID-19 to determine the polarity and duration of antigen-specific T cell reactivity against severe acute respiratory syndrome coronavirus 2-derived antigens. Multimeric peptides spanning the entire nucleocapsid protein triggered strikingly synchronous formation of interleukin (IL)-4, IL-12, IL-13, and IL-17 ex vivo until ∼70 d after confirmed infection, whereafter this reactivity was no longer inducible. In contrast, levels of nucleocapsid-induced IL-2 and interferon-γ remained stable and highly correlated at 3 to 21 mo after infection. Similar cytokine dynamics were observed in unvaccinated, convalescent patients using whole-blood samples stimulated with peptides spanning the N-terminal portion of the spike 1 protein. These results unravel two phases of T cell reactivity following natural COVID-19: an early, synchronous response indicating transient presence of multipolar, antigen-specific T helper (TH) cells followed by an equally synchronous and durable TH1-like reactivity reflecting long-lasting T cell memory.

Keywords: COVID-19; SARS-CoV-2; T cell cytokines; T helper cells; longevity.


Conflict of interest statement

The authors declare no competing interest.

Figures

Fig. 1.
Fig. 1.
Two phases of antigen-specific T cell reactivity to SARS-CoV-2–derived peptides after COVID-19. The left (Nucleocapsid) and the right (Spike 1) panels show NC and S1 peptide-induced formation of (A and F) IL-4, IL-12, and IL-13 and (C and H) IL-2 and IFN-γ in whole-blood samples from patients with previously confirmed COVID-19 vs. day after infection. The inset bars show mean levels of induced formation of each cytokine in uninfected controls (n = 24 samples from 17 subjects for NC and n = 11 for S1, white bars) and convalescent patients sampled early (n = 9 samples from 8 subjects for NC and n = 8 for S1, orange bars) or late (n = 22 samples from 19 subjects [A], n = 45 samples from 25 subjects [C] for NC and n = 11 [F] and n = 15 [H] for S1, green bars) after infection. All data points are shown in each graph. For each donor a mean of all samples within each phase was used for statistical analysis as calculated by permutation. In C and H the green regression lines show NC- and S1-induced cytokines in the late convalescent phase and were estimated using linear mixed-effects models. B, D, G, and I are scatter plots of NC- and S1 peptide-induced formation of (B and G) IL-4, IL-12, and IL-13 and (D and I) IL-2 and IFN-γ in patients with previous COVID-19. The number of observations is indicated by n with the unique number of donors in brackets if serial samples from the same subject were available. All data points are shown in each graph and the regression line was estimated by linear mixed-effects models. A mean of all samples within the early (<70 d after infection) or the late (>70 d after infection) phase from each donor was used to estimate Pearson correlation for unique donors. E and J are a heat maps showing the correlation (Pearson r, above the diagonal) between NC- and S1-induced formation of cytokines in the early (Left) and late (Right) phase after confirmed COVID-19. P values corresponding to each correlation are shown below the diagonal. For each donor a mean of all samples within each phase was used for statistical estimation of correlation. Orange dots show results at early (<70 d) and green dots at later (>70 d) convalescence after infection. *P < 0.05, **P < 0.01, ***P < 0.001.

References

    1. Tuzlak S., et al. , Repositioning TH cell polarization from single cytokines to complex help. Nat. Immunol. 22, 1210–1217 (2021). - PubMed
    1. Lee J., et al. , The multifaceted role of Th1, Th9, and Th17 cells in immune checkpoint inhibition therapy. Front. Immunol. 12, 625667 (2021). - PMC - PubMed
    1. Bosurgi L., et al. , Macrophage function in tissue repair and remodeling requires IL-4 or IL-13 with apoptotic cells. Science 356, 1072–1076 (2017). - PMC - PubMed
    1. Walker J. A., McKenzie A. N. J., TH2 cell development and function. Nat. Rev. Immunol. 18, 121–133 (2018). - PubMed
    1. Weaver C. T., Elson C. O., Fouser L. A., Kolls J. K., The Th17 pathway and inflammatory diseases of the intestines, lungs, and skin. Annu. Rev. Pathol. 8, 477–512 (2013). - PMC - PubMed

Publication types