. 2022 Jul 19;40(3):111075.
doi: 10.1016/j.celrep.2022.111075.

Light regulates xylem cell differentiation via PIF in Arabidopsis

Affiliations

Light regulates xylem cell differentiation via PIF in Arabidopsis

Shraboni Ghosh et al. Cell Rep. .

Abstract

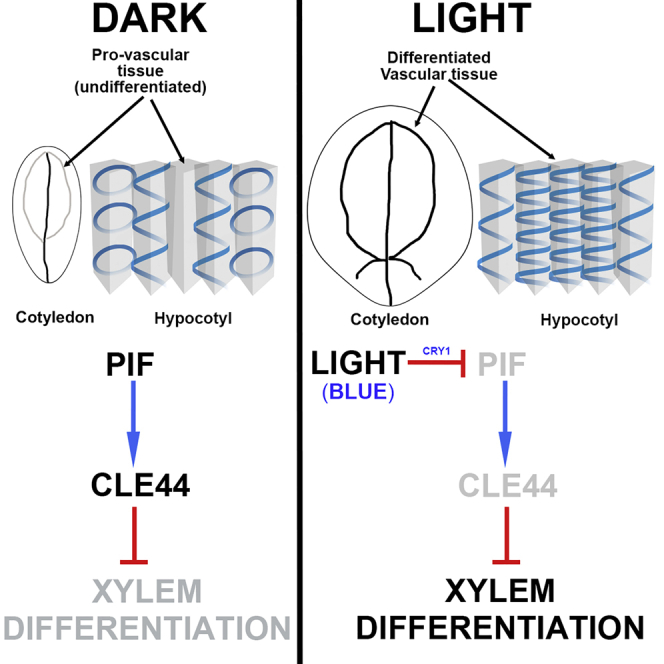
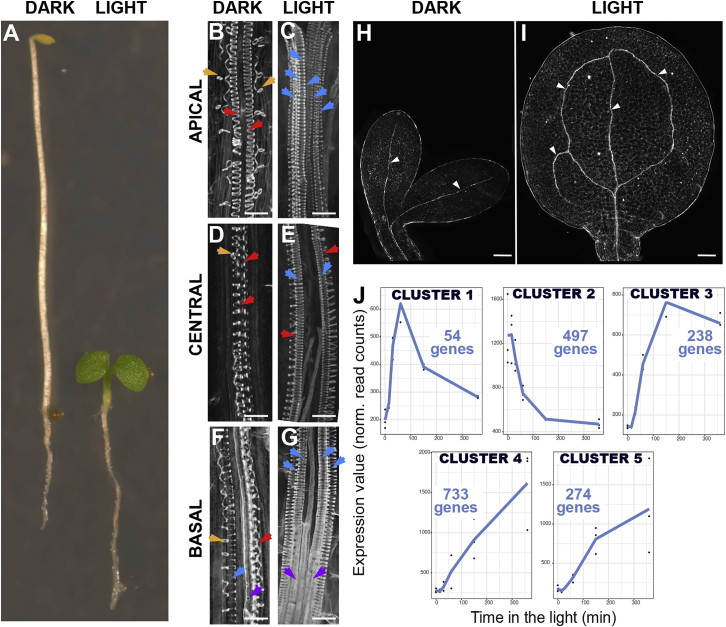
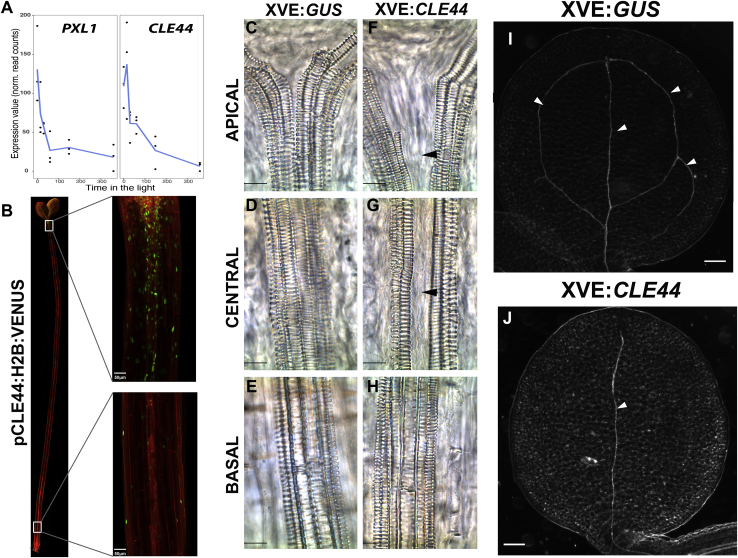
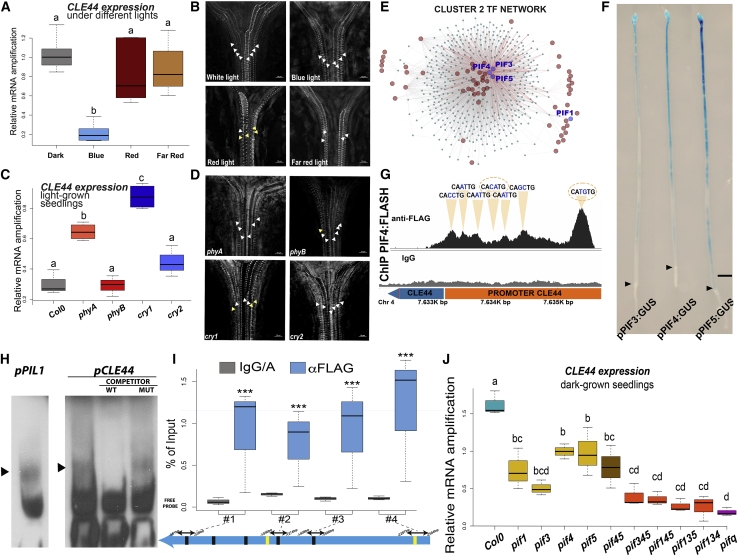
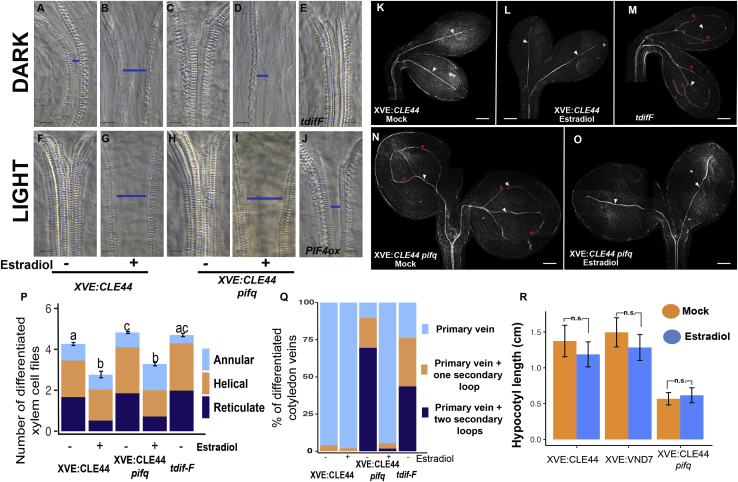
The balance between cell proliferation and differentiation in the cambium defines the formation of plant vascular tissues. As cambium cells proliferate, subsets of daughter cells differentiate into xylem or phloem. TDIF-PXY/TDR signaling is central to this process. TDIF, encoded by CLE41 and CLE44, activates PXY/TDR receptors to maintain proliferative cambium. Light and water are necessary for photosynthesis; thus, vascular differentiation must occur upon light perception to facilitate the transport of water and minerals to the photosynthetic tissues. However, the molecular mechanism controlling vascular differentiation in response to light remains elusive. In this study we show that the accumulation of PIF transcription factors in the dark promotes TDIF signaling and inhibits vascular cell differentiation. On the contrary, PIF inactivation by light leads to a decay in TDIF activity, which induces vascular cell differentiation. Our study connects light to vascular differentiation and highlights the importance of this crosstalk to fine-tune water transport.

Keywords: Arabidopsis; CP; PIF; Plants; cell differentiation; light signaling; photomorphogenesis; plant development; signaling transduction; transcriptional regulation; vascular development; xylem.


Conflict of interest statement

Declaration of interests The authors declare no competing interests.

Figures

None
Graphical abstract
Figure 1
Figure 1
Light induces vasculature differentiation (A) Five-day-old seedlings grown in the dark (left) and light (right). (B–G) SCW deposition arrangements observed in hypocotyls of 5-day-old seedlings grown in the dark (B, D, and F) or light (C, E, and G). (B and C) Apical, (D and E) central, and (F and G) basal regions. Arrows highlight SCW arrangements; annular (orange), helical (red), reticulate (blue), pitted (purple). Scale bars: 10 μm. (H and I) Differences in cotyledon vein differentiation (white arrowheads) between 5-day-old dark- (H) and light-grown (I) cotyledons. Scale bars: 100 μm. (J) Genes clustered by transcriptional behavior during seedling deetiolation represented as average value. Data are representative of three independent experiments per time point. See also Data S1.
Figure 2
Figure 2
Light repression of CLE44 induces vascular differentiation (A) Transcriptional behavior of PXL1 and CLE44 during deetiolation. Data are representative of three independent experiments per time point. See also Data S1. (B) Confocal analysis of the pCLE44:H2B:VENUS transcriptional reporter in dark-grown seedlings. Image insets show the difference in CLE44 expression between the apical and basal regions of the hypocotyl. Scale bars: 50 μm. (C–H) Differences in xylem cell differentiation along the length of the hypocotyl between GUS- (C, D, and E) and CLE44- (F, G, and H) overexpressing seedlings grown in the light for 5 days. Scale bars: 10 μm. (I and J) Differences in cotyledon vein differentiation (white arrowheads) between 5-day-old GUS (I) and CLE44 (J) overexpressing seedlings grown in the light for 5 days. Scale bars: 100μm.
Figure 3
Figure 3
CLE44 expression is regulated by PIFs (A) CLE44 expression levels after 6 h of BL, RL, and FRL exposure. Data are representative of three independent experiments and three technical replicates per pair of primers. Values represent mean of expression ± SD. Letters indicate ANOVA + Tukey’s honest significant difference (HSD) pairwise comparison test (p < 0.05). (B) Orthogonal projections of confocal z stacks representative of hypocotyl xylem cell differentiation of seedling grown under WL (top left), BL (top right), RL (bottom left), and FRL (bottom right). Arrows highlight SCW arrangements; helical (yellow), reticulate (white). Scale bars: 10 μm. (C) CLE44 expression levels in photoreceptor mutants grown under continuous WL. Data are representative of three independent experiments and three technical replicates per pair of primers. Values represent mean of expression ± SD. Letters indicate ANOVA + Tukey’s HSD pairwise comparison test (p < 0.05). (D) Orthogonal projections of confocal z stacks representative of hypocotyl xylem cell differentiation in phyA (top left), phyB (top right), cry1 (bottom left), and cry2 (bottom right) mutants grown under continuous WL. Arrows highlight SCW arrangements; helical (yellow), reticulate (white). Scale bars: 10 μm. (E) Hierarchical representation of the TF network for the genes in cluster 2. Labeled nodes represent the significant TFs identified by the TF2Network software. PIF TFs are indicated. (F) Expression analysis of PIF3, PIF4, and PIF5 transcriptional GUS reporter lines. (G) PIF4-FLAG binding regions over CLE44 promoter identified via ChIP-seq. Immunoglobulin G (IgG) indicates the negative control. Orange triangles highlight the location of EBOX elements, dashed ellipses indicate PBE-BOX elements. (H) Electrophoretic mobility shift assay (EMSA) showing interaction between PIF4 and the G-box elements of pPIL1 (used as control), and the first PBE-BOX found on the CLE44 promoter. WT = unlabelled WT probe, MUT = unlabelled mutated probe. (I) Direct binding of PIF4 to the promoter of CLE44 by ChIP-qPCR assays. Values obtained from three independent biological replicates and three technical replicates per pair of primers, were normalized to the input and compared against the IgG/A sample. Values represented as percentage of input ± SD. Comparisons between IgG/A and α-FLAG samples were made using Student’s t test (p < 0.05, ∗∗p < 0.01, ∗∗∗p < 0.001, ns, not significant). (J) CLE44 expression levels in PIF mutants. Blue, WT; yellow, single; brown, double; orange, triple; purple, quadruple mutants grown in the dark. Data are representative of three independent experiments and three technical replicates per pair of primers. Values represent mean of expression ± SD. Letters indicate ANOVA + Tukey’s HSD pairwise comparison test (p < 0.05).
Figure 4
Figure 4
CLE44 overexpression prevents xylem differentiation in WT and pifq mutants (A–J) Differences in xylem cell differentiation in 5-day-old dark- (A–E) and light-grown (F–J) hypocotyls where CLE44 and PIF expression is perturbed. Blue bars indicate undifferentiated provascular cells. Scale bars: 10 μm. (A and B) XVE:CLE44 grown in the dark. (A) Mock and (B) estradiol treated. (C and D) XVE:CLE44 in pifq background grown in the dark. (C) Mock and (D) estradiol treated. (E) tdifF mutant grown in the dark. (F and G) XVE:CLE44 grown in the light. (A) Mock and (B) estradiol treated. (H and I) XVE:CLE44 in pifq background in the light. (J) 35S:PIF4:FLAG grown in the light. (K–O) Differences in cotyledon vein differentiation (white arrowheads) of dark-grown seedlings where CLE44 and PIF expression is perturbed. White arrowheads, differentiated primary vein; red, differentiated secondary vein. Scale bars: 100 μm. (K and L) XVE:CLE44. (K) Mock and (L) 17β-estradiol treated. (M) tdifF mutant. (N and O) XVE:CLE44 in pifq background. (N) Mock and (O) 17β-estradiol treated. (P) Differences in hypocotyl xylem differentiation between XVE:CLE44; XVE:CLE44 in pifq and tdifF mutants grown in the dark and in the presence of mock and 17β-estradiol. Values (n > 25) represent mean of differentiated cells ± SE. Letters represent ANOVA + Tukey’s HSD statistical test for total number of differentiated cells. Data S5 contains details of the sample size, mean, SE values, and ANOVA + Tukey’s HSD comparisons. (Q) Differences (as percentage) in cotyledon vein differentiation between XVE:CLE44 and XVE:CLE44 in pifq and tdifF mutants grown in the dark and in the presence of mock and 17β-estradiol (n > 50). Data S5 contains details of the sample size and percentages. (R) Differences in hypocotyl length between XVE:CLE44 and XVE:CLE44 in pifq and XVE:VND7 dark-grown seedlings in the presence of mock and 17β-estradiol. Values (n > 20) represent mean of hypocotyl length ± SD. Data S5 contains details of the sample size, mean, and SD values. Comparisons between mock and 17β-estradiol treated samples were made using Student’s t test (p < 0.05, ∗∗p < 0.01, ∗∗∗p < 0.001, ns, not significant).

References

    1. Ahmad M., Cashmore A.R. HY4 gene of A. thaliana encodes a protein with characteristics of a blue-light photoreceptor. Nature. 1993;366:162–166. doi: 10.1038/366162a0. - DOI - PubMed
    1. Bray N.L., Pimentel H., Melsted P., Pachter L. Near-optimal probabilistic RNA-seq quantification. Nat. Biotechnol. 2016;34:525–527. doi: 10.1038/nbt.3519. - DOI - PubMed
    1. Buti S., Hayes S., Pierik R. The bHLH network underlying plant shade-avoidance. Physiol. Plant. 2020;169:312–324. doi: 10.1111/ppl.13074. - DOI - PMC - PubMed
    1. Clough S.J., Bent A.F. Floral dip: a simplified method forAgrobacterium-mediated transformation ofArabidopsis thaliana. Plant J. 1998;16:735–743. doi: 10.1046/j.1365-313x.1998.00343.x. - DOI - PubMed
    1. Conesa A., Nueda M.J., Ferrer A., Talón M. maSigPro: a method to identify significantly differential expression profiles in time-course microarray experiments. Bioinformatics. 2006;22:1096–1102. doi: 10.1093/bioinformatics/btl056. - DOI - PubMed

Publication types