. 2022 Jul 19;40(3):111130.
doi: 10.1016/j.celrep.2022.111130.

Sensory neurons display cell-type-specific vulnerability to loss of neuron-glia interactions

Affiliations

Sensory neurons display cell-type-specific vulnerability to loss of neuron-glia interactions

Benayahu Elbaz et al. Cell Rep. .

Abstract

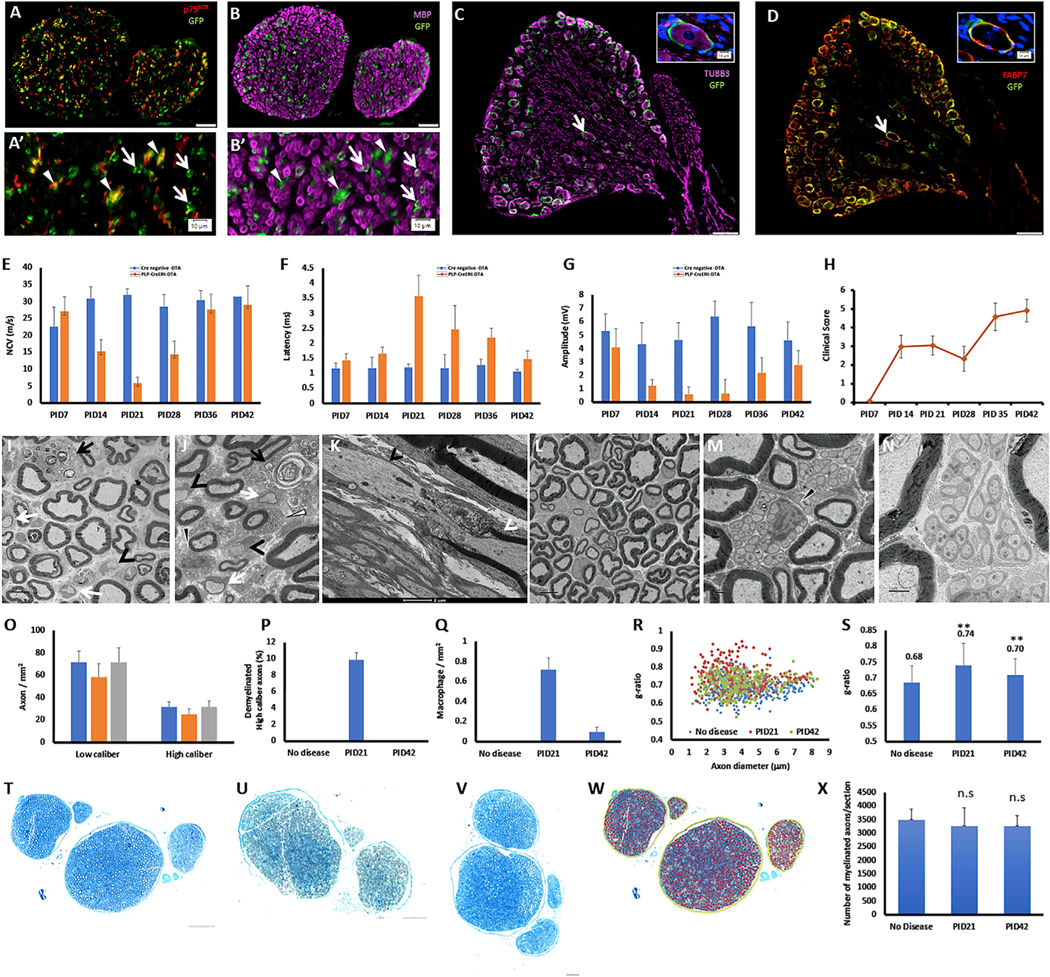
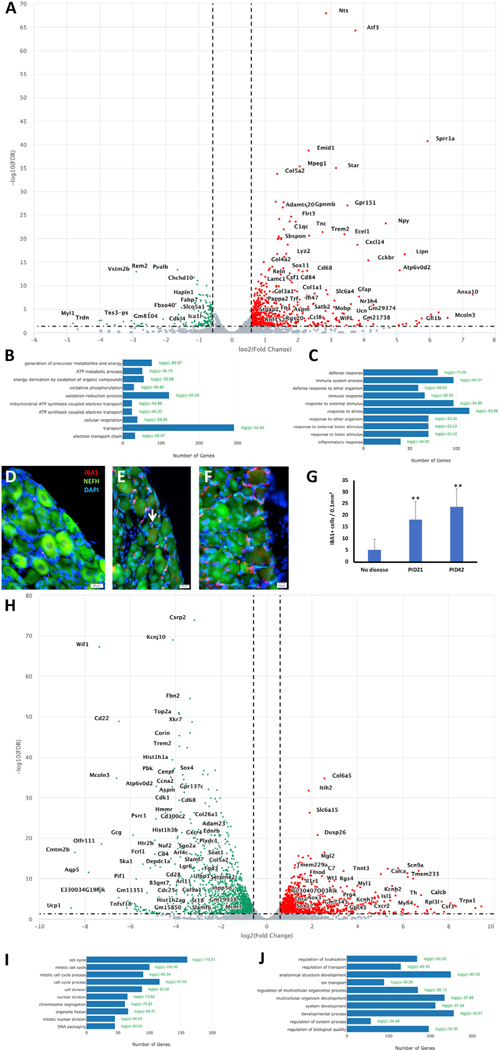
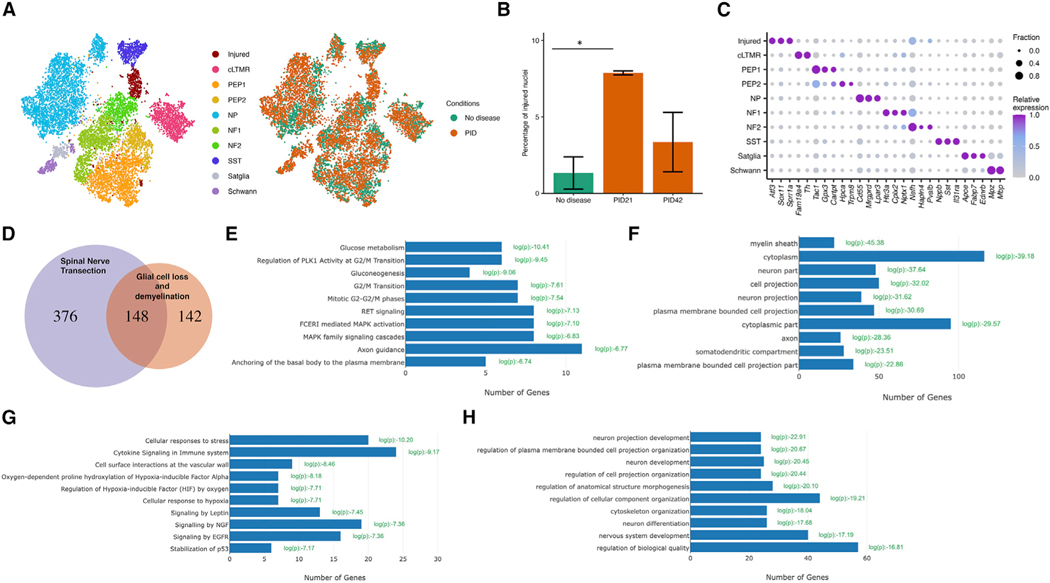
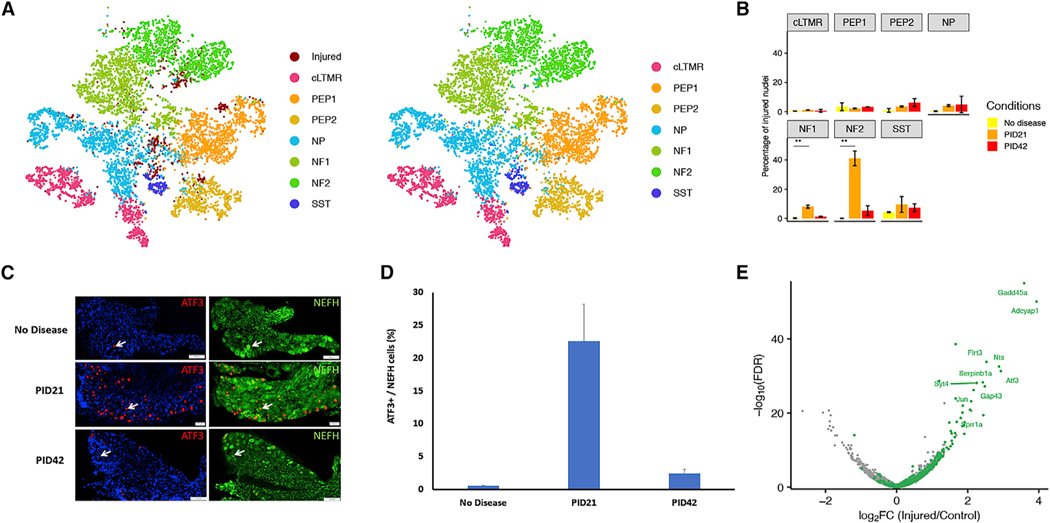
Peripheral nervous system (PNS) injuries initiate transcriptional changes in glial cells and sensory neurons that promote axonal regeneration. While the factors that initiate the transcriptional changes in glial cells are well characterized, the full range of stimuli that initiate the response of sensory neurons remain elusive. Here, using a genetic model of glial cell ablation, we find that glial cell loss results in transient PNS demyelination without overt axonal loss. By profiling sensory ganglia at single-cell resolution, we show that glial cell loss induces a transcriptional injury response preferentially in proprioceptive and Aβ RA-LTMR neurons. The transcriptional response of sensory neurons to mechanical injury has been assumed to be a cell-autonomous response. By identifying a similar response in non-injured, demyelinated neurons, our study suggests that this represents a non-cell-autonomous transcriptional response of sensory neurons to glial cell loss and demyelination.

Keywords: CP: Neuroscience.


Conflict of interest statement

Declaration of interests The authors declare no competing interests.

Figures

Figure 1.
Figure 1.. Glial cell ablation results in demyelination without axonal loss
Eight-week-old PLP-CreERT;ROSA26-EYFP mice were injected with tamoxifen, and the sciatic nerve and the L3-L5 DRGs were dissected. (A) In the sciatic nerve, the expression of EYFP was detected by anti-GFP antibody in non-myelinating Schwann cells, marked by p75NTR. (A′) Higher magnification; white triangles mark EYFP-positive cells that are positive for p75NTR, and white arrows mark EYFP-positive cells that are p75NTR negative (Scale bar, 50 μm, A’- scale bar, 10 μm). (B) In the sciatic nerve, the expression of EYFP was detected also in myelinating Schwann cells, marked by MBP. (B′) Higher magnification; white triangles mark EYFP-positive cells that are negative for MBP, and white arrows mark EYFP-positive cells that are MBP positive (Scale bar, 50 μm, B’- scale bar, 10 μm). (C) In the DRG, the expression of EYFP was not detected in sensory neurons, marked by TUBB3. White arrow marks the cell presented in higher magnification in the insertion (Scale bar, 100 μm, scale bar in the insertion 10 μm). (D) In the DRG, the expression of EYFP was detected in satellite glial cells, marked by the satellite glial cell marker FABP7 (Avraham et al., 2020). White arrow marks the cell presented in higher magnification in the insertion (Scale bar, 100 μm, scale bar in the insertion 10 μm). (E-G) Eight-week-old PLP-CreERT;ROSA26-eGFP-DTA mice and Cre-negative ROSA26-eGFP-DTA mice (used as control) were injected with tamoxifen and the sciatic nerve were subjected to electrophysiological examination at days 7–42 post tamoxifen injection (PID). (E) Nerve conduction velocity. (F) Distal latency. (G) Distal amplitude Values represent mean ± SEM. (H) Clinical scores of the demyelinated mice. Clinical scores were based on a scoring system developed for phenotypic characterization of demyelination in this line (Traka, 2019; Traka et al., 2010, 2016). Values represent mean ± SEM. (I-K) EM of the sciatic nerve at PID21: demyelinated large-caliber axons (black arrowheads), remyelinated large-caliber axons (white arrows), phagocytic macrophages (black arrows), apoptotic myelinating Schwann cells (J, white triangle), and Remak bundles that are not fully engulfed by basal lamina (J, black triangle). (K) Segmented demyelination: on the same axon, the left internode was absent (black arrowhead), while the right internode was present (white arrowhead) (Scale bars: panel I= 5 μm, panel K= 2 μm). (L-N) At PID42, the large-caliber axons were remyelinated. (M and N) Remak bundle at PID42. Black trianle in M-Remak bundle that is not fully engulfed by basal lamina at PID42 (Scale bars: panel L= 5 μm, panel M- 1 μm, panel K= 2 μm). (O) No axonal loss was observed, values represent mean ± SEM. (P) About 10% of the high-caliber axons (diameter > 1 μm) were demyelinated at PID21, values represent mean ± SEM. (Q) Quantification of phagocytic macrophages in the sciatic nerve, values represent mean ± SEM. (R) Reduced myelin thickness at PID21 (red) and PID42 (green) compared with control (blue). For (A)-(F) PLP-CreERT;ROSA26-EYFP mice; n = 3. (S) Myelin thickness, quantified results, values represent mean ± SEM, (**p < 0.01; unpaired Student’s t test). (T-V) Semi-thin blue sections were harvested from the sciatic nerve at 21 and 42 days post tamoxifen injection (PID) and from control (no disease). (T) No disease. (U) PID21. (V) PID42 (scale bars in T-V, 100 μm). (W and X) The total number of myelinated fibers was quantified from the semi-thin blue sections by the software HALO. (W) An example of the fibers that were counted (red). (X) Quantified results. (A-D) n = 3 PLP-CreERT;ROSA26-EYFP mice. (E-H) PLP-CreERT;ROSA26-eGFP-DTA mice; n = 14–8. For the Cre-negative ROSA26-eGFP-DTA mice; n = 9–5. (I-N) n = 3for no disease, n = 4for PID21, and n = 3for PID42. (T-W) n = 3for no disease, n = 3forPID21, and n = 3for PID42.
Figure 2.
Figure 2.. Glial cell loss induces the expression of regeneration-associated genes in DRG neurons
Eight-week-old PLP-CreERT;ROSA26-eGFP-DTA mice and Cre-negative ROSA26-eGFP-DTA mice (used as control) were injected with tamoxifen, and L3-L5 DRGs were dissected for bulk RNA-seq at PID21. (A) Volcano plot of the differentially expressed genes (DEGs) in the DRG at PID21. Green, downregulated genes; red, upregulated genes. (B) Biological processes analysis of downregulated genes. (C) Biological processes analysis of upregulated genes. (D-G) Verification by immunohistochemistry (IHC). (D) Very few IBAI-positive cells in the control (no disease). (E and F) Infiltration of IBAI-positive cells into the DRG at PID21 (E), and PID42 (F).White arrow marks IBAI-positive cell (Scale bar in D and E = 20 μm, in F= 10 μm).(G) Quantified results, values represent mean ± SEM, (**p < 0.01; unpaired Student’s t test). (H) Volcano plot of the DEGs in the sciatic nerve at PID21. Green, downregulated genes; red, upregulated genes. (I) Biological processes analysis of downregulated genes. (J) Biological processes analysis of upregulated genes. n = 2 biologically independent experiments (FDR ≤ 0.05, fold change ≥2). (D-G) n = 3 for no disease, n = 3 for PID21, and n = 3 for PID42.
Figure 3.
Figure 3.. Induction of an injured transcriptional state in DRG neurons after glial cell loss
(A) Eight-week-oldPLP-CreERT;ROSA26-eGFP-DTA mice and Cre-negative ROSA26-eGFP-DTA mice (used as control) were injected with tamoxifen, and L3-L5 DRGs were dissected for snRNA-seq studies at PID21 and PID42. tSNE plot of 14,065 nuclei from Cre-negative ROSA26-eGFP-DTA mice (no disease) and PLP-CreERT;ROSA26-eGFP-DTA mice at PID21 and PID42. Nine naive cell types, including glial cells and different subtypes of sensory neurons, and one cluster of injured nuclei were identified. Nuclei are colored by cell type (left) or condition (right). (B) Bar plot showing average percentage of nuclei that are in the injured cluster across duplicates in each condition (n = 2). Error bars denote standard deviations. Two-way ANOVA was conducted to compare the percentages across conditions. F(2, 3) = 13.74, p = 0.03. PID21 shows significant increase in injured nuclei compared with no disease control (Bonferroni post hoc, p = 0.03). (C) Dot plot displaying the relative gene expression of marker genes (columns) in the injured cluster and each naive cell type (rows). The fraction of nuclei expressing a marker gene is calculated as the number of nuclei in each cell type that express a gene (>0 counts) divided by the total number of nuclei in the respective cell type. Relative expression in each cell type is calculated as mean expression of a gene relative to the highest mean expression of that gene across all cell types. (D) Overlap between the common neuronal injury-induced genes in SpNT (see STAR Methods) and marker genes in the injured cluster (log2FC > 0.25, p < 0.05, comparing nuclei from the injured cluster with all other nuclei) (hypergeometric test, p = 2e-102). (E) Reactome pathway analysis of the genes induced only by demyelination. (F) Cellular component analysis of the genes induced only by demyelination. (G) Reactome pathway analysis of the genes induced only by SpNT. (H) Reactome pathway analysis of the genes induced by both SpNT and demyelination.
Figure 4.
Figure 4.. Glial cell loss induced transcriptional reprograming selectively in proprioceptive and A² rapidly adapting low-threshold-mechanoreceptor Neurons
(A) Classification of injured DRG nuclei after demyelination by co-clustering with injured nuclei after SpNT. Nuclei after demyelination are in dark red, and nuclei after SpNT are colored by their respective cell types (left). Nuclei after demyelination were annotated by projecting the SpNT neuronal subtype classification onto the cluster. All nuclei are colored by their respective cell types (right). (B) Bar plot showing average percentage of nuclei that are in the injured cluster for each subtype in each condition. Error bar shows the standard deviation across biological replicates. ANOVA was conducted to compare the average percentage of injured nuclei across conditions in each subtype. NF1: F(2, 3) = 87.68, p = 0.002. NF2: F(2, 3) = 81.53, p = 0.002. PID21 shows an increase in percentage of injured nuclei compared with no disease in both NF1 and NF2 (Bonferroni post hoc, p < 0.01). (C and D) Verification of the results by IHC. (C) The expression of ATF3 is induced at peak disease (PID21) specifically in Aβ-LTMR and proprioceptor neurons, marked by NEFH. (D) Quantitative analysis, values represent mean ± SEM. (E) Volcano plot displays DEGs between injured NF2 nuclei from PID21 and nuclei from no disease. Common injury-induced genes in SpNT are colored green. Top 10 most differentially expressed genes that are also common injury-induced genes in SpNT are labeled. (C–D) n = 3 for no disease, n = 3 for PID21, and n = 3 for PID42.

References

    1. Aaker JD, Elbaz B, Wu Y, Looney TJ, Zhang L, Lahn BT, and Popko B (2016). Transcriptional fingerprint of hypomyelination in zfp191null and shiverer (mbpshi) mice. ASN Neuro 8. - PMC - PubMed
    1. Abe N, and Cavalli V (2008). Nerve injury signaling. Curr. Opin. Neurobiol 18, 276–283. - PMC - PubMed
    1. Aibar S, González-Blas CB, Moerman T, Huynh-Thu VA, Imrichova H, Hulselmans G, Rambow F, Marine J-C, Geurts P, Aerts J, et al. (2017). SCENIC: single-cell regulatory network inference and clustering. Nat. Methods 14, 1083–1086. - PMC - PubMed
    1. Alexa A, and Rahnenfuhrer J (2016). topGO: Enrichment analysis for Gene Ontology. R package version 2.28. 0. Cranio.
    1. Arthur-Farraj PJ, Latouche M, Wilton DK, Quintes S, Chabrol E, Banerjee A, Woodhoo A, Jenkins B, Rahman M, Turmaine M, et al. (2012). c-Jun reprograms Schwann cells of injured nerves to generate a repair cell essential for regeneration. Neuron 75, 633–647. - PMC - PubMed

Publication types