. 2022 Jul 19;40(3):111119.
doi: 10.1016/j.celrep.2022.111119.

In vitro atlas of dorsal spinal interneurons reveals Wnt signaling as a critical regulator of progenitor expansion

Affiliations

In vitro atlas of dorsal spinal interneurons reveals Wnt signaling as a critical regulator of progenitor expansion

Sandeep Gupta et al. Cell Rep. .

Abstract

Restoring sensation after injury or disease requires a reproducible method for generating large quantities of bona fide somatosensory interneurons. Toward this goal, we assess the mechanisms by which dorsal spinal interneurons (dIs; dI1-dI6) can be derived from mouse embryonic stem cells (mESCs). Using two developmentally relevant growth factors, retinoic acid (RA) and bone morphogenetic protein (BMP) 4, we recapitulate the complete in vivo program of dI differentiation through a neuromesodermal intermediate. Transcriptional profiling reveals that mESC-derived dIs strikingly resemble endogenous dIs, with the correct molecular and functional signatures. We further demonstrate that RA specifies dI4-dI6 fates through a default multipotential state, while the addition of BMP4 induces dI1-dI3 fates and activates Wnt signaling to enhance progenitor proliferation. Constitutively activating Wnt signaling permits the dramatic expansion of neural progenitor cultures. These cultures retain the capacity to differentiate into diverse populations of dIs, thereby providing a method of increasing neuronal yield.

Keywords: BMP signaling; CP: Stem cell research; Wnt signaling; embryonic stem cells; expansion cultures; psychoactive drug signatures; retinoic acid; sensory interneurons; single-cell profiling; spinal cord.


Conflict of interest statement

Declaration of interests The authors declare no competing interests.

Figures

Figure 1.
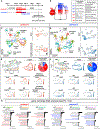
Figure 1.. Distinct temporal combinations of RA and BMP4 direct different mESC identities
(A) Schematic of the source of patterning signals in the neural tube. (B) Schematic of three RA ± BMP4 protocols used to direct mESCs toward dorsal spinal cord identities through an NMP intermediate. (C–E) Protocols 2 and 3, but not protocol 1, induce phosphorylated Smad1/5/8 (p-Smad1/5/8) by day 5 showing active BMP signaling. (F–K) Rosettes expressing Sox2 (NPCs, red, I, K), Pax3 (dPs, red, F, H), Pax6 (dPs, green, F, H), and Tuj1 (neurites, green, I, K) are observed in protocols 1 and 3, but not in protocol 2 (G, J), by day 9. (L) Timeline for bulk RNA-seq sample acquisition (n = 3). (M) Principal-component analysis (PCA) identified similar trajectories for protocols 1 (red, R-branch) and 3 (blue, B-branch), which are distinct from the trajectory of protocol 2 (green, C-branch). (N) Pearson correlation analysis showing the cells from protocols 1 (R9) and 3 (B9) are transcriptionally similar and distinct from those in protocol 2 (C9) at day 9. (O) Weighted gene co-expression network analysis (WGCNA) identified the successive downregulation of a rRNA biogenesis module implicated in the loss of pluripotency (Watanabe-Susaki et al., 2014; Woolnough et al., 2016). Conversely, neural modules are sequentially upregulated in the R- and B-branches, while a cardiac module is sequentially upregulated in the C-branch. See Figure S1E for other modules. Scale bars: 100 μm (C–K).
Figure 2.
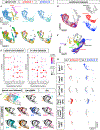
Figure 2.. Single-cell sequencing (sc-seq) identifies relevant spinal-function-specific modules in in-vitro-derived dIs
(A) Timeline for sc sequencing of protocols 1 and 3 (n = 1). (B) Schematic showing the position of dPs and dIs in the spinal cord. dI1–dI6 mediate distinct functionalities and can be distinguished by distinct transcription factors. (C and D) UMAP projection of day 9 cells derived from RA (C) and RA + BMP4 conditions (D). Feature plots show the Sox2+ NPCs and Tubb3 (Tuj1+) differentiated neurons. (E) Protocol 1: sub-clustering of the Tubb3+ neuronal clusters (C) identified 14 clusters (3,394 cells). Feature plots show Pax2+Lhx1+ dI4/dI6, Lmx1b+ dI5, and Dmrt3+ dI6 populations. The pie chart depicts the percentage of dI1–dI6s obtained, only ~8.5% of neuronal cells of unknown identity (see Table S1). Concurring with the in vivo functionality (B), the dI4/dI6 clusters express Gad2 (inhibitory neurons), while the dI5 clusters express Slc17a6 (VGlut2, excitatory neurons). (F) Protocol 3: sub-clustering of the Tuj1+ neuronal clusters shown in (D) identified 13 clusters (3,967 cells). Feature plots show Lhx2+Barhl1+ dI1, Foxd3+ dI2, and Isl1+ dI3 populations. The pie chart represents percentage of dI1–dI6 clusters; ~9.5% of cells are unknown neural identity (see Table S1, cluster 3). As in in vivo (B), the dI1–dI3 clusters express excitatory markers, Slc17a2 and Grin2b. (G) Gene Ontology (GO) analysis of the genes upregulated (logFC > 0.2) in the indicated clusters reveal that the relevant sensory/motor signatures are enriched in the in-vitro-derived dIs.
Figure 3.
Figure 3.. Stem-cell-derived sensory interneurons resemble their endogenous counterparts
(A) Integrated UMAP plot of the sc-seq datasets from the in vitro differentiations and the in vivo embryonic spinal cord (E9.5–E13.5) (Delile et al., 2019). Cell-type labels from the in vivo dataset were projected onto the in vitro dataset. (B) Integrated UMAP plot highlighting the overlap between the in vitro and in vivo cells. An atlas of these combined datasets with dI annotation can be found here (https://www.dropbox.com/s/kau8oc7t6i5lchl/dImap_Briscoe_in vitro combined_3D_interactive.html?dl=0; file opens after being downloaded). (C) Clustering of the integrated dataset yields 24 shared clusters, with 6 clusters unique to the in vivo dataset. (D) Dot plot of the 24 shared clusters showing the expression levels of dI marker genes. (E) Integration of the in vivo spinal cord and in vitro datasets with lung, kidney, and trachea datasets (Tabula Muris Consortium) shows the in vitro cells overlap only with spinal cord cells. (F) UMAP plots of the neuronal portion of the integrated datasets. The in vivo dIs are colored using the in vivo dataset annotations. Each dI population was then overlaid onto the in vitro datasets (black) from either protocol 1 (RA) or 3 (RA + BMP4). Substantial overlap was seen for dI1–dI6, while no overlap was observed for motor neurons (pink). (G) dI-specific cells were extracted from both the in vitro protocols and in vivo spinal cord dataset and then plotted in the integrated UMAP space with in vitro cells on top of in vivo cells.
Figure 4.
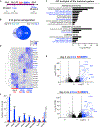
Figure 4.. Wnts are upregulated as an immediate response to BMP4 signaling in mESC-derived NPCs
(A) Timelines for bulk RNA-seq analysis of protocol 3 (n = 3). (B) Venn diagram showing the overlap of genes significantly upregulated after 6 and 24 h of RA + BMP4 treatment (logFC > 2, false discovery rate [FDR] < 0.01). 78 genes were common to both comparisons. (C) GO analysis of the 78 common genes shows the upregulation of the Wnt signaling pathway in all three GO categories: biological processes, molecular processes, and pathway categories. (D) Heatmap showing the expression (FPKM, N = 3) of 19 Wnt ligands at day 4 (dP state1), day 4.25 (immediate response to BMP4), and day 5 (dP state2). (E) Volcano plots showing upregulated genes at 6 and 24 h of RA + BMP4 treatment. Multiple Wnt ligands and Wnt pathway genes are highly upregulated in both conditions. (F) qRT-PCR validation of selected Wnt genes under RA, RA + BMP4, and RA + BMP4 + noggin conditions at day 5. Wnt expression was significantly upregulated by BMP4 but reduced in the presence of noggin. n = 3 differentiations. The data are presented as the mean ± SEM. Significance is determined by two-way ANOVA (Tukey’s multiple comparison test), *p < 0.05, **p < 0 .005, ***p < 0.0005.
Figure 5.
Figure 5.. Wnt/β-catenin signaling is required for BMP4-mediated neuronal diversity
(A) Timeline to assess the requirement for Wnt signaling in the induction of dI fates. (B–Q) Protocol 1 induces Pax2+ dI4/dI6s (E and Q) and Lmx1b+ dI5s (E), while protocol 3 induces the Lhx2+ dI1s (F and N), Foxd3+ dI2s (G and O), and Isl1+ dI3s (H and P). The addition of IWR1e to protocol 3 dramatically reduces the number of dI1s and dI2s (J, K, N, and O), more modestly decreases the dI3s (L and P), and concomitantly increases the dI4–dI6s (M and Q). n = 3 differentiations for qRT-PCR. Significance tests: one-way ANOVA, *p < 0.05, **p < 0 .005, ***p < 0.0005. Scale bar: 100 μm.
Figure 6.
Figure 6.. Wnt/β-catenin signaling mediates proliferation, not patterning, of mESC-derived spinal NPCs
(A) Timeline to assess whether Wnt signaling modulates the BMP-mediated dI fates through patterning activities. (B) qRT-PCR analyses for dI1–dI3 marker genes show that neither Wnts (100 ng/mL) nor CHIR (5 μM) affect (one-way ANOVA) the BMP4-mediated dI fates. Expression levels were normalized to the day 0 and RA condition (n = 2). (C) Embryoid body (EB) differentiation timeline to assess the effect of activating Wnt signaling on the NPC proliferation. Samples were collected at day 9 for immunohistochemistry (IHC) and qRT-PCR. (D–I) Both EdU incorporation (red, D–G; S-phase) and phosphorylated histone H3 staining (blue, D–G; pH3, M-phase) show that CHIR treatment increases cell proliferation by ~3-fold in RA ± BMP4-patterned EBs, compared with DMSO control, resulting in increased numbers of Sox2+ NPCs (green, D–G). Significance was determined using one-way ANOVA (Kruskal-Wallis test) (n = 15–25 EBs). (J–P) IHC (J–M) and qRT-PCR (N–P) for Pax3 (red, J–M; all dPs), Olig3 (green, J–M; dP1–dP3), and Pax7 (blue, J; dP4–dP6) demonstrated that CHIR treatment increases the numbers of NPCs but does not significantly (unpaired t test) alter their dorsal-ventral identities (n = 3 differentiations for qRT-PCR). Significance values: *p < 0.05, **p < 0 .005, ***p < 0.0005. Scale bar: 200 μm.
Figure 7.
Figure 7.. Activating canonical Wnt signaling expands mESC-derived NPC populations
(A) Timeline for the expansion protocol for mESC-derived spinal cord progenitors. (B–I) RA-treated (B–E) and RA + BMP4-treated (F–I) EBs were passaged with DMSO (B and F) or CHIR (C, D, G, and H). Bright-field images (B, C, F, and G) show that passaging with CHIR, but not DMSO, causes >6-fold increase in the number of EBs (E and I; one-way ANOVA Kruskal-Wallis test, n = 2 independent differentiations). All CHIR-treated EBs maintain a Sox2+ NPC identity after passages 1 and 2 (D and H), but the expansion of RA-patterned EBs was less robust than that of RA + BMP4-patterned EBs (E and I). (J) Schematic of the timeline and experimental approaches to assay the differentiation potential of CHIR-treated EBs. The left timeline shows conditions to induce neural differentiation in CHIR-expanded EBs following their dissociation. The right timeline determines the extent to which dI patterning can be restored in CHIR-treated EBs, with a 2-day pulse of RA ± BMP4. (K–Q) IHC analysis for Sox2+ NPCs and Tuj1+ neurites on passage 6 EBs (48 days) revealed that removal of CHIR induces spontaneous neural differentiation in both RA-treated (L) and RA + BMP4-treated (O) EBs. The addition of DAPT had a modest effect on the number of Tuj1+ neurites (M and P). qRT-PCR analyses confirm the upregulation of Tubb3 and NeuN in CHIR-depleted conditions. (Q) However, the number of Sox2+ cells remains unchanged. (R–X) Assessing the patterning profile of expanded EBs showed they can differentiate into dI5s (R and X; RA control) or dI3s (U; RA + BMP4 control), but not dI1s, dI2s, and dI4s (R, T, and X). A 2-day pulse of RA ± BMP4 from day 3 to 5 restored dI1/2 differentiation (V and X) with an ~5-fold increase in the number of Pax2+-dI4/dI6 neurons (S and X). The differentiation potential of passage (p) 1 and p6 (X) EBs did not show significant change over time, except for dI2s, where differentiation potential modestly improves over time (n = 6–10 EBs, Mann-Whitney test). Significance values: *p < 0.05, **p < 0.005, ***p < 0.0005. Scale bars: 2 mm (B, C, F, and G); 100 μm (Q–V); 2,000 μm (J–O).

References

    1. Abou Chakra M, Isserlin R, Tran TN, and Bader GD (2021). Control of tissue development and cell diversity by cell cycle-dependent transcriptional filtering. Elife 10. 10.7554/eLife.64951. - DOI - PMC - PubMed
    1. Agalliu D, Takada S, Agalliu I, McMahon AP, and Jessell TM (2009). Motor neurons with axial muscle projections specified by Wnt4/5 signaling. Neuron 61, 708–720. 10.1016/j.neuron.2008.12.026. - DOI - PMC - PubMed
    1. Alvarez-Medina R, Cayuso J, Okubo T, Takada S, and Marti E (2008). Wnt canonical pathway restricts graded Shh/Gli patterning activity through the regulation of Gli3 expression. Development 135, 237–247. 10.1242/dev.012054. - DOI - PubMed
    1. Andersson LS, Larhammar M, Memic F, Wootz H, Schwochow D, Rubin CJ, Patra K, Arnason T, Wellbring L, Hjalm G, et al. (2012). Mutations in DMRT3 affect locomotion in horses and spinal circuit function in mice. Nature 488, 642–646. 10.1038/nature11399. - DOI - PMC - PubMed
    1. Andrews MG, Del Castillo LM, Ochoa-Bolton E, Yamauchi K, Smogorzewski J, and Butler SJ (2017). BMPs direct sensory interneuron identity in the developing spinal cord using signal-specific not morphogenic activities. Elife 6. 10.7554/eLife.30647. - DOI - PMC - PubMed

Publication types