. 2022 Jul 19;40(3):111114.
doi: 10.1016/j.celrep.2022.111114.

PDGFRβ+ cells play a dual role as hematopoietic precursors and niche cells during mouse ontogeny

Affiliations

PDGFRβ+ cells play a dual role as hematopoietic precursors and niche cells during mouse ontogeny

Diana Sá da Bandeira et al. Cell Rep. .

Abstract

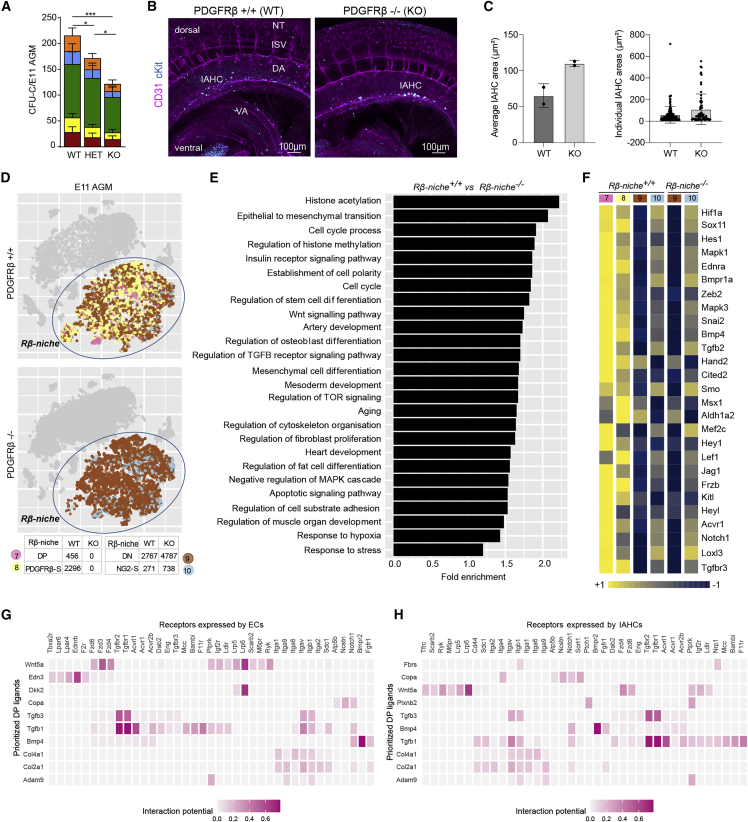
Hematopoietic stem cell (HSC) generation in the aorta-gonad-mesonephros region requires HSC specification signals from the surrounding microenvironment. In zebrafish, PDGF-B/PDGFRβ signaling controls hematopoietic stem/progenitor cell (HSPC) generation and is required in the HSC specification niche. Little is known about murine HSPC specification in vivo and whether PDGF-B/PDGFRβ is involved. Here, we show that PDGFRβ is expressed in distinct perivascular stromal cell layers surrounding the mid-gestation dorsal aorta, and its deletion impairs hematopoiesis. We demonstrate that PDGFRβ+ cells play a dual role in murine hematopoiesis. They act in the aortic niche to support HSPCs, and in addition, PDGFRβ+ embryonic precursors give rise to a subset of HSPCs that persist into adulthood. These findings provide crucial information for the controlled production of HSPCs in vitro.

Keywords: AGM single-cell RNA-sequencing; Bmp4; CP: Developmental biology; CP: Stem cell research; HSPC precursor; MSCs; PDGFRβ; VSMCs; hematopoietic niche; osteogenesis; pericytes.


Conflict of interest statement

Declaration of interests The authors declare no competing interests.

Figures

None
Graphical abstract
Figure 1
Figure 1
Distinct phenotypic and transcriptomic perivascular cell subsets surround the midgestation DA (A) Immunohistochemistry of E11 WT DA, showing NG2 (i, ii), PDGFRβ (i, ii), and CD31 (ii) expression. Nuclei were counterstained with DAPI. CV, cardinal veins; NC, notochord. (B) t-distributed stochastic neighbor embedding (t-SNE) plots showing 12 E11 WT cell populations and their numbers (42sp). (C) Violin plots showing the expression of genes used to identify the cell clusters DP, PDGFRβ-S, DN, and NG2-S. MP, macrophages; OBC, other blood cells; Ery/EryP, erythroid/progenitors; IAHC, intra-aortic hematopoietic clusters; HEC/EHT, hemogenic endothelial cells/endothelial-to-hematopoietic transition; EC, endothelial cells; SNS, sympathetic nervous system; SkMP, skeletal muscle progenitors. (D and E) Heatmaps showing gene expression of differentially expressed genes encoding surface (D) and intra-/extracellular (E) proteins enriched in each of the NG2+/−PDGFRβ+/− populations. (F) Isolation of perivascular cells. (G) Fragments per kilobase of transcript per million mapped reads (FPKM) values of selected genes by bulk RNA-seq.
Figure 2
Figure 2
PDGFRβ deletion impairs AGM HSPC number and alters the genetic program of the niche (A) CFU-C numbers per E11 AGM; error bars: SD; p < 0.05; ∗∗∗p < 0.001 (see Table S1). (B) Whole-mount immunostaining of WT/KO E10.5 AGMs (n = 2/2 embryos, N = 2 experiments) stained with CD31 and cKit. (C) The average of IAHC area (left) and individual areas of all IAHC combined (right) are shown (n = 2/2, N = 2); error bars: SD. (D) t-SNE plots showing the Rβ-niche cluster used for WT/KO comparisons containing clusters 7, 8, 10, and a subset of 9. (E) Selected gene ontology (GO) biological processes significantly overrepresented in genes significantly downregulated in the KO Rβ-niche. (F–H) Heatmap of top genes associated with the mesenchymal cell differentiation GO: 0048762 significantly downregulated in the KO Rβ-niche (see Table S4). Ligand-receptor interactions inferred by NicheNet between DP cells and ECs (G) or IAHCs (H). Genes from the GO term “mesenchymal cell differentiation” (E) were used as a DP gene set of interest for (G) and (H).
Figure 3
Figure 3
PDGFRβ+ MSCs are essential for hematopoiesis (A) Schema of co-cultures AGM MSCs and BM LSKs or AGM HSPC/ECs. (B–D) Images of P3 MSCs; 100μm. Example of flow cytometry plots (C) and histograms (D) showing PDGFRβ expression in MSCs; error bars: SD. (E) Images of PDGFRβ WT and mutant E11 AGM MSCs co-cultured with BM LSKs; 100μm. (F) Gating showing the percentage of CD45+ cells derived from MSC-LSK co-cultures. (G and H) Percentage of CD45+ cells 7 days post-co-culture (G) and CFU-C numbers obtained from co-cultures (H) (n = 5/6/5/4 MSC lines) (see Table S5); error bars: SD; ∗p < 0.05. (I) Images of MSCs co-cultured with WT E11 AGM-derived HPSCs and ECs; 100μm. (J) Percentage of CD45+ cells 7 days post-co-culture; error bars: SD. (K) CFU-Cs obtained from co-cultures with E11 AGM MSCs; error bars: SD; ∗p < 0.05, ∗∗p < 0.01. (I–K) n = 3/3/3 MSC lines (see Table S5). (L) Expression of osteogenic genes in WT/KO Rβ-niche (see Table S4). (M) Osteogenic assay. (N) Example of alizarin red staining of PDGFRβ WT, HET, and KO MSCs. (O) Percentage of osteogenic MSC lines. WT: 6/6; HET: 6/7; and KO: 2/7. p = 0.015, ∗∗p = 0.006, z test for proportions. (P) Numbers of MSCs at day 0 of osteogenic assay (WT/HET/KO = 6/6/7); error bars: SD.
Figure 4
Figure 4
Transcriptomic differences by scRNA-seq between WT and KO EC, HEC/EHT, and IAHCs (A) Heatmap showing the expression of Pecam1, Kit, Ptprc, and Runx1 identifying these clusters. (B and C) Scatterplots with genes from (A) that are downregulated in IAHC and ECs. (D) Genes associated with BMP/TGFβ, NOTCH, and WNT pathways in EC, HEC/EHT, and IAHCs. (E and F) Genes from (D) that are downregulated in IAHC and ECs. Red dots: significantly downregulated genes. (G and H) Selected biological processes significantly overrepresented in genes significantly downregulated in the KO IAHC (G) and in the KO ECs (H).
Figure 5
Figure 5
A subset of ECs, HEC/EHT, and IAHCs derived from PDGFRβ+ precursors (A–D) Immunohistochemistry of E11 PDGFRβ-Cre:mTmG AGM stained with NG2 (A and B) and CD31 (C) and at E10 with Runx1 (D). (A and B) Arrowheads: DP cells; stars: GFP+ mesenchymal cells. (C) Dashed lines: presumptive separation between DP, PDGFRβ-S, and DN layers; stars: hematopoietic CD31+GFP+ cells. (E–I) Flow cytometry analyses of E10 (n = 7) and E11 (n = 3) PDGFRβ-Cre; tdTomato AGMs, percentage of Tomato+/− cells within (E) PDGFRβ+ cells, (F) EC (CD45cKitCD31+CD41), (G) HEC/EHT-enriched population (CD45cKitCD31+CD41+), (H) IAHC/HSPC (CD31+cKit+), and (I) MP-enriched population (CD45+CD31) live cells; error bars: SD; ∗p < 0.05, ∗∗p < 0.005, ∗∗∗p < 0.005, ∗∗∗∗p < 0.0005. (J) CFU-Cs on PDGFRβ+/− cells sorted from E10 (n = 8) and E11 (n = 6) AGMs (see Table S6). E11 AGM were ckit+; error bars: SD; ∗∗∗p < 0.005, ∗∗∗∗p < 0.0005. (K) CFU-Cs on Tomato+/− cells sorted from PDGFRβ-Cre; tdTomato E10 (n = 6) and E11 (n = 4) AGMs (see Table S7); error bars: SD; ∗∗∗p < 0.005. (L) PCR on E11 unsorted cells from PDGFRβ-Cre; tdTomato and +; tdTomato WT littermates heads and from sorted AGM cells to detect Cre recombinase expression (324 bp). Unpaired t tests or Mann-Whitney tests were used for the statistics.
Figure 6
Figure 6
PDGFRβ+ cells from E7.5–E9.5 mouse embryo contribute to peri/vascular/hematopoietic lineages present in the E11.5 AGM (A) PDGFRβ-Cre-derived cell tracing. (B and C) Immunohistochemistry on PDGFRβ-P2A-CreERT2; mTmG E11 AGMs showing CD31 and GFP (B) and Runx1 and GFP (C). (D–G) Flow cytometry plots (D and F) and quantification (E and G) of GFP or Tomato expression within Ter119+ cells from E11 AGM (D and E) (n = 5) and YS (n = 9) (F and G); error bars: SD; ∗∗∗∗p < 0.0001, unpaired t test.
Figure 7
Figure 7
A subset of E14 FL and adult BM LSKs derived from PDGFRβ+ precursors (A–H) Analysis of Tomato+/− LSKs from PDGFRβ-Cre; tdTomato and PDGFRβ+/+; tdTomato E14 FL littermates (A and B) and adult BM (D and E). Percentage of Tomato+/− within LSKs per E14 FL (n = 5) (C) and adult BM (n = 4) (F). CFU-Cs from sorted Tomato+/− cells E14 FL (n = 5) (G) and adult BM (n = 4) (H); error bars: SD; ∗∗p < 0.01, ∗∗∗∗p < 0.0001 (see Table S7). (I) Transplantation of Tomato+/− cells sorted from E14FL and adult BM into primary (1°) and secondary (2°) recipients.

Similar articles

Cited by

References

    1. Amezquita R.A., Lun A.T.L., Becht E., Carey V.J., Carpp L.N., Geistlinger L., Marini F., Rue-Albrecht K., Risso D., Soneson C., et al. Orchestrating single-cell analysis with Bioconductor. Nat. Methods. 2020;17:137–145. doi: 10.1038/s41592-019-0654-x. - DOI - PMC - PubMed
    1. Armulik A., Abramsson A., Betsholtz C. Endothelial/pericyte interactions. Circ. Res. 2005;97:512–523. doi: 10.1161/01.res.0000182903.16652.d7. - DOI - PubMed
    1. Azzoni E., Frontera V., McGrath K.E., Harman J., Carrelha J., Nerlov C., Palis J., Jacobsen S.E.W., de Bruijn M.F. Kit ligand has a critical role in mouse yolk sac and aorta-gonad-mesonephros hematopoiesis. EMBO Rep. 2018;19 doi: 10.15252/embr.201745477. - DOI - PMC - PubMed
    1. Barrionuevo F., Taketo M.M., Scherer G., Kispert A. Sox9 is required for notochord maintenance in mice. Dev. Biol. 2006;295:128–140. doi: 10.1016/j.ydbio.2006.03.014. - DOI - PubMed
    1. Bertrand J.Y., Cisson J.L., Stachura D.L., Traver D. Notch signaling distinguishes 2 waves of definitive hematopoiesis in the zebrafish embryo. Blood. 2010;115:2777–2783. doi: 10.1182/blood-2009-09-244590. - DOI - PMC - PubMed

Publication types

Substances