. 2022 Jul 19;40(3):111093.
doi: 10.1016/j.celrep.2022.111093.

Mucolytic bacteria license pathobionts to acquire host-derived nutrients during dietary nutrient restriction

Affiliations

Mucolytic bacteria license pathobionts to acquire host-derived nutrients during dietary nutrient restriction

Kohei Sugihara et al. Cell Rep. .

Abstract

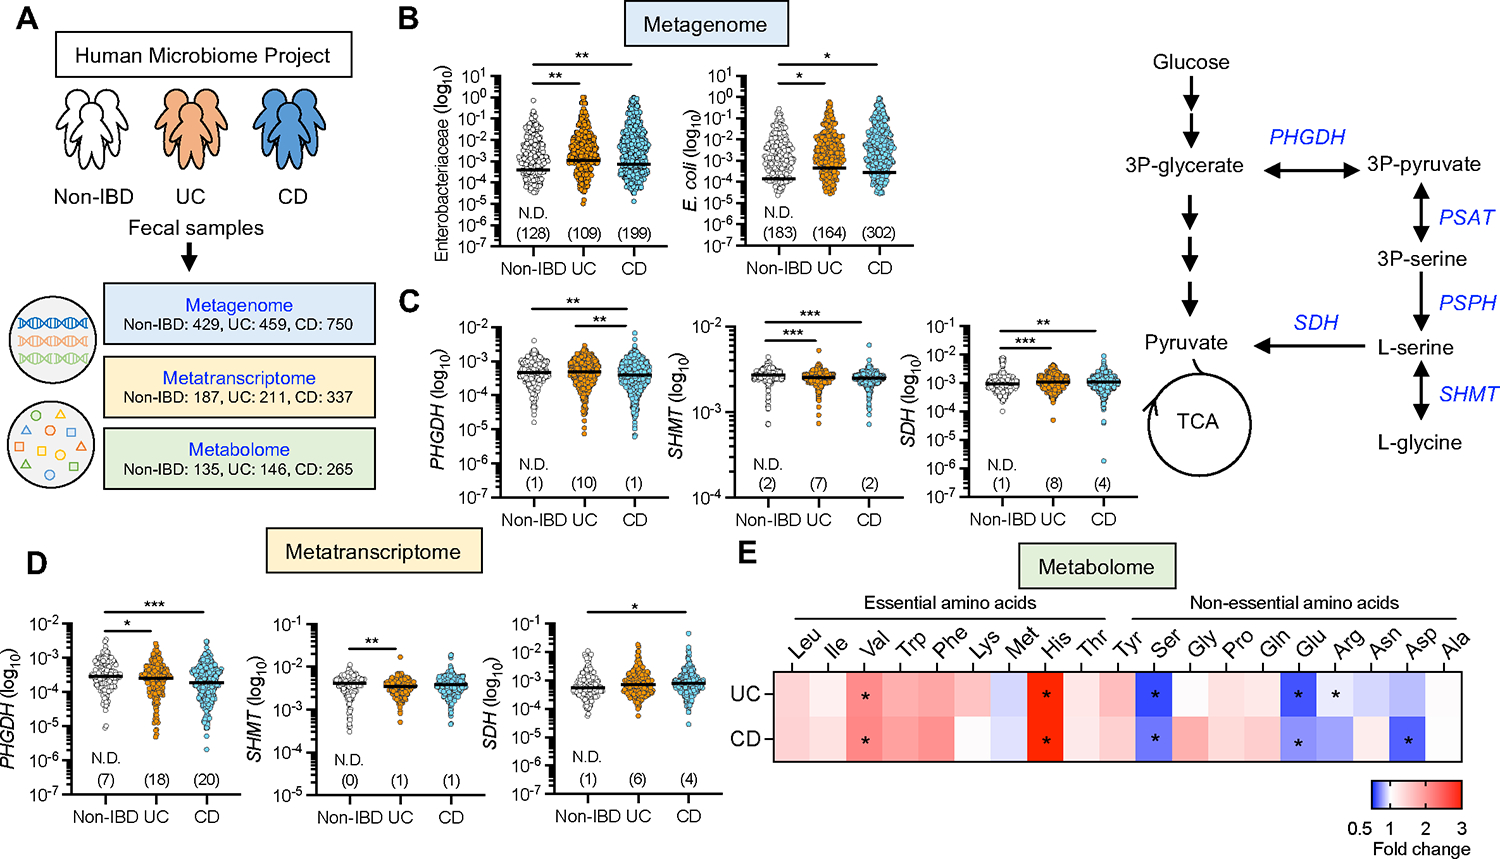
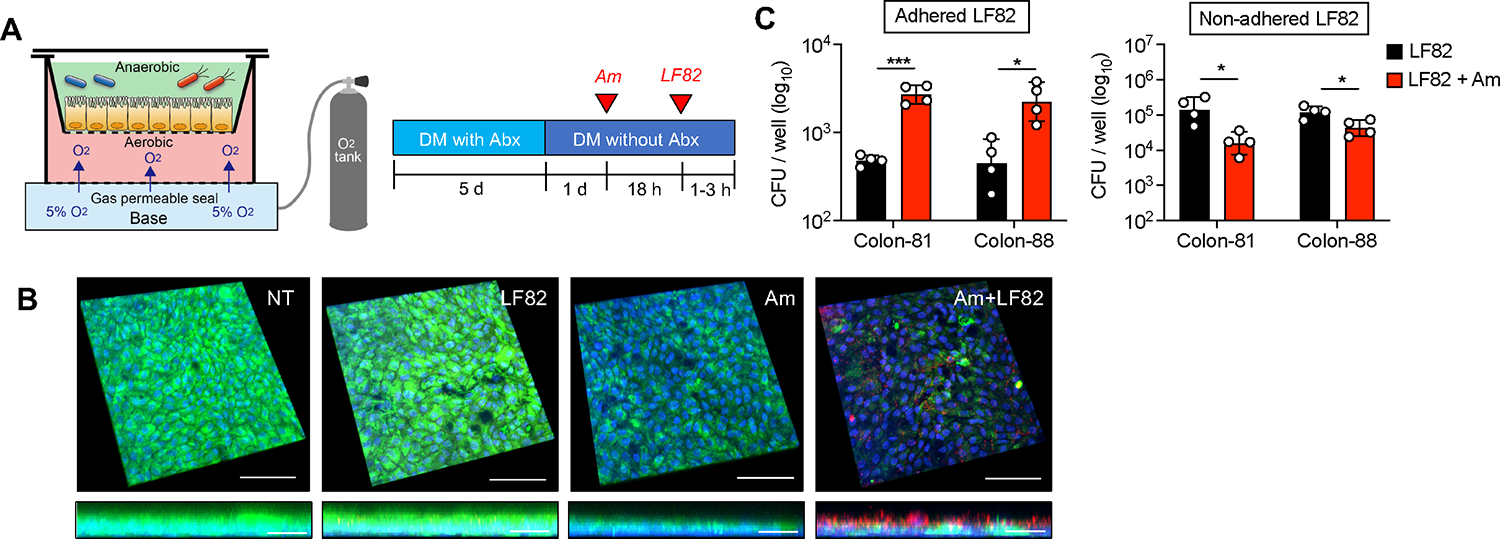
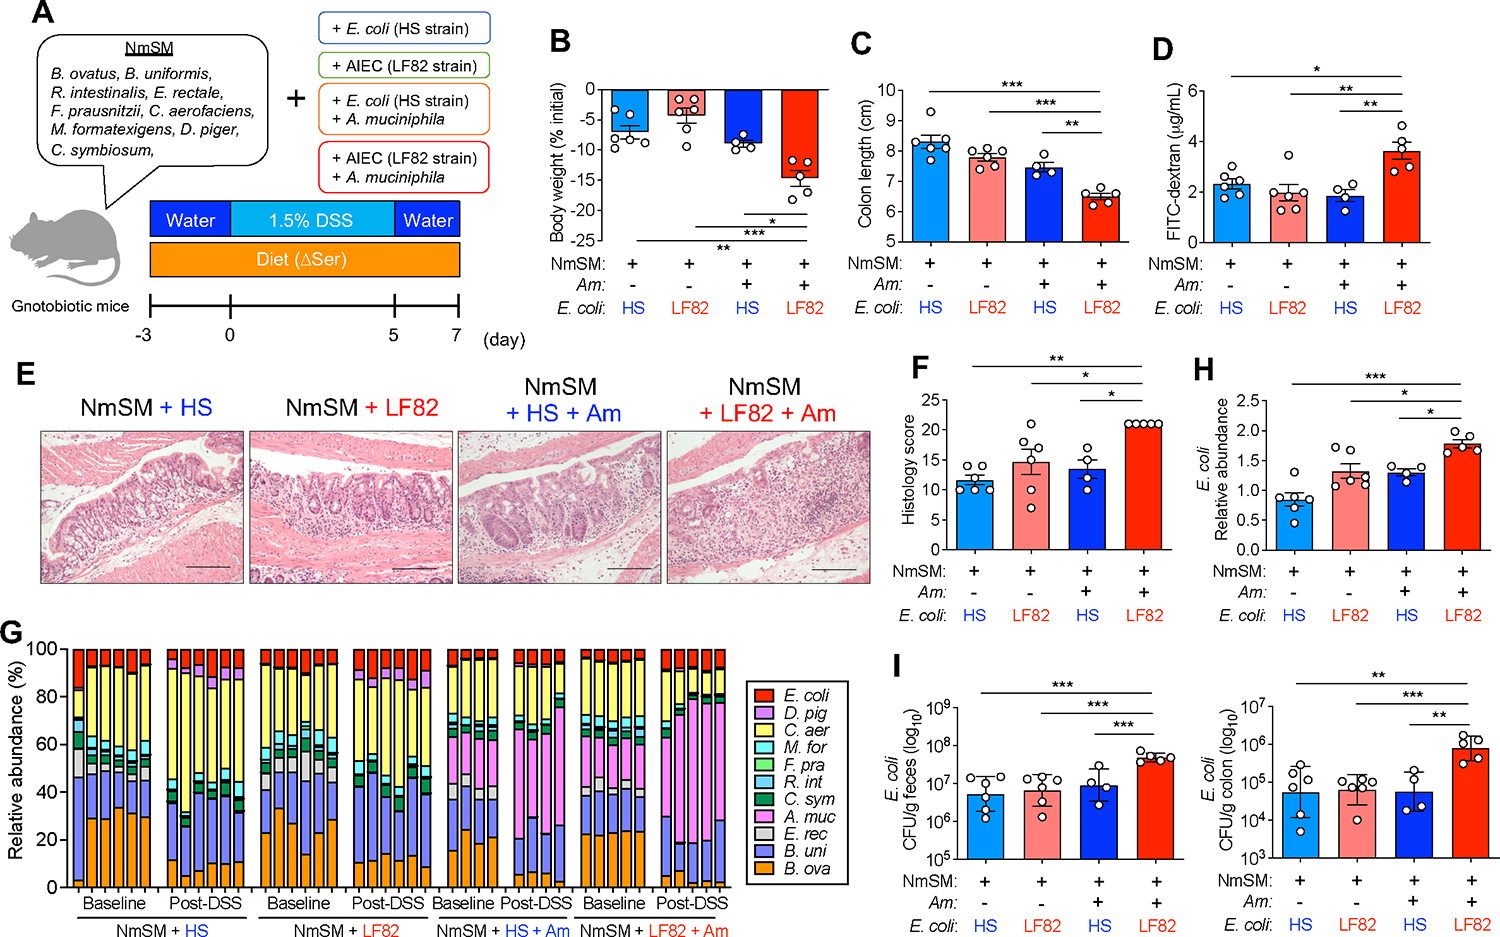
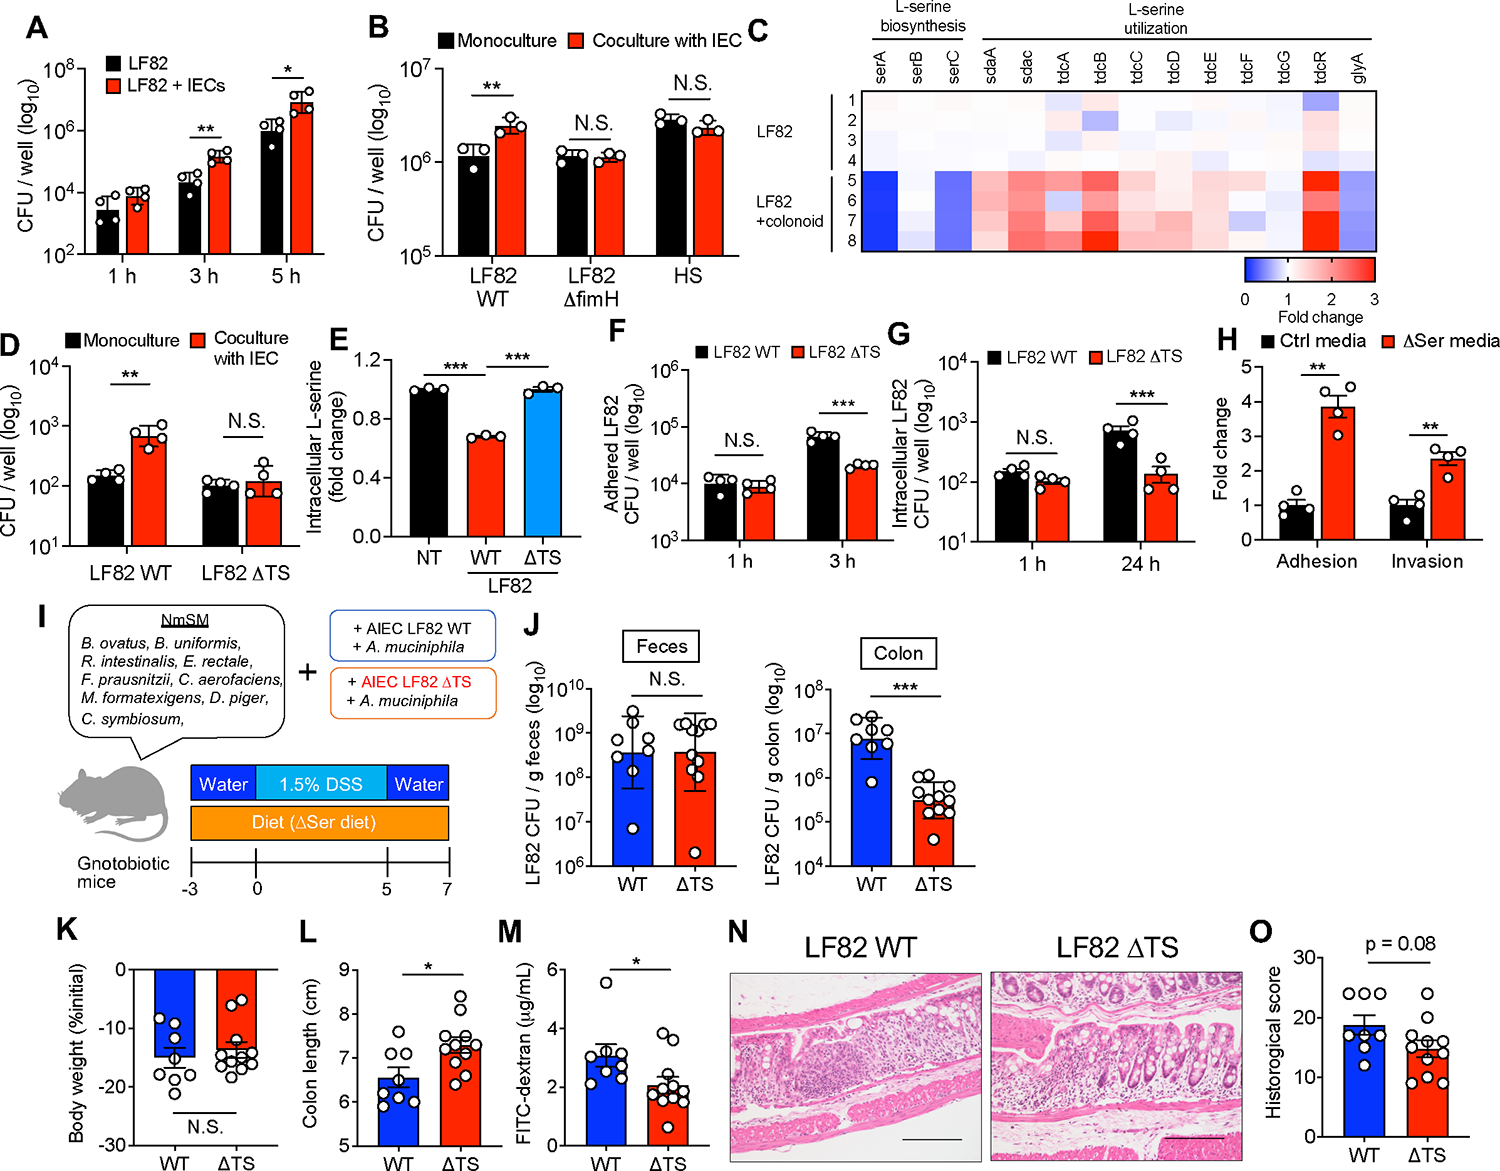
Pathobionts employ unique metabolic adaptation mechanisms to maximize their growth in disease conditions. Adherent-invasive Escherichia coli (AIEC), a pathobiont enriched in the gut mucosa of patients with inflammatory bowel disease (IBD), utilizes diet-derived L-serine to adapt to the inflamed gut. Therefore, the restriction of dietary L-serine starves AIEC and limits its fitness advantage. Here, we find that AIEC can overcome this nutrient limitation by switching the nutrient source from the diet to the host cells in the presence of mucolytic bacteria. During diet-derived L-serine restriction, the mucolytic symbiont Akkermansia muciniphila promotes the encroachment of AIEC to the epithelial niche by degrading the mucus layer. In the epithelial niche, AIEC acquires L-serine from the colonic epithelium and thus proliferates. Our work suggests that the indirect metabolic network between pathobionts and commensal symbionts enables pathobionts to overcome nutritional restriction and thrive in the gut.

Keywords: Akkermansia muciniphila; CP: Microbiology; L-serine; adherent-invasive Escherichia coli; inflammatory bowel disease; intestinal mucus barrier.


Conflict of interest statement

Declaration of interests The authors declare no competing interests.

Figures

Figure 1.
Figure 1.. L-serine metabolism is disturbed in the gut microbiota of IBD patients
(A) Metagenomics, metatranscriptomics, and metabolomics data were downloaded from the public resource, the second phase of the Integrative Human Microbiome Project (HMP2 or iHMP) – the Inflammatory Bowel Disease Multi’omics Database. (B) Abundance of Enterobacteriaceae and E. coli in the metagenomics database. (C) Abundance of PHGDH, SHMT, and SDH in the metagenomics database (left). Schematic of L-serine metabolism (right). (D) Abundance of PHGDH, SHMT, and SDH in the metatranscriptomics database. (E) Abundance of fecal amino acids in the metabolomics database. The heatmap indicates the fold change (UC or CD/non-IBD). Dots indicate individual people, with median (Metagenome: N = 429 Non-IBD, 459 UC, 750 CD. Metatranscriptome: N = 187 Non-IBD, 211 UC, 337 CD. Metabolome: N = 135 Non-IBD, 146 UC, 265 CD). The numbers in parentheses indicate the number of null values. *p < 0.05, **p < 0.01, ***p < 0.001 by Kruskal–Wallis test with Dunn test for multiple comparisons. PHGDH, phosphoglycerate dehydrogenase; SHMT, serine hydroxymethyltransferase; SDH, serine dehydratase. See also Figure S1.
Figure 2.
Figure 2.. Deprivation of dietary L-serine exacerbates gut inflammation in DSS-induced colitis through the gut microbiota
(A) SPF C57BL/6 mice were fed the control diet (Ctrl) or the ΔSer diet for 3 days, then given 1.5% DSS for 5 days, followed by conventional water for 2 days. On day 7 post-DSS, all mice were euthanized. (B and C) Body weight and DAI were monitored during the 5-day DSS treatment. (D–F) Colon length, representative histological images of colon sections (scale bar, 200 μm), and histology scores were evaluated. (G) GF Swiss Webster mice were fed a Ctrl diet or a ΔSer diet for 3 days and then treated with 1.5% DSS for 5 days. On day 5 post-DSS, all mice were euthanized. (H–J) Colon length, representative histological images of colon sections (Scale bar, 200 μm), and histology scores were assessed. (B–D and H–J) Data pooled from two independent experiments (N = 7–10). (E, F) Data are representative of two independent experiments (N = 5). Dots indicate individual mice, with mean ± SEM. N.S., not significant, *p < 0.05, **p < 0.01, ***p < 0.001 by 1-way ANOVA or 2-way ANOVA with Tukey post hoc test. See also Figure S2.
Figure 3.
Figure 3.. Deprivation of dietary L-serine fosters blooms of pathotype E. coli and A. muciniphila in the inflamed gut
(A) Feces were collected from Ctrl diet– and ΔSer diet–fed mice with and without DSS treatment, and DNA was isolated. Gut microbiota was analyzed by 16S rRNA sequencing. (B) Significantly enriched bacterial taxa in Ctrl diet–fed mice (blue bars) and ΔSer diet–fed mice (red bars) were identified by LEfSe analysis. (C) The relative abundance of A. muciniphila and E. coli was each quantified by qPCR. (D) The heat map shows the abundance of E. coli virulence genes in ΔSer diet–fed colitis mice compared to Ctrl diet–fed colitis mice. Data are representative of two independent experiments (N = 4–5). Dots indicate individual mice, with mean ± SEM. N.S., not significant. ***p < 0.001 by 1-way ANOVA with Tukey post hoc test.
Figure 4.
Figure 4.. Disruption of colonic mucus barrier under L-serine starvation enhances the encroachment of AIEC to the epithelial niche.
(A) Relative abundance of A. muciniphila and E. coli during DSS treatment were each assessed by qPCR. (B and C) Colonic sections were stained with AB/PAS, and the thickness of the inner mucus layer was measured (scale bar, 100 μm). (D) Intestinal permeability was assessed with FITC–dextran. (E) Immunostaining (MUC2, green; DAPI, blue) and FISH (EUB338 probe, red,) of Carnoy’s solution–fixed colonic sections (scale bar, 100 μm). (F) SPF C57BL/6 mice were fed the Ctrl diet or the ΔSer diet for 3 days, then given 1.5% DSS for 5 days, followed by conventional water for 2 days. Mice were infected with each strain of E. coli (1 × 10⁹ CFU/mouse) on days 5 and 6. On day 7 post-DSS, all mice were euthanized. (G) Homogenates of colon tissues were cultured on LB agar plates supplemented with ampicillin or streptomycin. The number of viable bacteria was estimated by counting the CFUs and calculating the fold change (ΔSer diet/Ctrl diet). Data are representative of two independent experiments (N = 4–5). Dots indicate individual mice, with mean ± SEM or geographic mean ± SD. N.S., not significant, *p < 0.05, **p < 0.01, ***p < 0.001 by 1-way ANOVA with Tukey post hoc test or unpaired t test.
Figure 5.
Figure 5.. A. muciniphila-mediated mucus disruption facilitates adhesion of AIEC to IECs
(A) Assembly of anaerobic coculture system. The human-derived colonoid monolayer (HCM) from each donor (colon-81 and colon-88) was differentiated for 6 days by differentiation media (DM) with or without antibiotics (Abx). A. muciniphila was infected for 18 h, and then AIEC LF82 was infected for 1–3 h. (B) Immunofluorescence staining of MUC2 (green), E. coli (red), and DAPI (blue). Scale bar, 100 μm (XYZ axis) and 20 μm (XZ axis). (C) Cell-associated AIEC LF82 was cultured on LB agar plates supplemented with ampicillin. The number of viable bacteria was estimated by counting the CFUs. Data are representative of two independent experiments (N = 4). Dots indicate individual mice, with geographic mean ± SD. N.S., not significant. *p < 0.05, ***p < 0.001 by unpaired t test.
Figure 6.
Figure 6.. AIEC and A. muciniphila cooperatively exacerbate colitis under L-serine restriction
(A) Experimental protocol and the composition of the nonmucolytic synthetic human gut microbiota (NmSM) for the gnotobiotic mouse experiments. (B and C) Body weight and colon length were measured 7 days post DSS treatment. (D) Intestinal permeability was assessed with FITC–dextran. (E and F) Representative histological images of colonic sections stained with HE (scale bar, 200 μm) and the histology scores. (G and H) The relative abundance of each bacterial strain at baseline and post-DSS treatment was assessed by qPCR. Fold change of E. coli abundance (post-DSS/baseline) was calculated. (I) Homogenates of feces or colon tissues were cultured on LB agar plates. The number of viable bacteria was estimated by counting the CFUs. Data are representative of two independent experiments (N = 5–6). Dots indicate individual mice, with mean ± SEM or geographic mean ± SD. N.S., not significant. *p < 0.05, **p < 0.01, ***p < 0.001 by 1-way ANOVA with Tukey post hoc test. See also Figure S3.
Figure 7.
Figure 7.. L-serine utilization by AIEC is a partial requirement for the exacerbation of colitis under L-serine deprivation
(A and B) E. coli strains were cultured with and without T84 cells. After 1–5 h infection, the CFUs of total bacteria, including adhered and nonadhered bacteria, were counted. (C) AIEC LF82 was monocultured or cocultured with the human-derived colonoid monolayer (HCM) for 3 h, and the transcriptomic profiles were evaluated by RNA-seq. The heat map shows fold changes of L-serine metabolism genes (LF82 + HCM/LF82). (D) LF82 WT or ΔTS mutant strains were infected in T84 cells for 5 h, and then the CFUs of total bacteria were counted. (E) Fold changes of intracellular L-serine after infection of T84 cells with AIEC strain LF82. (F) T84 cells were infected with LF82 WT or ΔTS mutant strains. After 3 h, adhesion bacteria were counted. (G) T84 cells were infected with LF82 WT or ΔTS mutant strains. After 1 h, the cells were cultured with gentamicin (100 μg/mL) for 24 h. Intracellular bacteria were plated on LB agar plates and counted. (H) LF82 and T84 cells were cocultured in the Ctrl media or ΔSer media. After a 3 h infection, adhesion and invasion bacteria were plated on LB agar plates and counted. (I) Experimental design. GF mice were colonized by nonmucolytic synthetic human gut microbiota (NmSM) and A. muciniphila with LF82 WT or ΔTS mutant strains. (J) On day 7 post-DSS, all mice were euthanized, and the LF82 burden in the colon and feces was assessed. (K and L) Body weight and colon length. (M) Intestinal permeability was evaluated by FITC–dextran assay. (N and O) Representative histological images (scale bar, 200 μm) and histology scores were evaluated. (A–H) Data are representative of two or three independent experiments (N = 3–4). (J–O) Data pooled from two independent experiments (N = 4–7). Dots indicate individual mice, with mean ± SEM or geographic mean ± SD. N.S., not significant. *p < 0.05, **p < 0.01, ***p < 0.001 by 1-way ANOVA with Tukey post hoc test or unpaired t test. See also Figure S4.

References

    1. Ananthakrishnan AN (2015). Epidemiology and risk factors for IBD. Nat Rev Gastroenterol Hepatol 12, 205–217. 10.1038/nrgastro.2015.34. - DOI - PubMed
    1. Becattini S, Sorbara MT, Kim SG, Littmann EL, Dong Q, Walsh G, Wright R, Amoretti L, Fontana E, Hohl TM, and Pamer EG (2021). Rapid transcriptional and metabolic adaptation of intestinal microbes to host immune activation. Cell Host Microbe. 10.1016/j.chom.2021.01.003. - DOI - PMC - PubMed
    1. Caballero-Flores G, Pickard JM, Fukuda S, Inohara N, and Nunez G (2020). An Enteric Pathogen Subverts Colonization Resistance by Evading Competition for Amino Acids in the Gut. Cell Host Microbe 28, 526–533 e525. 10.1016/j.chom.2020.06.018. - DOI - PMC - PubMed
    1. Cameron EA, and Sperandio V (2015). Frenemies: Signaling and Nutritional Integration in Pathogen-Microbiota-Host Interactions. Cell Host Microbe 18, 275–284. 10.1016/j.chom.2015.08.007. - DOI - PMC - PubMed
    1. Cani PD, and de Vos WM (2017). Next-Generation Beneficial Microbes: The Case of Akkermansia muciniphila. Front Microbiol 8, 1765. 10.3389/fmicb.2017.01765. - DOI - PMC - PubMed

Publication types

LinkOut - more resources