. 2022 Jul 19;40(3):111103.
doi: 10.1016/j.celrep.2022.111103.

The protein organization of a red blood cell

Affiliations

The protein organization of a red blood cell

Wisath Sae-Lee et al. Cell Rep. .

Abstract

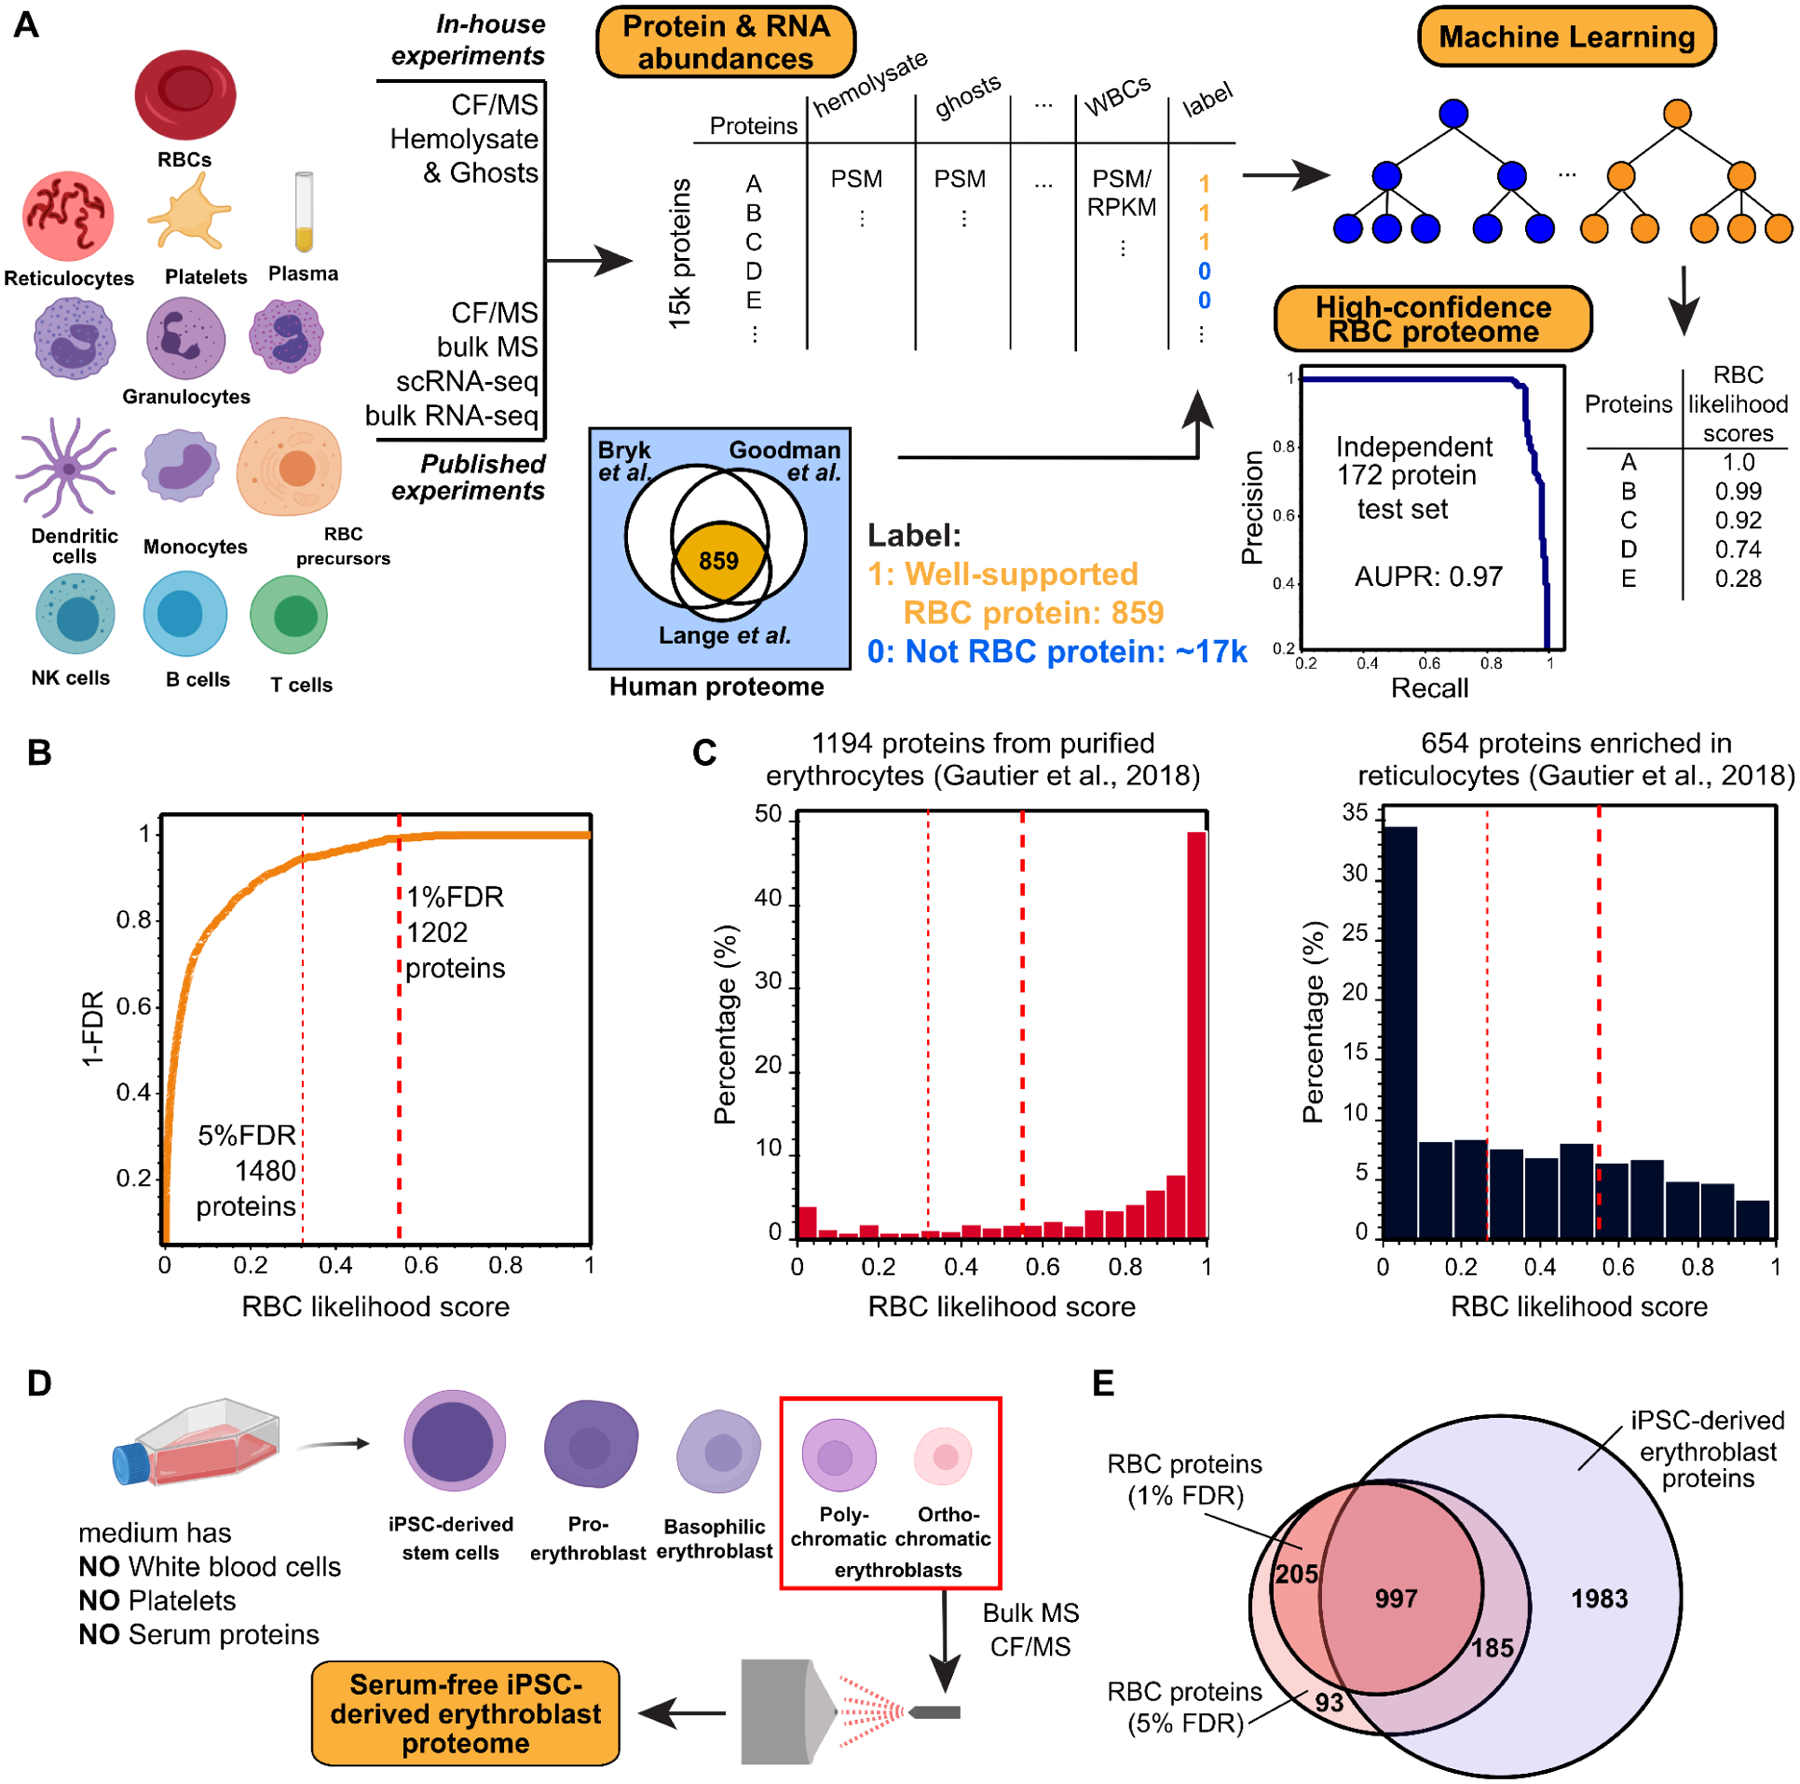
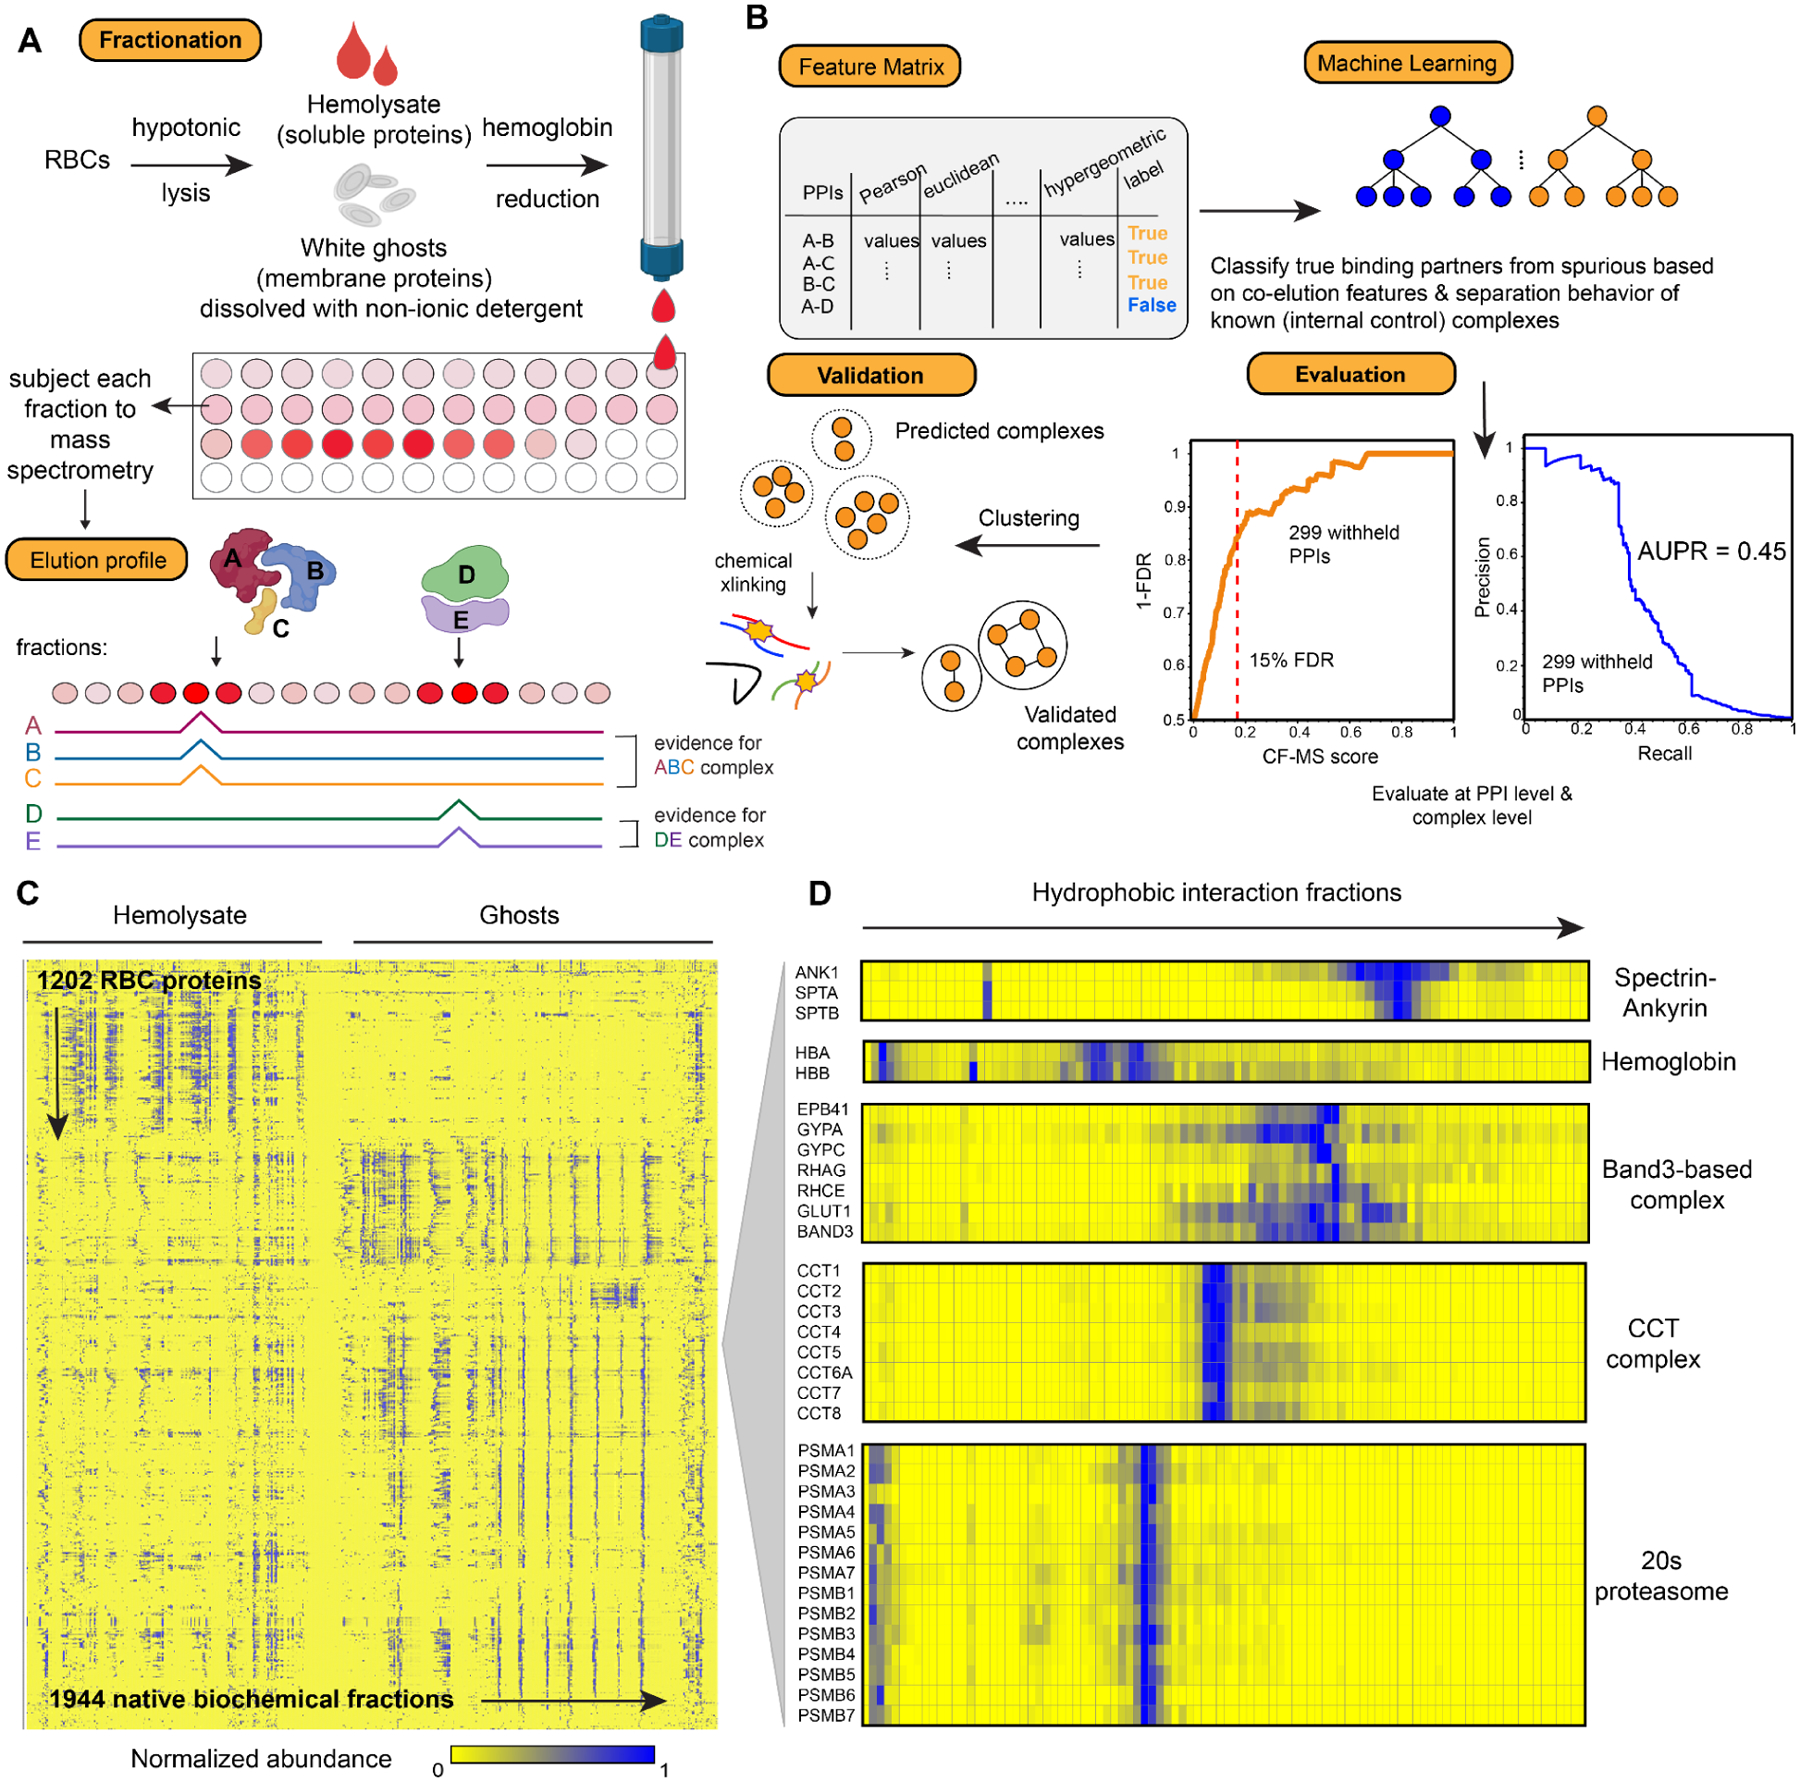
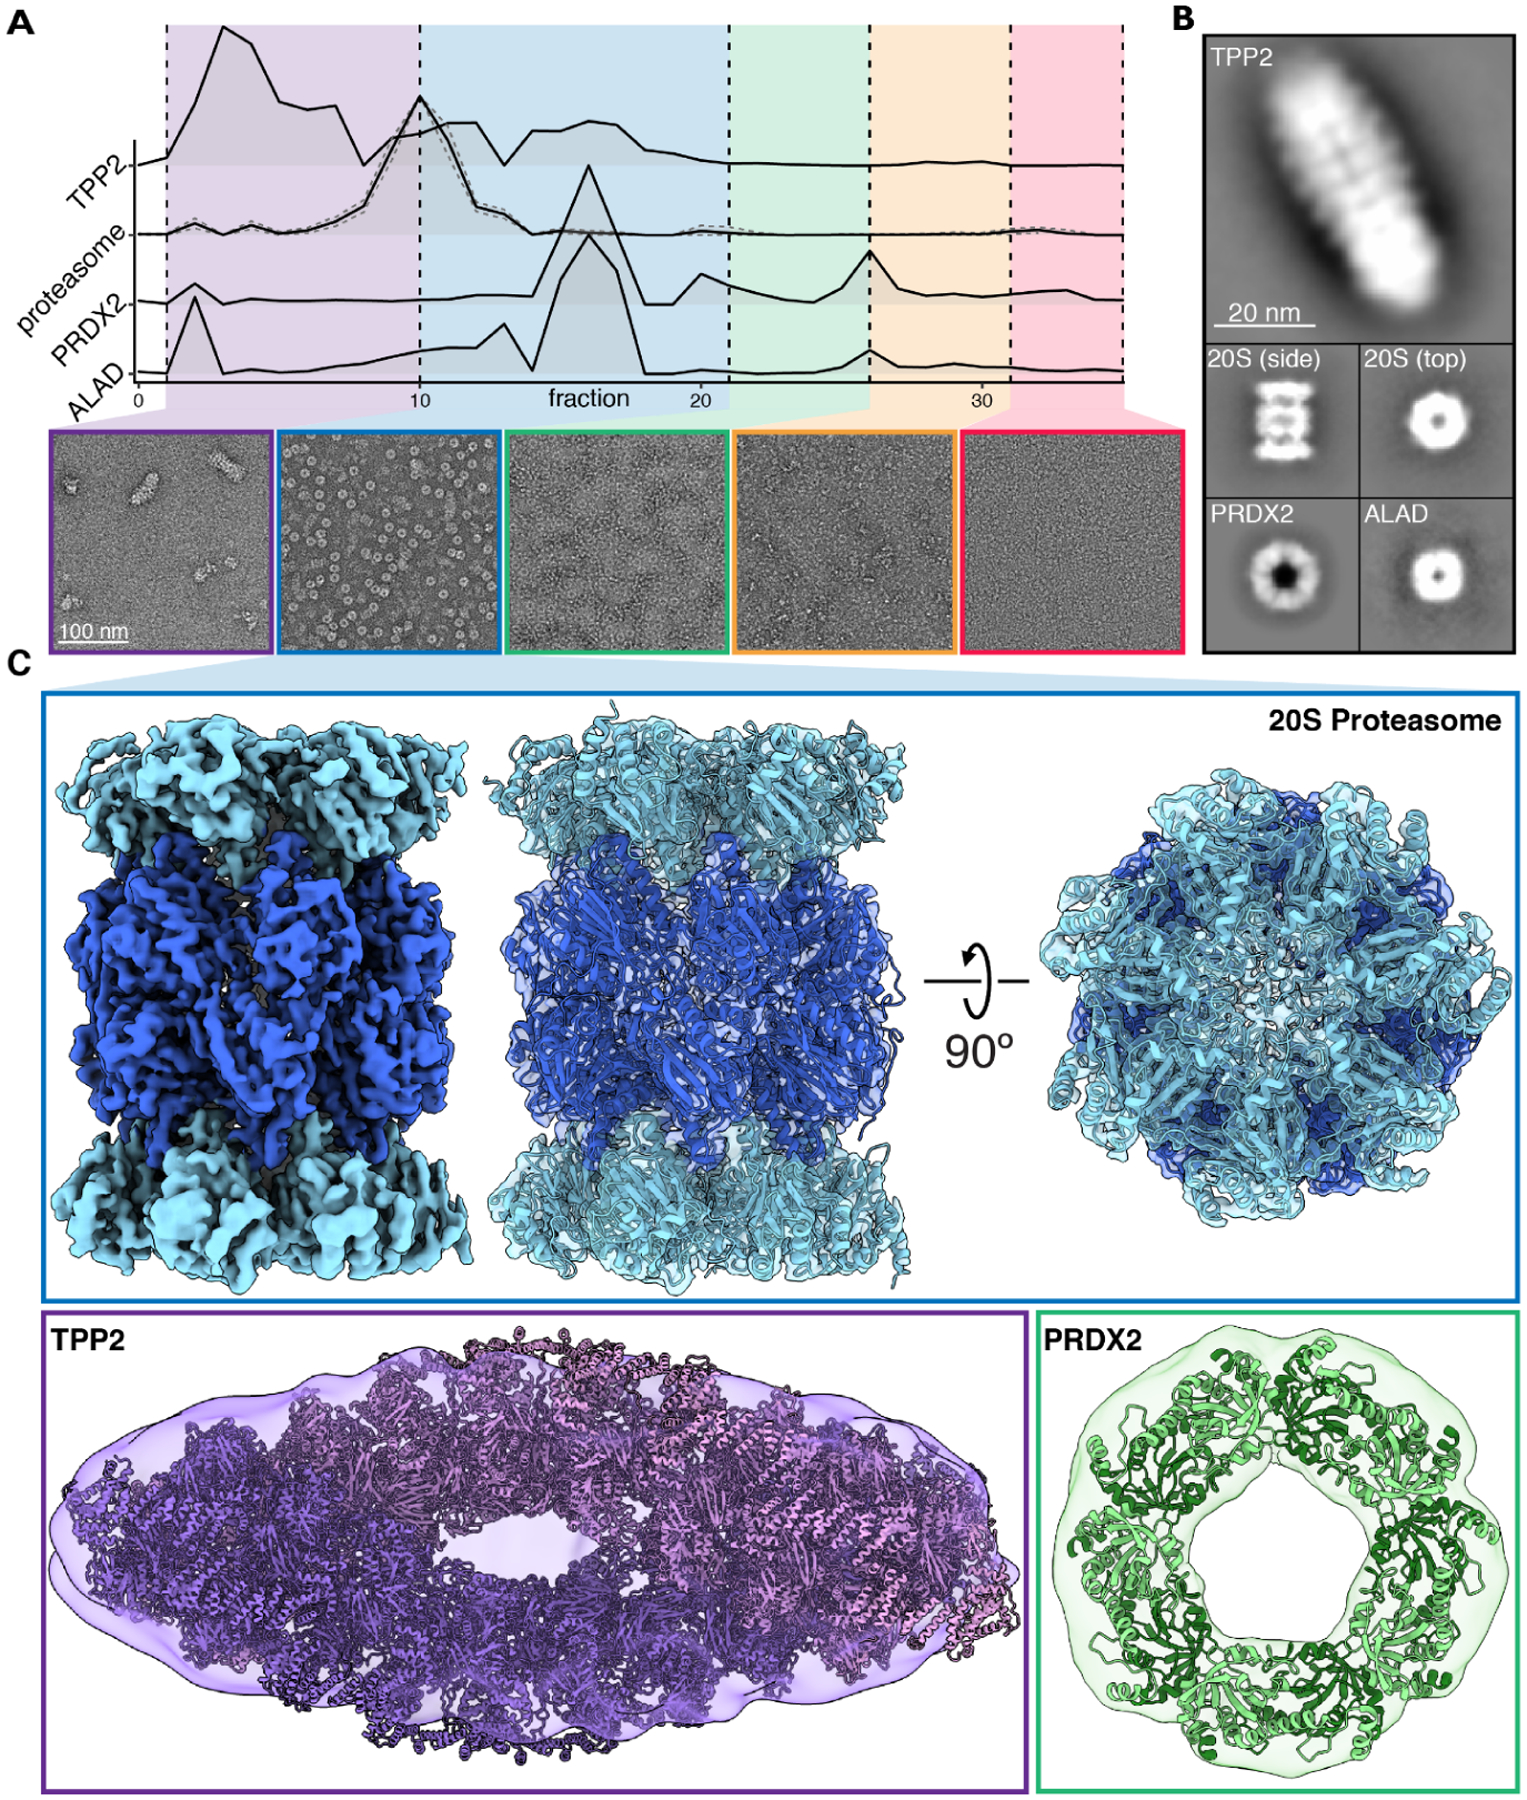
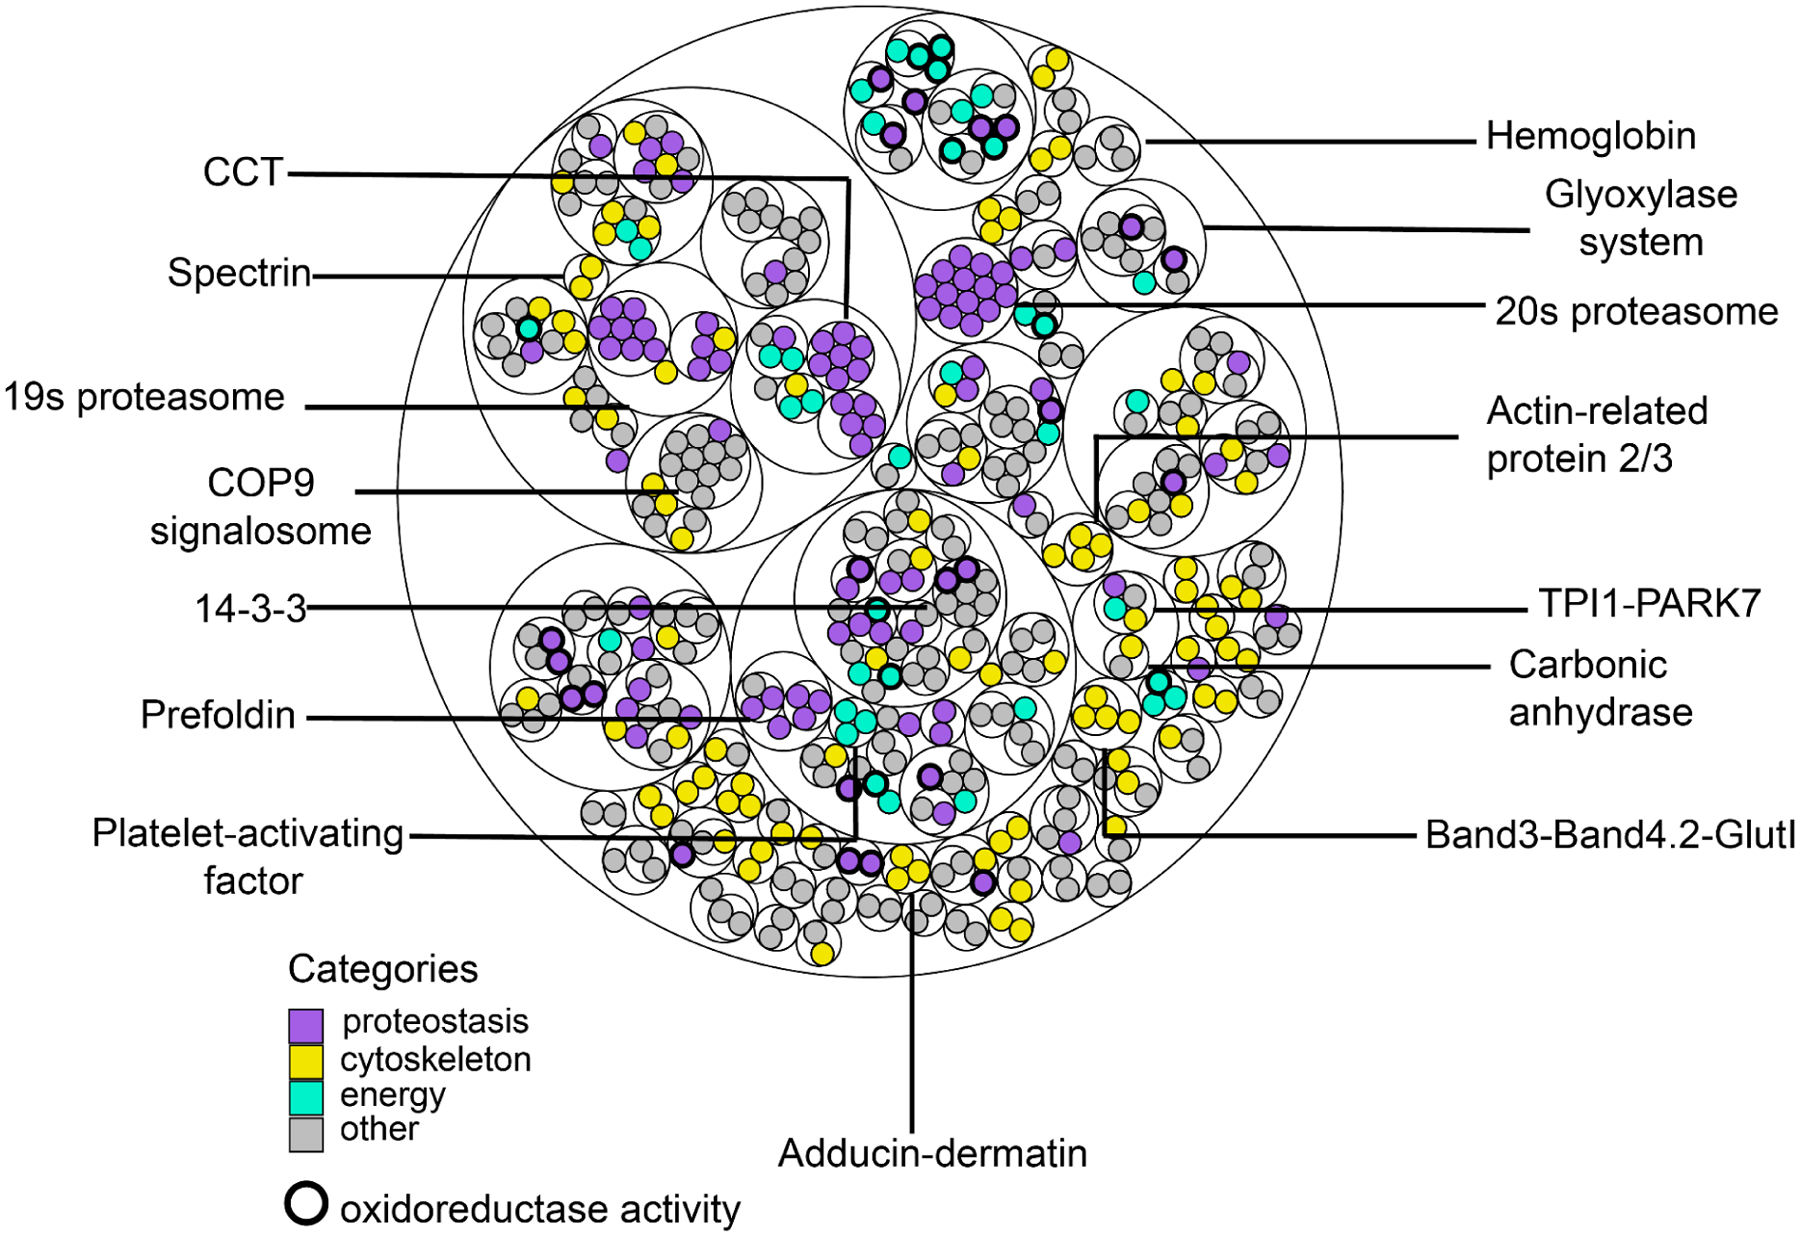
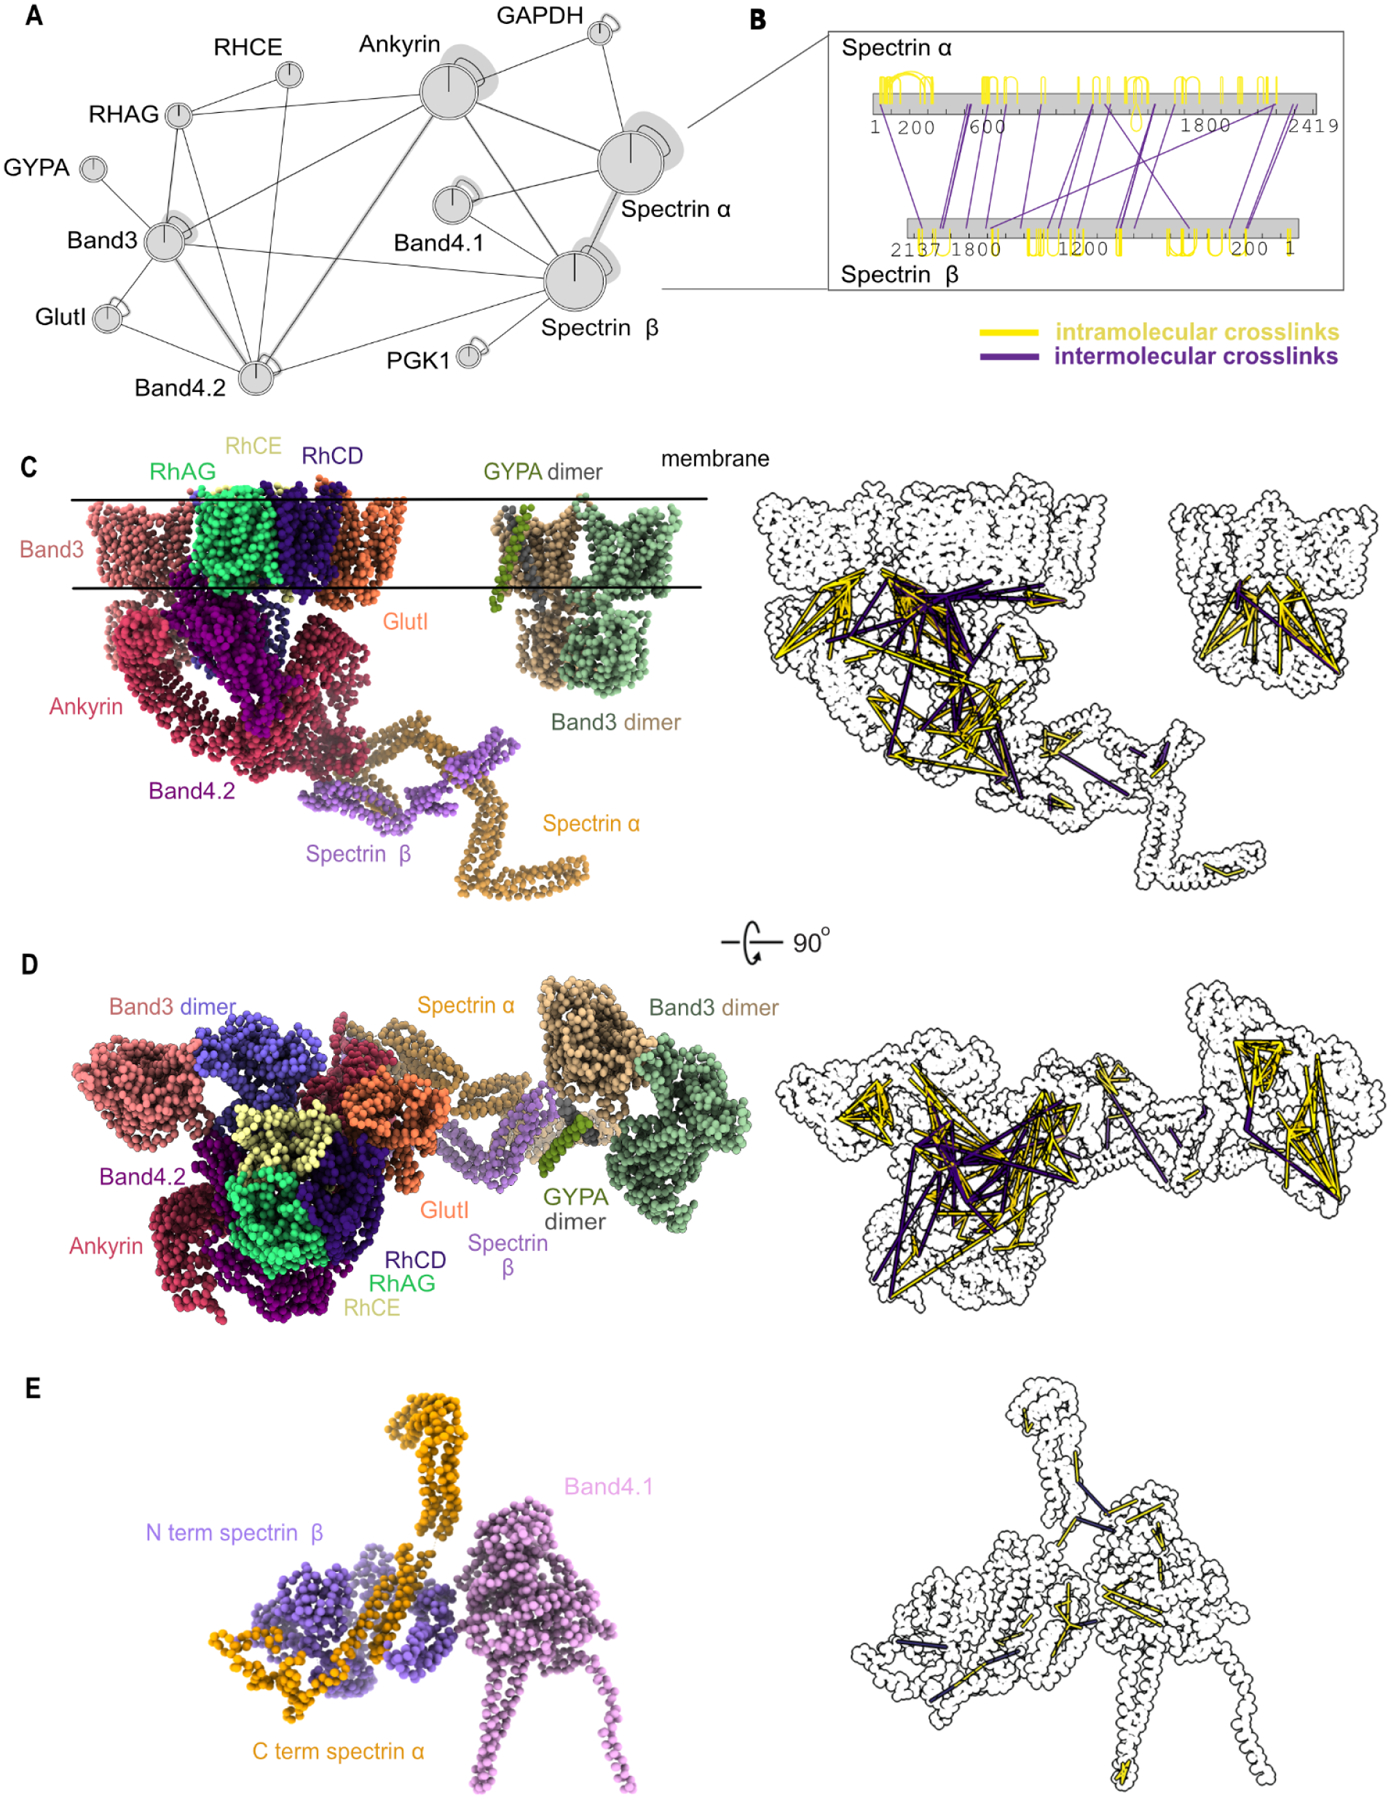
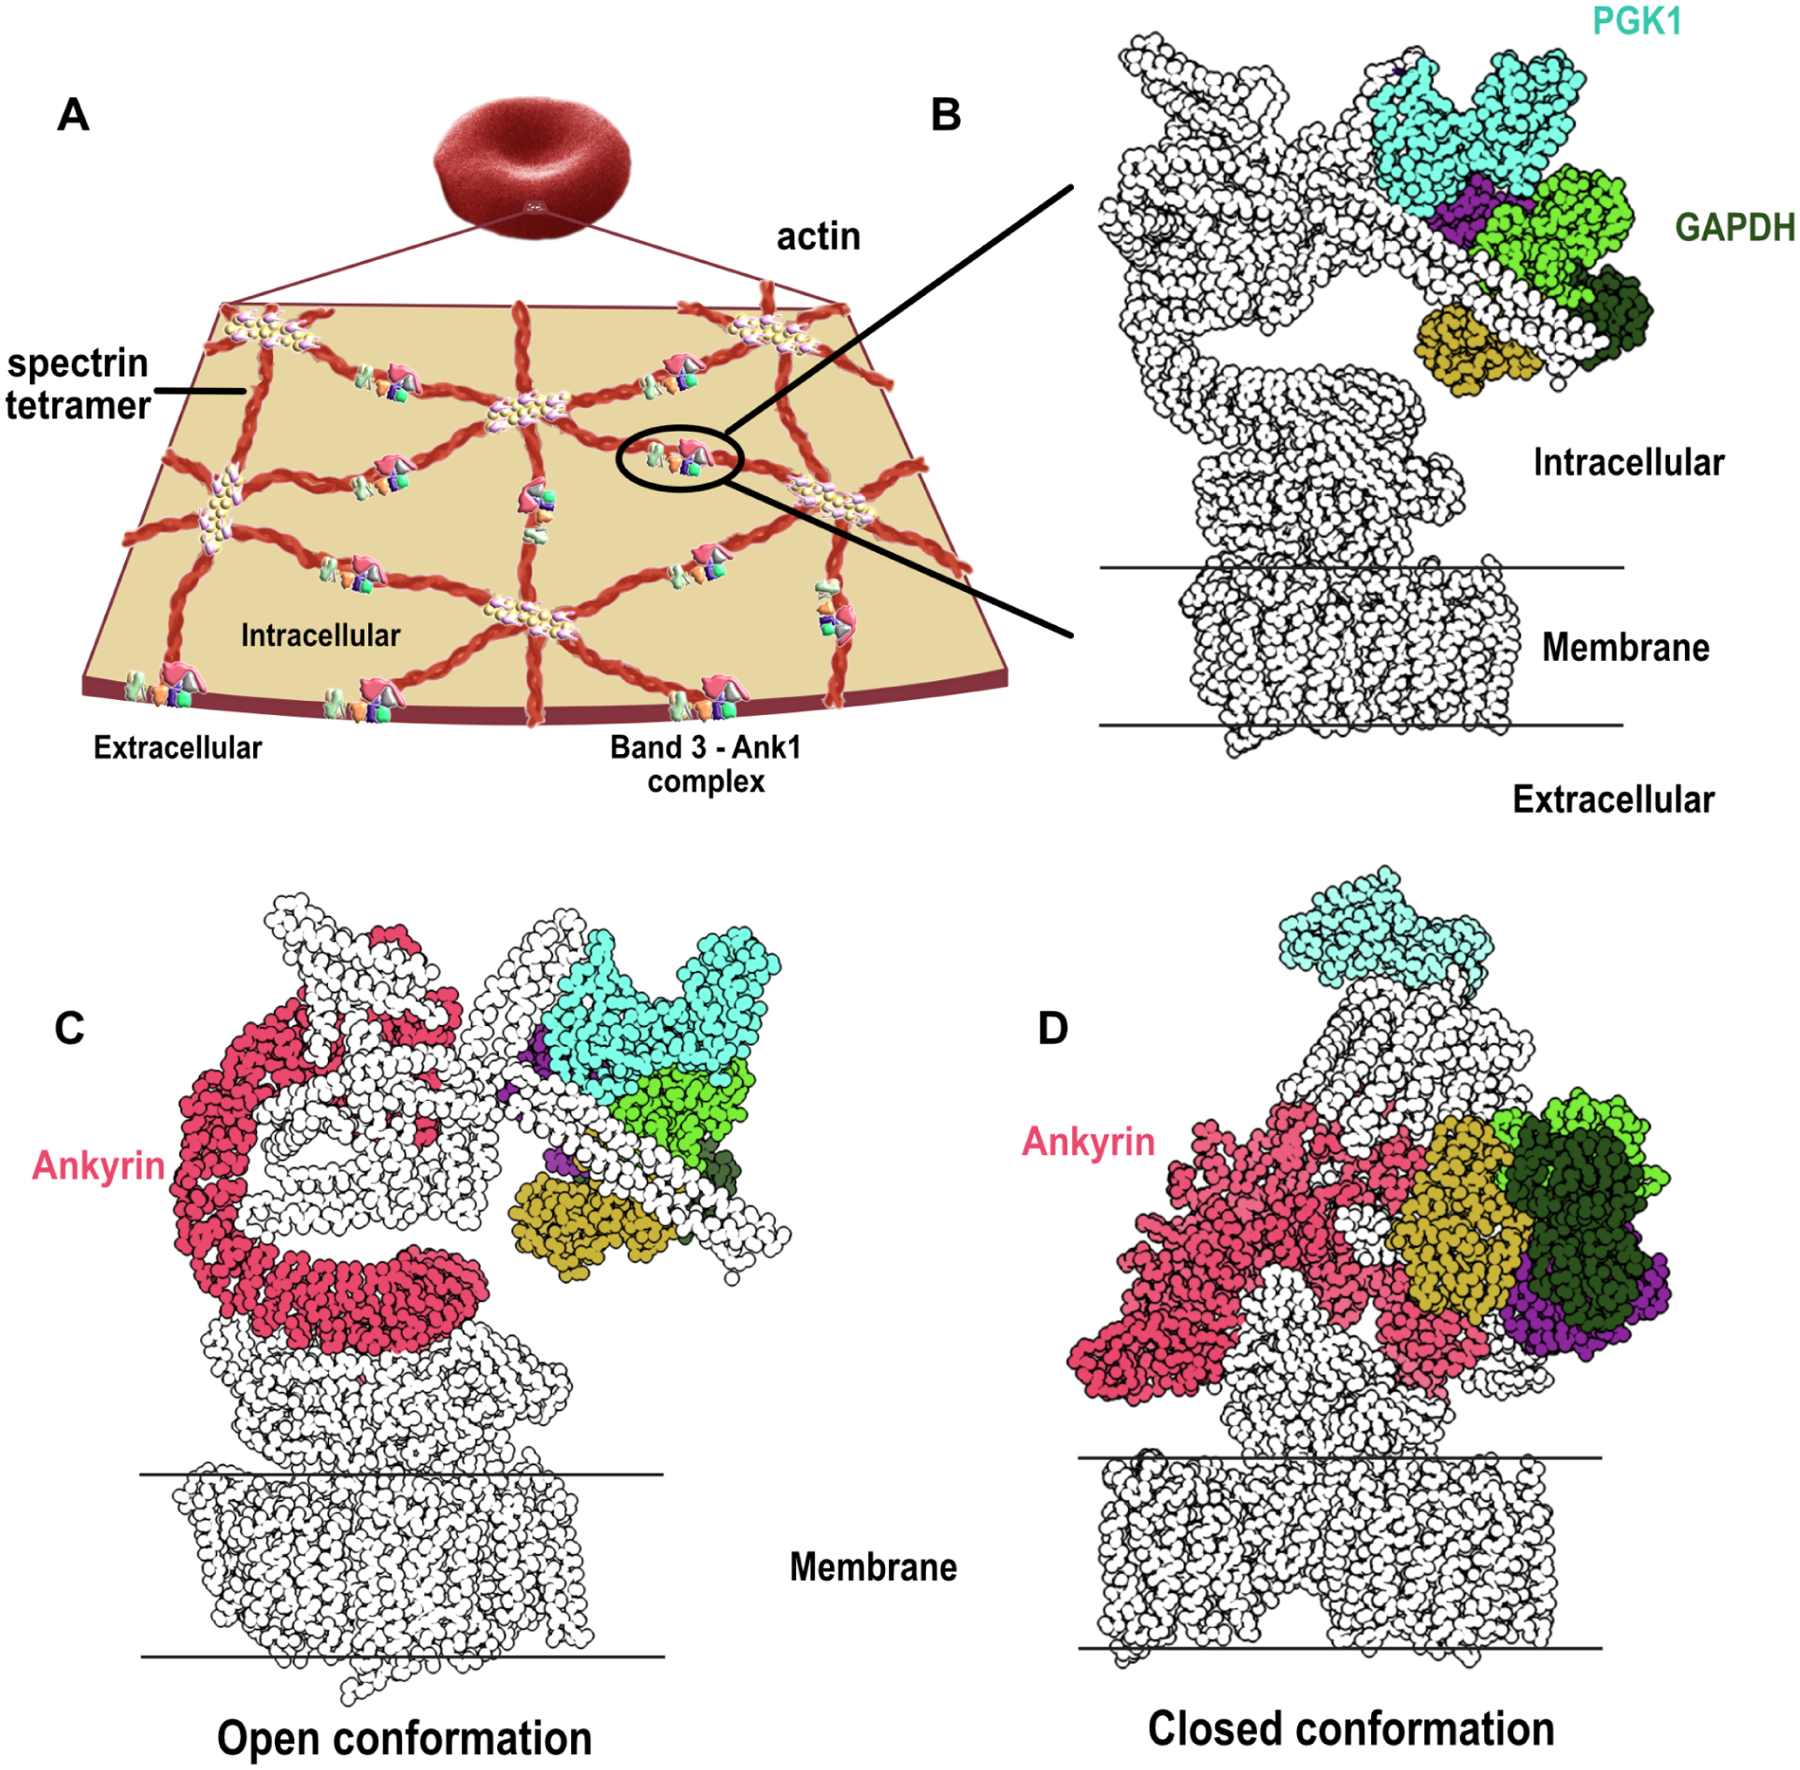
Red blood cells (RBCs) (erythrocytes) are the simplest primary human cells, lacking nuclei and major organelles and instead employing about a thousand proteins to dynamically control cellular function and morphology in response to physiological cues. In this study, we define a canonical RBC proteome and interactome using quantitative mass spectrometry and machine learning. Our data reveal an RBC interactome dominated by protein homeostasis, redox biology, cytoskeletal dynamics, and carbon metabolism. We validate protein complexes through electron microscopy and chemical crosslinking and, with these data, build 3D structural models of the ankyrin/Band 3/Band 4.2 complex that bridges the spectrin cytoskeleton to the RBC membrane. The model suggests spring-like compression of ankyrin may contribute to the characteristic RBC cell shape and flexibility. Taken together, our study provides an in-depth view of the global protein organization of human RBCs and serves as a comprehensive resource for future research.

Keywords: Band 3 complex; CP: Cell biology; erythrocytes; protein complexes; proteomics; red blood cells.


Conflict of interest statement

Declaration of interests The authors declare no competing interests.

Figures

Figure 1.
Figure 1.. Defining the canonical red blood cell (RBC) proteome with high accuracy from a synthesis of protein mass spectrometry and mRNA expression data.
(A) Measured protein and RNA abundances from diverse blood cell types and plasma were used as features for a machine learning classifier to assign confidence scores for proteins whether they belong to the RBCs or rather contaminants contributed by other cells or plasma. The classifier showed high precision and recall (area under the recall-precision curve (AUPR) = 0.97) as assessed on a 172 protein set withheld from the training. Cell images created with Biorender.com. (B) Applying the classifier and thresholding at a 1% false discovery rate (FDR), we observe the canonical RBC proteome to comprise 1,202 proteins. (C) The resulting high confidence RBC proteins are highly concordant with proteins previously identified from purified erythrocytes (Gautier et al., 2018). In contrast, the 1% FDR proteome notably excludes proteins known to be strongly enriched in reticulocytes (Gautier et al., 2018). (D) To further assess the potential for proteins to be contributed from other blood cells or serum, we differentiated iPSC cells into polychromatic and orthochromatic erythroblasts in serum-free medium lacking white blood cells, platelets, and serum proteins, then analyzed the erythroblast proteome using mass spectrometry. (E) A large majority of high confidence RBC proteins at both the 1% and 5% FDR level (1,202 proteins in total) were also detectable in erythroblasts, consistent with our expectation that mature RBC proteins should generally be detectable in a relevant precursor cell population.
Figure 2.
Figure 2.. Overview of the integrative Co-Fractionation / Mass Spectrometry (CF-MS) workflow used to determine stable RBC protein complexes.
(A) Hemolysate and white ghosts are chromatographically separated and the proteins in each fraction are identified by mass spectrometry. Elution profiles for each protein are graphically represented as ridgelines across multiple separation experiments. Cell/protein complexes images created with Biorender.com. (B) Different measures of correlation between each pair of proteins are used to construct a feature matrix for machine learning, which computes a score (CF-MS score) indicating how likely the interaction between two proteins would be in RBCs. The classifier showed good precision and recall (area under the recall-precision curve (AUPR) = 0.45) as assessed on 299 PPIs withheld from the training. Further validations were achieved through crosslinking mass spectrometry and direct visualization by electron microscopy. (C) Heat map of the full dataset of abundance measurements for each of the 1,202 RBC proteins across all fractionations of hemolysate and white ghosts. Blue indicates non-zero signal. (D) Enlarged portions of (C) showing examples of strong co-elution observed for subunits (gene names on left) of five well-known protein complexes in RBCs (complex names on right). Color intensity (blue is positive signal) depicts abundances for each protein from a representative hydrophobic interaction chromatography experiment (labeled on top) out of the 30 total separations.
Figure 3.
Figure 3.. Validation of the CF-MS workflow using electron microscopy confirms intact multi-protein complexes.
(A) Hemolysate from size exclusion chromatography was partitioned into five groups and visualized with negative stain EM. Elution profiles from corresponding mass spectrometry data were used to assist in identifying abundant protein assemblies. (B) Reference-free 2D class averages of four protein complexes spanning ~220 – 5,000 kDa were identified in hemolysate. (C) Cryo-EM reconstruction of the 20S proteasome. Negative stain structures of TPP2 and PRDX2 along with docking of their corresponding atomic structures PDB 3LXU (Chuang et al., 2010) and PDB 1QMV (Schröder et al., 2000), respectively.
Figure 4.
Figure 4.. A map of the primary RBC multiprotein complexes.
Thin circles show the clustering hierarchy of protein-protein interactions into complexes for each of 3 clustering thresholds (see the Zenodo data repository for complex memberships and annotations). Proteins (filled circles) are colored by broad biological categories (analyzed using the DAVID annotation tool); bold outlines denote proteins with oxidoreductase activity.
Figure 5.
Figure 5.. Chemical crosslinks confirm mapped interactions and constrain 3D modeling of membrane/cytoskeletal complexes.
(A) Network plot represents crosslinked interactions among proteins (shown as gene names) in RBC cytoskeletal complexes. Line between each node indicates detected crosslink(s). Shaded lines indicate dense crosslinking. (B) Bar plot shows extensive crosslinks between spectrin alpha and beta supporting a head-to-tail conformation. Numbers under each bar indicate the amino acid position on each protein. Yellow line indicates intramolecular crosslinks and purple line indicates intermolecular crosslinks. (C)Side view of integrative structure of band 3-Ank1 complex and band 3-GYPA complex. Our model suggests that GlutI competes with the Rh proteins for binding with band 3 and band 4.2. The outline figure on the right shows intramolecular and intermolecular crosslinks that are overlaid onto the structure. (D)Top view of integrative structure of the band 3-Ank1 complex and band 3-GYPA complex. (E) Integrative structure of band 4.1-spectrin complex. Six of these complexes are proposed to link spectrin heterodimers with actin (Lux, 2016).
Figure 6.
Figure 6.. Reconstructions of band 3-Ank1-accessory protein complexes by integrative 3D modeling suggest Ank1 compression links the membrane to the cytoskeleton.
(A) An overview of the cytoskeletal network supporting the membrane of RBC. A pseudohexagonal network of spectrin heterotetramer underlies the membrane and is anchored to the membrane by the band 3-Ank1 complex. The tetramer is attached to actin on the other end through the association of band 4.1, actin, spectrin and other proteins. An actin polymer can interact with 6 spectrin tetramers through band 4.1 (Lux, 2016) (adapted with permission from (Goodman, 2020)). (B) Glycolytic enzymes such as GAPDH and PGK1 are anchored to the band 3-Ank1 complex which can accommodate these enzymes while ANK1 adopts either open or closed conformations (see Zenodo repository (IMP_supplemt_figures) for more details). (C) Ank1 in an open form in the band 3-Ank1 complex. Ank1, GAPDH, and PGK1 are colored. (D) Roughly a third of observed intramolecular Ank1 crosslinks support it adopting a closed form in situ relative to the extended conformation observed for purified ankyrin (Wang et al., 2014), suggesting that Ank1 is capable of adopting either open or closed conformations. (see Zenodo repository (IMP_supplemt_figures) for more details).

References

    1. Adams PD, Grosse-Kunstleve RW, Hung L-W, Ioerger TR, McCoy AJ, Moriarty NW, Read RJ, Sacchettini JC, Sauter NK, and Terwilliger TC (2002). PHENIX: building new software for automated crystallographic structure determination. Acta Crystallogr. D Biol. Crystallogr 58, 1948–1954. 10.1107/S0907444902016657. - DOI - PubMed
    1. Alvarez-Castelao B, and Castaño JG (2005). Mechanism of direct degradation of IκBα by 20S proteasome. FEBS Lett. 579, 4797–4802. 10.1016/j.febslet.2005.07.060. - DOI - PubMed
    1. Arakawa T, Kobayashi-Yurugi T, Alguel Y, Iwanari H, Hatae H, Iwata M, Abe Y, Hino T, Ikeda-Suno C, Kuma H, et al. (2015). Crystal structure of the anion exchanger domain of human erythrocyte band 3. Science 350, 680–684. 10.1126/science.aaa4335. - DOI - PubMed
    1. Arimura Y, Shih RM, Froom R, and Funabiki H (2021). Structural features of nucleosomes in interphase and metaphase chromosomes. Mol. Cell 81, 4377–4397.e12. 10.1016/j.molcel.2021.08.010. - DOI - PMC - PubMed
    1. Asher G, Bercovich Z, Tsvetkov P, Shaul Y, and Kahana C (2005). 20S proteasomal degradation of ornithine decarboxylase is regulated by NQO1. Mol. Cell 17, 645–655. 10.1016/j.molcel.2005.01.020. - DOI - PubMed

Publication types