. 2022 Jul 19;40(3):111096.
doi: 10.1016/j.celrep.2022.111096.

Pulse labeling reveals the tail end of protein folding by proteome profiling

Affiliations

Pulse labeling reveals the tail end of protein folding by proteome profiling

Mang Zhu et al. Cell Rep. .

Abstract

Accurate and efficient folding of nascent protein sequences into their native states requires support from the protein homeostasis network. Herein we probe which newly translated proteins are thermo-sensitive, making them susceptible to misfolding and aggregation under heat stress using pulse-SILAC mass spectrometry. We find a distinct group of proteins that is highly sensitive to this perturbation when newly synthesized but not once matured. These proteins are abundant and highly structured. Notably, they display a tendency to form β sheet secondary structures, have more complex folding topology, and are enriched for chaperone-binding motifs, suggesting a higher demand for chaperone-assisted folding. These polypeptides are also more often components of stable protein complexes in comparison with other proteins. Combining these findings suggests the existence of a specific subset of proteins in the cell that is particularly vulnerable to misfolding and aggregation following synthesis before reaching the native state.

Keywords: CP: Molecular biology; heat stress; limited proteolysis; misfolding; protein aggregation; protein folding; protein mass spectrometry; proteomics; proteostasis; pulse SILAC; translation.


Conflict of interest statement

Declaration of interests The authors declare no competing interests.

Figures

Figure 1.
Figure 1.. Identification of newly translated proteins that aggregate upon heat stress by pulse SILAC
(A) Schematic of experiment 1 in which proteins are pre-labeled in light (L) SILAC medium prior to a pulse labeling in heavy (H) medium and heat shock (S, supernatant fraction; P, pellet fraction; T, TCL). (B) The graph displays the log2 values of the normalized SILAC ratios that compare the H/L ratios of the proteins in the pellet fraction (P) over the H/L ratios in the TCL (T). Proteins are ranked based on the averaged log2 ratios (green), each gray dot represents one of four replicates if quantified, and the light green shade marks the two standard deviations below and above the mean, which is smoothed over a sliding window length of 50. (C) Volcano plot of log2 values of the normalized SILAC ratios plotted against the −log10 of t test p values. The dotted lines indicate proteins that have a t test p value < 0.05 and at least a 2-fold change.
Figure 2.
Figure 2.. Identification of protein translated during heat shock
(A) Illustration of how partially translated proteins would lead to an N-terminal peptide bias. (B) The graph shows the H/L ratios of peptides of proteins quantified in the pellet fraction in experiment 1 (y axis) that are positioned based on their location in the protein (x axis). Gray points show individual measurement from all four replicates. Colored lines show rolling median ratios with a5% window and 1% increment of each replicate. (C) Schematic of experiment 2 in which proteins are pre-labeled in light (L) SILAC medium prior to a 2-min heat shock followed by pulse labeling in heavy (H) medium. (D) Volcano plot of log2 H/L SILAC ratios values plotted against the –log10 of t test p values. Three biological replicates were analyzed. The dotted lines indicate proteins that have a t test p value < 0.05 and a labeling over two mean absolute deviations (MADs).
Figure 3.
Figure 3.. Newly translated proteins enriched in pellets are distinct from stress granule proteins and only form foci in cells as newly translated proteins
(A) Comparison of data from Zhu et al. (2020) and data from experiment 1. The y axis displays log2 (H/L) of proteins that remain in supernatant after heat shock of heavy-labeled cells (H) versus control light-labeled cells (L) (proteins with low ratios are depleted from the supernatant fraction) and x axis displays the log2 (PH/L/TH/L) of proteins in the pellet in experiment 1. Green dots show newly translated proteins enriched in pellet fraction; blue dots show stress granule proteins identified in Zhu et al. (2020). (B) Illustration of the tandem fluorescent protein timer construct and expected phenotype of different proteins under heat shock when newly translated. (C) Representative images of cells expressing indicated proteins fused to the tandem fluorescent protein timer. Protein expression was induced for 10 min and cells treated with or without 15-min heat shock at 45°C. Solid arrowheads show selected foci; hollow arrowheads mark the absence of localization in the selected foci. The percentage number indicates the fraction of cells with at least one focus (n = 88 in Rpl12B and n = 130 in Ola1).
Figure 4.
Figure 4.. Identification of ntSP and ntCP proteins
(A) Schematic of experiment 3 in which proteins are pre-labeled in light (L) SILAC medium prior to a pulse labeling in heavy (H) medium followed by heat shock, or medium (M) media (S, supernatant fraction; P, pellet fraction; T, TCL). (B) Volcano plot of log2 values of the normalized SILAC ratios (log2 [HP/MP]/[HT/MT]) plotted against the −log10 of t test p values. Four biological replicates were analyzed. The horizontal dotted line indicates a t test p value of 0.05 and the vertical dotted line indicates a fold change of 2. ntSP proteins are depicted in green and ntCP proteins shown in darker gray. (C) Schematic of the validation experiment to compare sedimentation of long-lived (LL) and newly translated (NT) proteins. (D) Western blots of the TCL (T), supernatant (S), and pellet (P) fractions of 3HA-tagged Tpi1, Rpl12, Hri1 and Arg1, and Pgk1. Uncropped blots are available in Figure S4D.
Figure 5.
Figure 5.. Protein feature analysis of ntSP and ntCP proteins
(A–C, E, and F) Boxplots comparing distributions of ntSP, ntCP, control proteins (ctrl), and proteome (PME). The following analyses are shown: the sum of residues within a Pfam domain normalized by protein length (A), percentage solvent exposed (B), percentage predicted disordered (C), protein half-life in hours (E), and protein abundance (F); p values (Hochberg adjusted Wilcoxon test) are shown and/or reported in Table S4. (D) Gene Ontology (GO) analysis of ntSP proteins. Circle size and number indicate the number of proteins within each GO term and placed according to their fold enrichment and significance by Fisher test.
Figure 6.
Figure 6.. Structural feature analysis of ntSP and ntCP proteins
(A and B) Boxplot comparing percentage β-predicted sheet (A) and contact order distributions (B) of ntSP, ntCP, control proteins (ctrl), and PME. (C) Comparison of the proportion of indicated proteins with lasso-like self-entanglements. (D) Comparison of proportion of protein with at least one binding site for Ssb (left) and TRiC (right) in ntSP proteins (green) and PME based on a study from Dr. Frydman and colleagues (Stein et al., 2019). (E) Comparison of the proportions of proteins in stable complexes within ntSP proteins and PME. n and corrected p values (Wilcoxon test in A and B, permutation test in C, and Fisher test in D and E) are shown and reported in Table S4.
Figure 7.
Figure 7.. Analysis of the limited proteolysis experiment
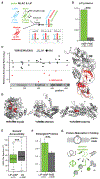
(A) Schematic of the LiP experiment combined with pulse SILAC. The lysate derived from pulsed SILAC cells (15 min in heavy SILAC medium; H) is first treated with proteinase K (PK) in native conditions and then denatured for a trypsin digest. For comparison, medium SILAC-labeled cells (M) are only subjected to the trypsin digest. Folded regions are not accessible to PK (i). Regions that require more time for folding are expected to be only PK sensitive in the heavy channel (iii) but not in the light channel (ii). (B) Proportions of ntSP proteins and PME that have at least two PK-sensitive peptides in NT proteins. (C) On the left, each quantified peptide for the elongation factor 2 protein encoded by the EFT1 and EFT2 genes is placed according to its location in the sequence. For each peptide, the log2 of the normalized H/M (circles) and L/M (triangles) ratios are shown. Each ratio is normalized using the ratio in the reference sample with no PK treatment. Peptides that display higher PK sensitivity (over a 2-fold threshold) are depicted in red. On the right, the regions spanning between these peptides are depicted in red in the structure (PDB: 6GQB). (D) Selected PK-sensitive peptides in NT proteins are depicted in red in the structure of the cytosolic and endoplasmic reticulum (ER)-associated Oye2 NADPH oxidoreductase (343–349, 350–360), the cytosolic Shm2 serine hydroxymethyltransferase (188–198), and the mitochondriai Ade13 adenylosuccinate lyase (132–138). (E) Solvent-accessible surface area (SASA) distribution of LiP peptides from the 53 ntSP proteins identified in the pulse-SILAC analysis compared with all tryptic peptides identified in the reference sample with no PK treatment in this experiment. (F) Proportion of ntSP proteins with at least two LiP peptides and PME that have lasso-like self-entanglements. n and corrected p values (Fisher test in B, Wilcoxon test in E, and permutation test in D) are shown and reported in Table S4. (G) We propose a model in which a specific cohort of proteins in the cell require more time following synthesis to reach their native states, in which they remain soluble following heat stress. The thermo-sensitivity of ntSP is potentially due to a slower folding process or kinetically trapped folding intermediates caused by specific features and/or more complex structure topology (i), a possible higher dependence on protein chaperone (ii), and/or the reliance on binding partners for stability (iii).

Similar articles

Cited by

References

    1. Agozzino L, and Dill KA, (2018). Protein evolution speed depends on its stability and abundance and on chaperone concentrations. Proc. Natl. Acad. Sci. USA 115, 9092–9097. 10.1073/pnas.1810194115. - DOI - PMC - PubMed
    1. Altschul SF, Gish W, Miller W, Myers EW, and Lipman DJ, (1990). Basic local alignment search tool. J. Mol. Biol 215, 403–410. 10.1016/s0022-2836(05)80360-2. - DOI - PubMed
    1. Baiesi M, Orlandini E, Seno F, and Trovato A, (2019). Sequence and structural patterns detected in entangled proteins reveal the importance of co-translational folding. Sci. Rep 9, 8426. 10.1038/s41598-019-44928-3. - DOI - PMC - PubMed
    1. Bauer DF, (1972). Constructing confidence sets using rank statistics. J. Am. Stat. Assoc 67, 687–690. 10.1080/01621459.1972.10481279. - DOI
    1. Beck S, Michalski A, Raether O, Lubeck M, Kaspar S, Goedecke N, Baessmann C, Hornburg D, Meier F, Paron I, et al. (2015). The impact II, a very high-resolution quadrupole time-of-flight instrument (QTOF) for deep shotgun proteomics. Mol. Cell. Proteomics 14, 2014–2029. 10.1074/mcp.m114.047407. - DOI - PMC - PubMed

Publication types