. 2022 Jul 19;40(3):111092.
doi: 10.1016/j.celrep.2022.111092.

Stress-induced perturbations in intracellular amino acids reprogram mRNA translation in osmoadaptation independently of the ISR

Affiliations

Stress-induced perturbations in intracellular amino acids reprogram mRNA translation in osmoadaptation independently of the ISR

Dawid Krokowski et al. Cell Rep. .

Abstract

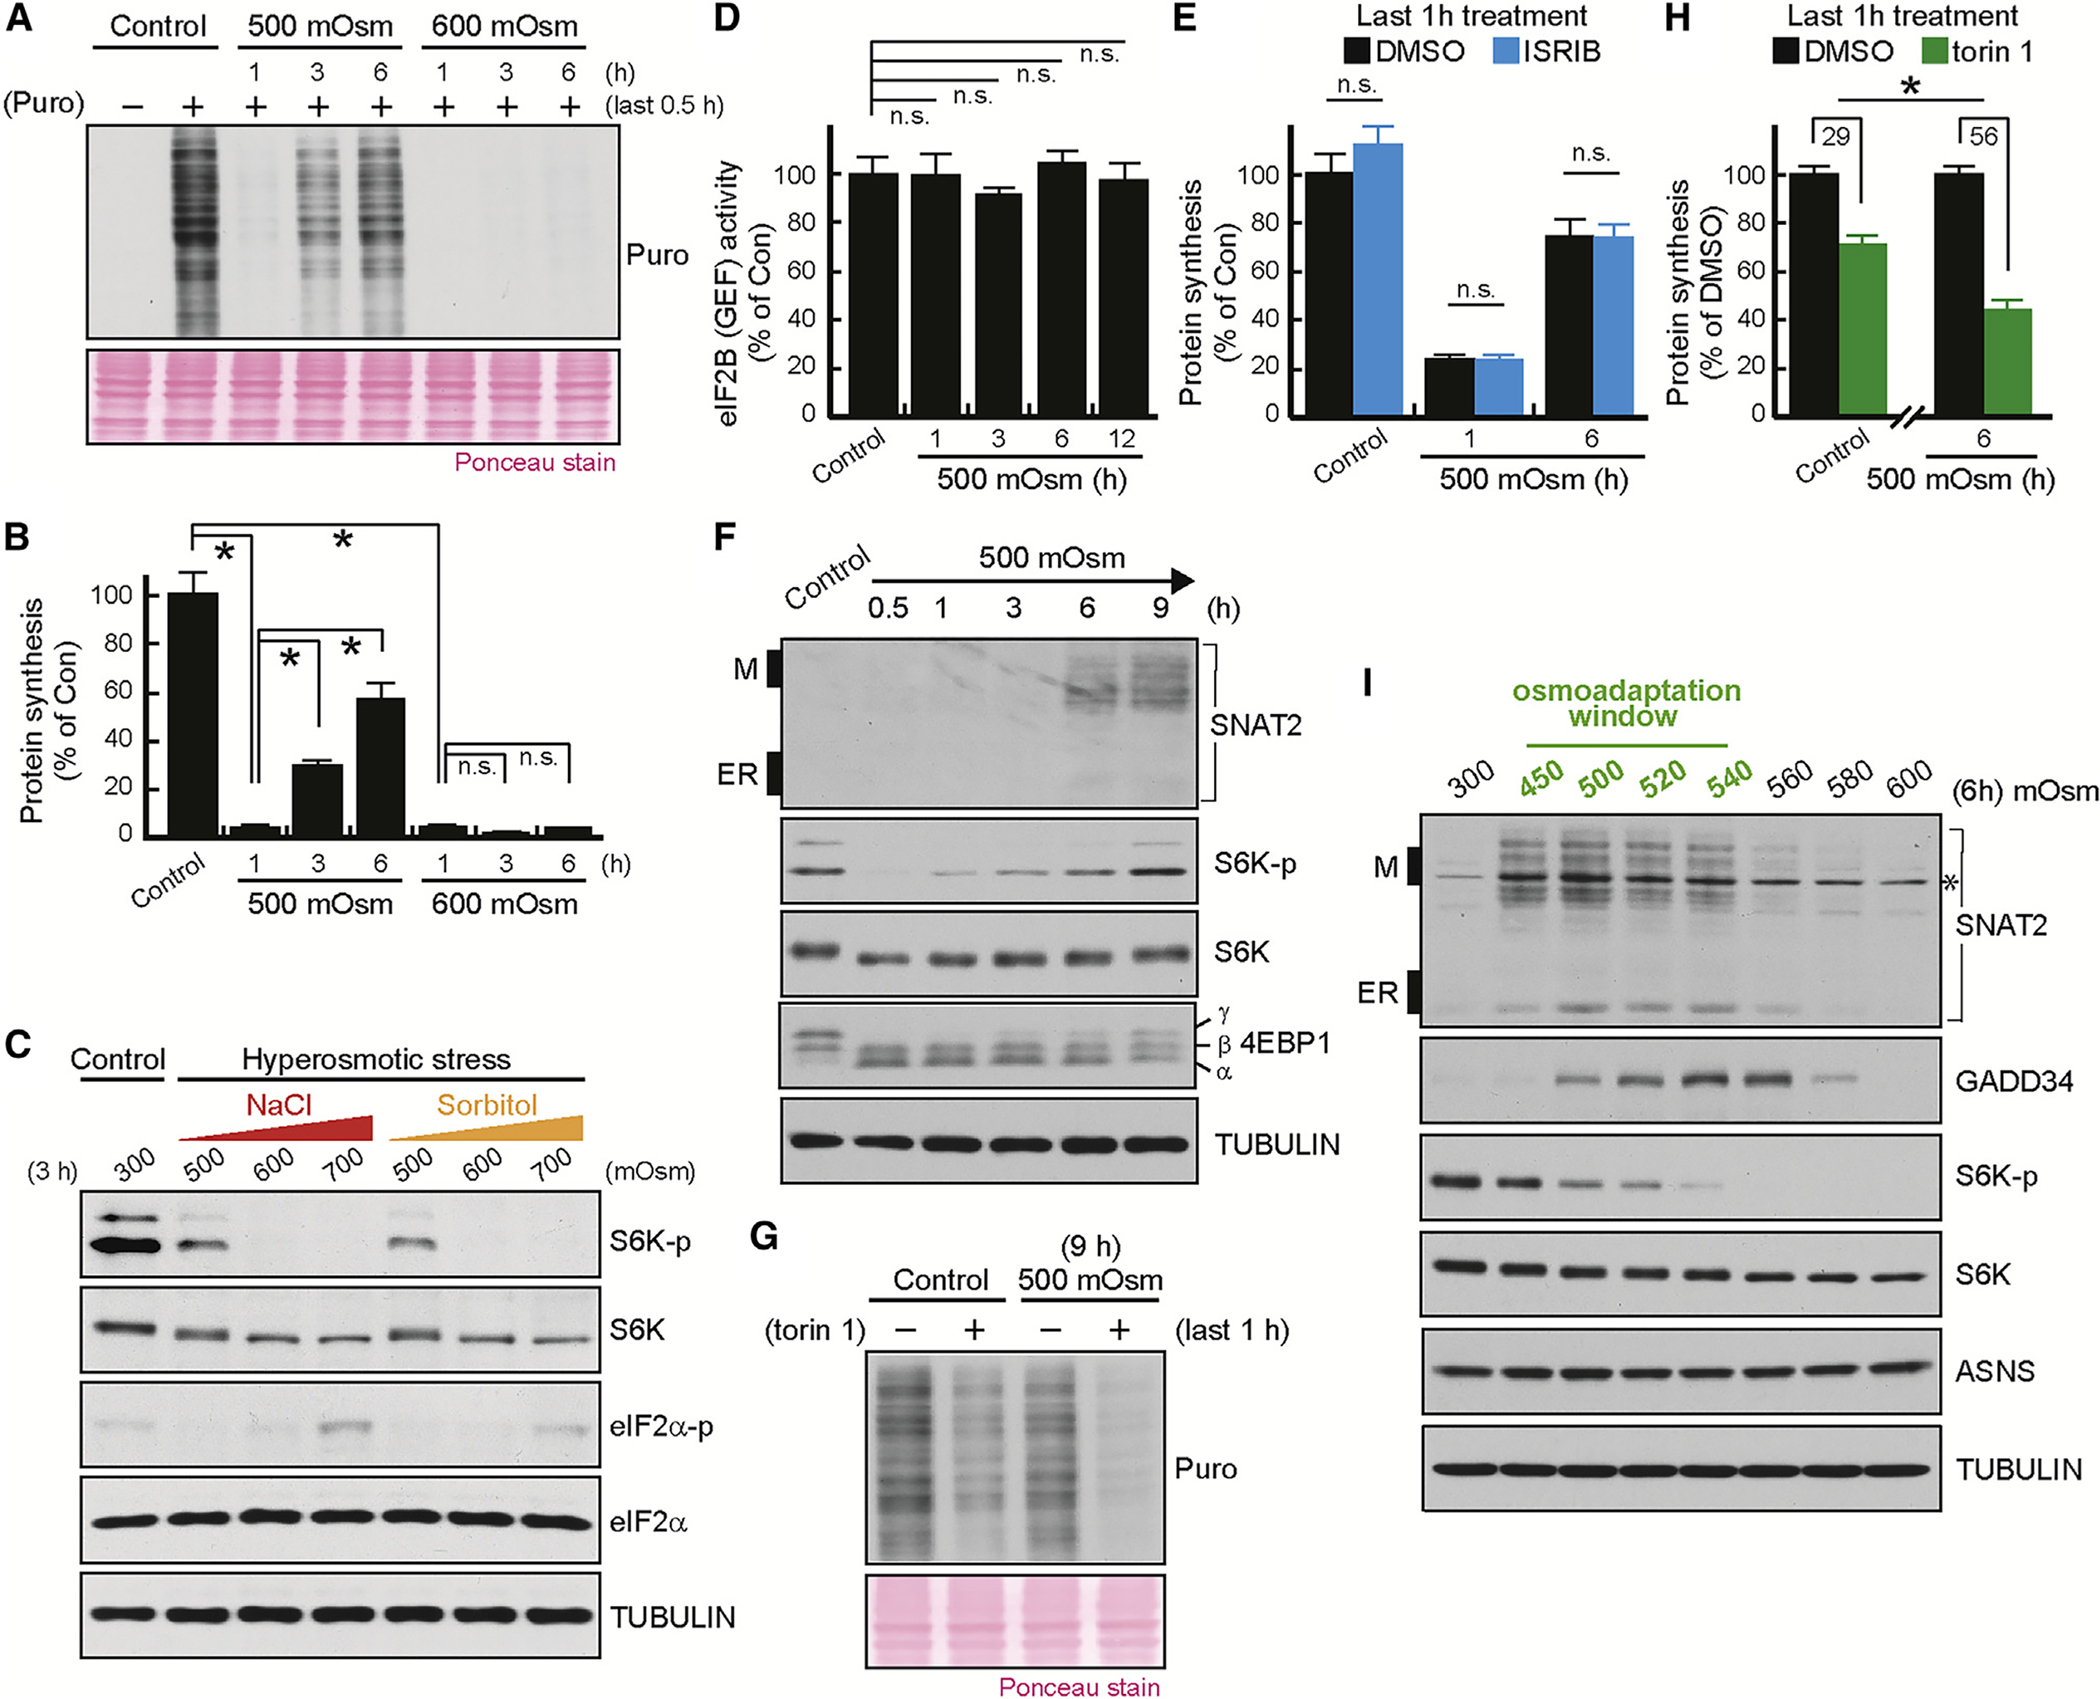
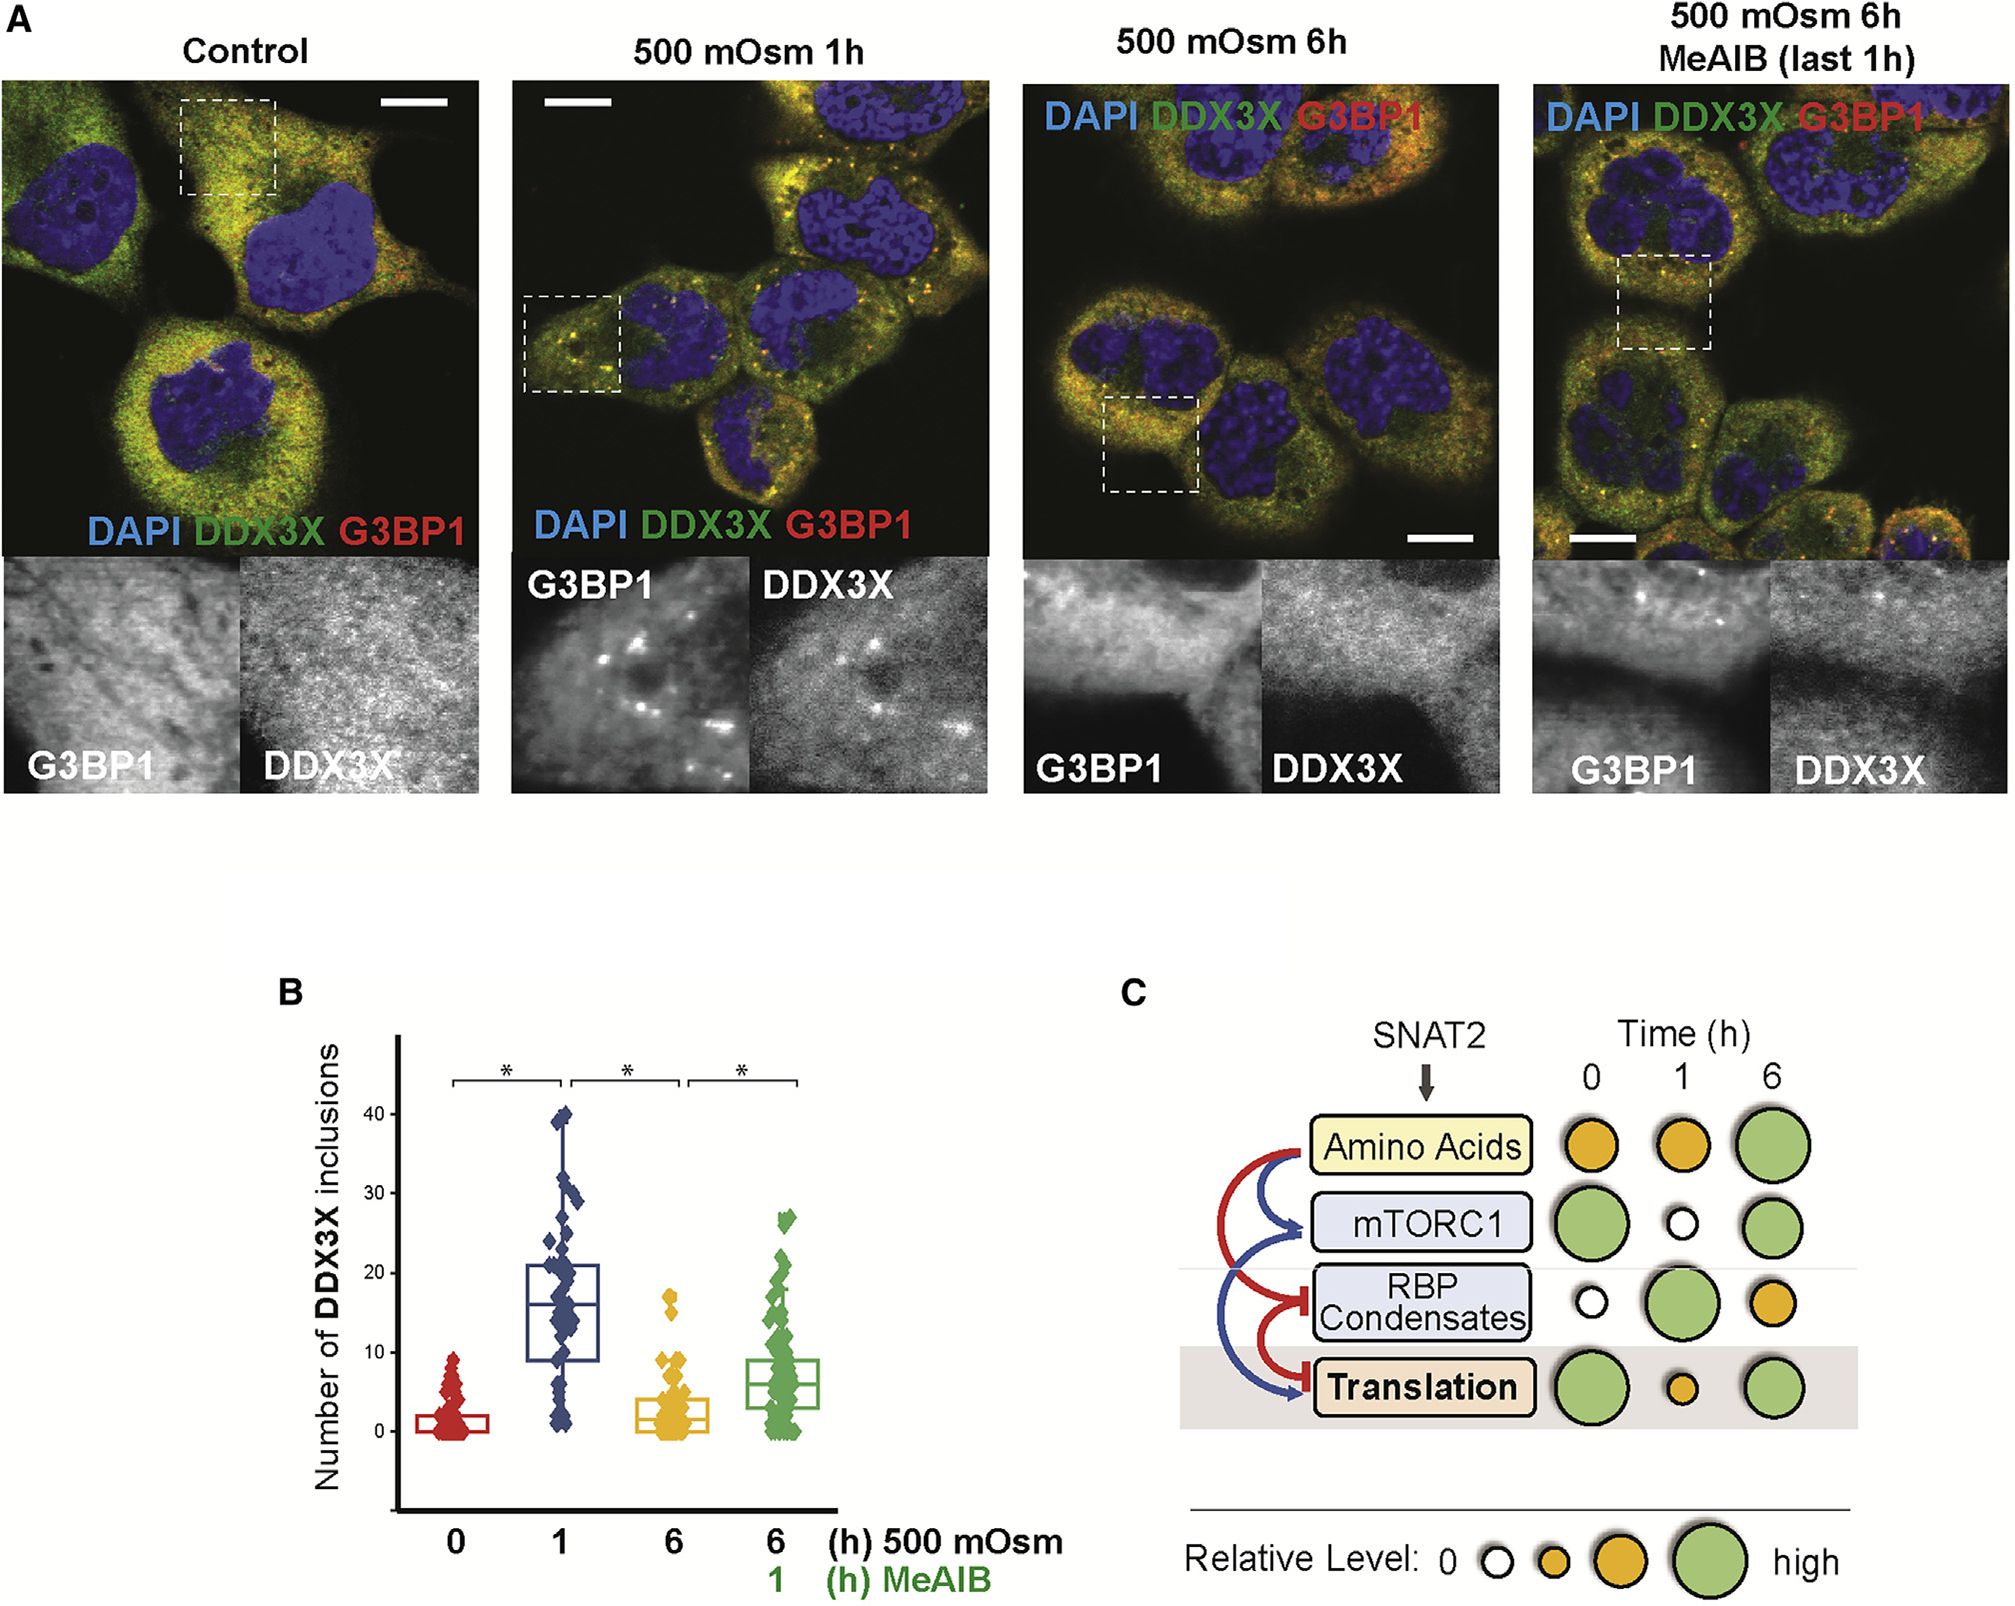
The integrated stress response (ISR) plays a pivotal role in adaptation of translation machinery to cellular stress. Here, we demonstrate an ISR-independent osmoadaptation mechanism involving reprogramming of translation via coordinated but independent actions of mTOR and plasma membrane amino acid transporter SNAT2. This biphasic response entails reduced global protein synthesis and mTOR signaling followed by translation of SNAT2. Induction of SNAT2 leads to accumulation of amino acids and reactivation of mTOR and global protein synthesis, paralleled by partial reversal of the early-phase, stress-induced translatome. We propose SNAT2 functions as a molecular switch between inhibition of protein synthesis and establishment of an osmoadaptive translation program involving the formation of cytoplasmic condensates of SNAT2-regulated RNA-binding proteins DDX3X and FUS. In summary, we define key roles of SNAT2 in osmotolerance.

Keywords: CP: Molecular biology; amino acids; cytoplasmic condensates; hypertonic stress; mTOR signaling; osmolytes; osmotolerance; translation.


Conflict of interest statement

Declaration of interests The authors declare no competing interests.

Figures

Figure 1.
Figure 1.. Regulation of protein synthesis in corneal epithelial cells exposed to mild hyperosmotic stress involves mTOR but not eIF2α phosphorylation
(A) Protein synthesis rates in cells challenged with 500 and 600 mOsm media (NaCl) measured by puromycin incorporation. (B) Densitometric quantification of (A), n = 3, error bars represent SEM,*p < 0.01; n.s., not significant. (C) Western blot analysis of eIF2α and mTOR signaling pathways in cells challenged with sorbitol or NaCl. (D) GEF activity of eIF2B in cells cultured in 500 mOsm media (NaCl).Error bars represent SEM, n.s., not significant. (E) Protein synthesis rates as measured by incorporation of 35S-labeled Cys/Met in cells exposed to 500 mOsm (NaCl) media in the presence of ISRIB (100 nM) during the last 1 h of treatment, n = 4, error bars represent SEM, *p < 0.01; n.s., not significant. (F and I) Western blot analysis of cells challenged with NaCl. M, mature plasma membrane SNAT2 protein; ER, endoplasmic reticulum intermediate in the maturation process of SNAT2 protein. Asterisk indicates a non-specific protein band. (G) Impact of the mTOR inhibitor torin 1 (100 nM, last 1 h of treatment) on puromycin incorporation during 500 mOsm hyperosmotic stress (NaCl). (H) Protein synthesis measured by 35S-labeled Cys/Met labeling in the presence of mTOR inhibitor torin 1 (10 nM, last 1 h of treatment) with 500 mOsm media (NaCl). Data are normalized to percentage of incorporation in cells without torin 1 treatment, n = 4, error bars represent SEM, *p < 0.01.
Figure 2.
Figure 2.. Contribution of SNAT2 to changes in amino acid uptake during hyperosmotic stress in human corneal epithelial cells
(A–F) NaCl was used to increase osmolarity. (A) Gln uptake during hyperosmotic treatment (500 mOsm) in the presence or absence of MeAIB (5 mM). Error bars represent SEM, p < 0.01; n.s., not significant. (B) Leu uptake for the indicated treatments. MeAIB (5 mM) was added to the media for the last 1 h of treatment. Error bars represent SEM, p < 0.01; n.s., not significant. (C) Schematic representation of the regulation of Gln transporters in the adaptive recovery of mTOR activity. In normal osmolarity, uptake of Gln by ASCT2 provides an efflux substrate for Leu uptake by LAT1. Leu activates mTOR via an amino acid sensing mechanism and promotes protein synthesis. In the early response to increased osmolarity, the activity and levels of ASCT2 decrease and the amino acid sensing mechanism that activates mTOR is attenuated, inhibiting mTOR and protein synthesis. In the late osmoadaptive phase, the amino acid sensing mechanism, mTOR activity, and inhibition of protein synthesis are restored via increased levels of SNAT2. (D) Pro, Gln, and Leu uptake during adaptation to increased osmolarity (500 mOsm) in cells expressing shCon or shRNA (#2) against SNAT2. Error bars represent SEM, p < 0.01; n.s., not significant. (E) Control (shCon) or cells expressing shRNA (#2) against SNAT2 were exposed to increased osmolarity (500 mOsm). Protein synthesis was measured by 35S-labeled Cys/Met incorporation during adaptation to increased osmolarity. In (A), (B), (D), and (E), n = 4–6, error bars represent SEM, *p < 0.01; n.s., not significant. (F) Normalized levels of the indicated amino acids in control cells (shCon) or cells expressing shRNA against SNAT2 (#2) during adaptation to increased osmolarity (500 mOsm). Krebs-Ringer bicarbonate buffer (KRB) treatment for 3 h was used to induce amino acid deficiency as a control. n = 3, error bars represent SEM, *p < 0.01; n.s., not significant.
Figure 3.
Figure 3.. Changes in mRNA translation and abundance mark progression to osmoadaptation
(A) Schematic of conditions for ribosome profiling experiments. (B and C) Scatterplots of RPF versus total mRNA fold changes (average across replicates) comparing the early (1 h 500 mOsm, NaCl versus control; B) and adaptive (6 h 500 mOsm versus 1 h 500 mOsm, NaCl; C) phases. The numbers of mRNAs show changes in translation (upregulated, light red, and downregulated, dark red), buffering, or abundance as determined by anota2seq. Select transcripts encoding osmoadaptive proteins are highlighted. (D) Pie charts of the subset of transcripts identified under individual comparisons (indicated by the rim) and their regulation under a second comparison (indicated by pie slices). The top graph assesses how transcripts whose translation was activated (color of the rim) when comparing 1 h 500 mOsm stress with control (text in the rim) are regulated between 6 and 1 h 500 mOsm (text in the pie) of osmotic stress (color of pie slices indicate mode of regulation as in B and C; no regulation: white); the number of transcripts underlying the size of each pie slice are also indicated. The lower plot shows how transcripts whose translation was suppressed during the early mild-hyperosmotic-stress phase (1 h 500 mOsm) are regulated during the adaptation phase (6 h 500 mOsm). (E) Similar to (B) and (C), comparing 6 h of the 500 mOsm (NaCl) hyperosmotic stress with control. (F) Pie charts as in (D) comparing how transcripts translationally activated (left) or suppressed (right) during the early phase of mild hyperosmotic stress (1 h 500 mOsm) are regulated when comparing 6 h 500 mOsm with the control condition.
Figure 4.
Figure 4.. SNAT2 and mTOR independently affect translation during mild stress
(A and B) Scatterplots as described in Figures 3B and 3C comparing the effects of MeAIB (A) or torin 1 (B) treatments during the last 1 h of a 6 h 500 mOsm (NaCl) treatment to the same treatment in absence of inhibitors. (C and D) Pie charts as described in Figure 3D comparing how transcripts whose translation was modulated by MeAIB were regulated by torin 1 (C) or how those mRNAs whose translation was affected by torin 1 were regulated by MeAIB (D). (E) Scatterplots as described in Figures 3B and 3C assessing how transcripts identified in (A) are regulated under early (1 h 500 mOsm; bottom left) or adaptive (6 h 500 mOsm) mild hyperosmotic stress phases in the absence (bottom center) or presence (bottom right) of torin 1. (F) Scatterplots as in (E) assessing how transcripts exhibiting torin 1-sensitive translation (B) are regulated under early (1 h 500 mOsm; bottom left) or adaptive (6 h 500 mOsm) phases in the absence (bottom center) or presence (bottom right) of MeAIB. (G–J) Pie charts as described in Figure 3D showing how transcripts whose translation is altered by MeAIB (G and H) or torin 1 (I and J) treatment were regulated during early (G and I) or adaptive (H and J) stress phases.
Figure 5.
Figure 5.. Distinct cytoplasmic FUS and DDX3X inclusions signify progression to osmoadaptation
(A–E) NaCl was used as an osmolyte. (A) Subcellular distribution of FUS and DDX3X in corneal cells exposed to 500 or 700 mOsm media for the indicated times. Scale bars: 10 μm (B) Quantification of cytoplasmic FUS inclusions in cells exposed to 500 mOsm media. MeAIB was added during the last 1 h of 6 h treatment. n > 52, error bars represent SEM, p < 0.01, Tukey’s range test (from two-way ANOVA). (C) Magnification of the area indicated in (A) from cells treated with the indicated osmolarity. Scale bars: 10 μm (D) Analysis of FUS and DDX3X intensity along the line indicated in (A) from cells treated with 700 mOsm. (E) Changes in levels of the indicated amino acids after inhibition of SNAT2 with MeAIB. n = 3, error bars represent SEM, *p < 0.01; n.s., not significant. (F) Representative image of DDX3X droplets under fluorescent microscopy and differential interference contrast (DIC). Scale bars: 10 μm (G) Droplet number and diameter formed by the DDX3X protein in solution following addition of Pro . Error bars represent SEM, *p < 0.01.
Figure 6.
Figure 6.. Hyperosmotic-stress-induced DDX3X colocalization with G3BP1 is resolved during osmoadaptation dependent on SNAT2 activity
(A and B) NaCl was used as an osmolyte. (A) Immunofluorescence msicroscopy for the indicated proteins and cell treatments. Dotted squares indicate regions of magnified images shown. Scale bars: 10 μm (B) Quantification of cytoplasmic DDX3X condensates in cells exposed to 500 mOsm media for the indicated times. MeAIB was added for the last 1 h of 6 h 500 mOsm treatment. n > 46, error bars represent SEM, p < 0.01, Tukey’s range test (from two-way ANOVA). (C) Proposed model of SNAT2-mediated translational reprogramming in osmoadaptation. Mild hyperosmotic stress induces biphasic translational control. In the early response (phase 1, 1 h of stress), macromolecular crowding, decreased protein diffusion, and changes in the cytoskeleton cause (1) decreased mTOR activity and global translation inhibition and (2) increased levels of FUS and DDX3X cytoplasmic condensates correlated with translation inhibition. In the late osmoadaptive phase (phase 2, 6 h of stress), increased expression of SNAT2 leads to accumulation of amino acids that reverse mTOR and global protein synthesis inhibition. Accumulated amino acids function as chemical chaperones to reverse formation of RBP condensates. Bubble sizes reflect overall activity level (mTORC1, translation), overall levels (amino acids), and size of effect (cytoplasmic RBP condensates) relative to maximal observed values.

Similar articles

Cited by

  • Inhibition of protein translation under matrix-deprivation stress in breast cancer cells.
    Warrier S, Srinivasan S, Chedere A, Rangarajan A. Warrier S, et al. Front Med (Lausanne). 2023 Jun 22;10:1124514. doi: 10.3389/fmed.2023.1124514. eCollection 2023. Front Med (Lausanne). 2023. PMID: 37425300 Free PMC article.
  • Plasticity of the mammalian integrated stress response.
    Chen CW, Papadopoli D, Szkop KJ, Guan BJ, Alzahrani M, Wu J, Jobava R, Asraf MM, Krokowski D, Vourekas A, Merrick WC, Komar AA, Koromilas AE, Gorospe M, Payea MJ, Wang F, Clayton BLL, Tesar PJ, Schaffer A, Miron A, Bederman I, Jankowsky E, Vogel C, Valášek LS, Dinman JD, Zhang Y, Tirosh B, Larsson O, Topisirovic I, Hatzoglou M. Chen CW, et al. Nature. 2025 May;641(8065):1319-1328. doi: 10.1038/s41586-025-08794-6. Epub 2025 Mar 26. Nature. 2025. PMID: 40140574 Free PMC article.
  • Biology of Stress Responses in Aging.
    Maragkakis M, Malla S, Hatzoglou M, Trifunovic A, Glick AB, Finkel T, Longo VD, Kaushik S, Muñoz-Cánoves P, Lithgow GJ, Naidoo N, Booth LN, Payea MJ, Herman AB, de Cabo R, Wilson DM, Ferrucci L, Gorospe M. Maragkakis M, et al. Aging Biol. 2023;1:20230002. doi: 10.59368/agingbio.20230001. Epub 2023 Jun 27. Aging Biol. 2023. PMID: 38500537 Free PMC article.
  • Biomolecular condensates in kidney physiology and disease.
    Gao G, Sumrall ES, Pitchiaya S, Bitzer M, Alberti S, Walter NG. Gao G, et al. Nat Rev Nephrol. 2023 Dec;19(12):756-770. doi: 10.1038/s41581-023-00767-0. Epub 2023 Sep 26. Nat Rev Nephrol. 2023. PMID: 37752323 Review.
  • Stereo-seq of the prefrontal cortex in aging and Alzheimer's disease.
    Gong Y, Haeri M, Zhang X, Li Y, Liu A, Wu D, Zhang Q, Jazwinski SM, Zhou X, Wang X, Zhang K, Jiang L, Chen YP, Yan X, Swerdlow RH, Shen H, Deng HW. Gong Y, et al. Nat Commun. 2025 Jan 8;16(1):482. doi: 10.1038/s41467-024-54715-y. Nat Commun. 2025. PMID: 39779708 Free PMC article.

References

    1. Alam U, and Kennedy D (2019). Rasputin a decade on and more promiscuous than ever? A review of G3BPs. Biochim. Biophys. Acta Mol. Cell Res. 1866, 360–370. 10.1016/j.bbamcr.2018.09.001. - DOI - PMC - PubMed
    1. Al-Baghdadi RJT, Nikonorova IA, Mirek ET, Wang Y, Park J, Belden WJ, Wek RC, and Anthony TG (2017). Role of activating transcription factor 4 in the hepatic response to amino acid depletion by asparaginase. Sci. Rep. 7, 1272. 10.1038/s41598-017-01041-7. - DOI - PMC - PubMed
    1. Anders S, Pyl PT, and Huber W (2015). HTSeq–a Python framework to work with high-throughput sequencing data. Bioinformatics 31, 166–169. 10.1093/bioinformatics/btu638. - DOI - PMC - PubMed
    1. Bailey TL (2011). DREME: motif discovery in transcription factor ChIP-seq data. Bioinformatics 27, 1653–1659. 10.1093/bioinformatics/btr261. - DOI - PMC - PubMed
    1. Bailey TL, Boden M, Buske FA, Frith M, Grant CE, Clementi L, Ren J, Li WW, and Noble WS (2009). MEME SUITE: tools for motif discovery and searching. Nucleic Acids Res. 37, W202–W208. 10.1093/nar/gkp335. - DOI - PMC - PubMed

Publication types

MeSH terms

Substances