. 2022 Jul 19;40(3):111126.
doi: 10.1016/j.celrep.2022.111126.

Immune correlates of HIV-1 reservoir cell decline in early-treated infants

Affiliations

Immune correlates of HIV-1 reservoir cell decline in early-treated infants

Ciputra Adijaya Hartana et al. Cell Rep. .

Abstract

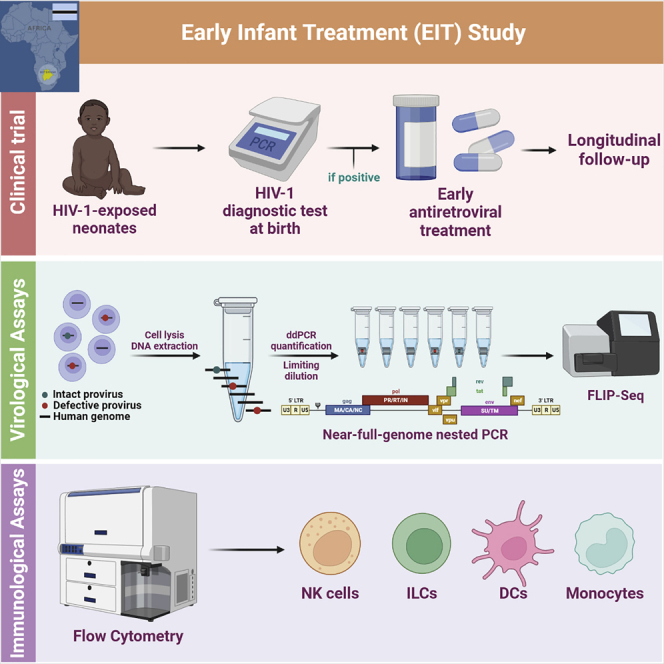
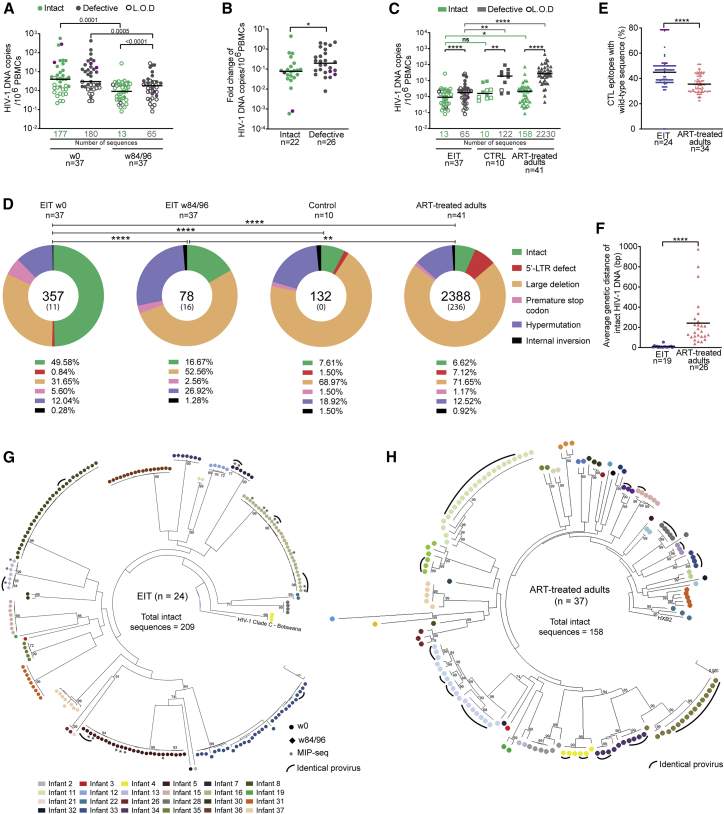
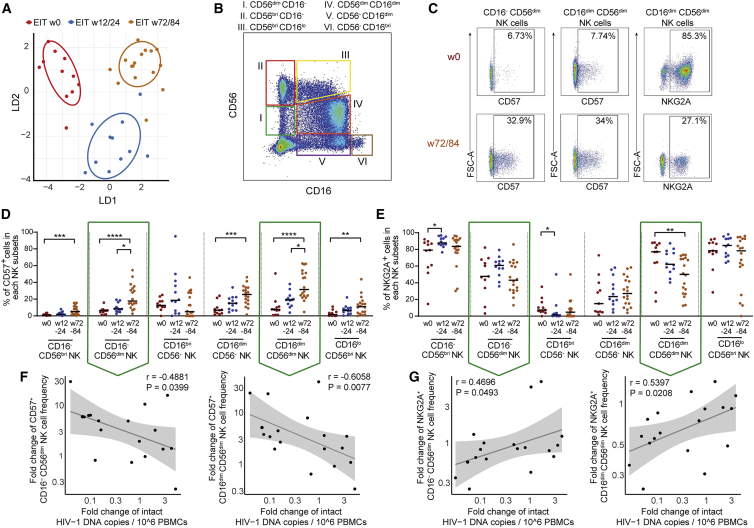
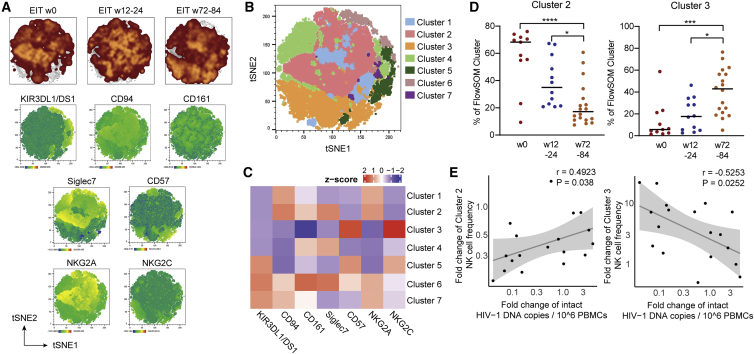
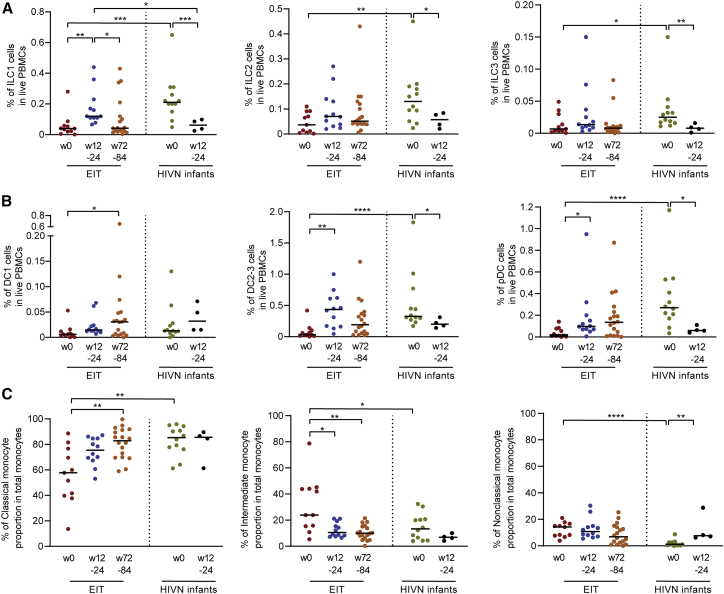
Initiation of antiretroviral therapy (ART) in infected neonates within hours after birth limits viral reservoir seeding but does not prevent long-term HIV-1 persistence. Here, we report parallel assessments of HIV-1 reservoir cells and innate antiviral immune responses in a unique cohort of 37 infected neonates from Botswana who started ART extremely early, frequently within hours after birth. Decline of genome-intact HIV-1 proviruses occurs rapidly after initiation of ART and is associated with an increase in natural killer (NK) cell populations expressing the cytotoxicity marker CD57 and with a decrease in NK cell subsets expressing the inhibitory marker NKG2A. Immune perturbations in innate lymphoid cells, myeloid dendritic cells, and monocytes detected at birth normalize after rapid institution of antiretroviral therapy but do not notably influence HIV-1 reservoir cell dynamics. These results suggest that HIV-1 reservoir cell seeding and evolution in early-treated neonates is markedly influenced by antiviral NK cell immune responses.

Keywords: CP: Immunology; CP: Microbiology; HIV reservoir; NK cells; innate immune responses; intact HIV-1 proviruses; pediatric HIV-1 infection.


Conflict of interest statement

Declaration of interests D.R.K. has received consulting honoraria and/or research support from Gilead, Merck, and ViiV. M.L. has received speaking and consulting honoraria from Merck.

Figures

None
Graphical abstract
Figure 1
Figure 1
Distinct viral reservoir landscape in early-treated HIV-1-infected infants (A) Frequency of intact and defective proviruses in early-treated HIV-1-infected infants at week 0 after birth (n = 37) and week 84/96 (n = 37). Limit of defection (LOD) was calculated as 0.5 copies per maximum number of cells tested without target identification. The total number of intact and defective sequences is shown under the x-axis. (B) Fold change in proportion of intact (n = 22) and defective (n = 26) proviruses between baseline (week 0) and week 84/96 in early-treated infants. Data from all infants with detectable proviruses at baseline were included. (C) Frequency of intact and defective proviruses in early-treated infants (EIT) at week 84/96 (n = 37), in control infants who started ART at a median of 125 days (range: 79–350 days) after birth (CTRL) (n = 10), and in HIV-1-infected adults who have been treated with ART for an average of 13 years (n = 41). The total number of intact and defective sequences is shown. (D) Pie charts reflecting the contribution of intact and defective proviruses to the total number of proviruses detected in each cohort; time points of analysis are as in (C). Total number of proviruses is shown in the center of each pie chart, with the number of identical proviruses shown in brackets. In ART-treated adults, only near-full-length amplification products were sequenced. (E) Proportion of CTL epitopes (restricted by autologous HLA class I alleles) within intact proviruses that display the clade C wild-type sequence (for clade C-infected infants from Botswana) (n = 24) or the clade B wild-type sequences (for clade B-infected adults from the US) (n = 34). (F) Average genetic distance of intact proviruses from early-treated infants (n = 19) and ART-treated adults (n = 26), determined by pairwise comparisons between all intact sequences within each study person. Data from all EIT with at least two different intact proviruses were included. (G and H) Circular maximum-likelihood phylogenetic trees of intact proviral sequences from early-treated infants and ART-treated adults. HXB2 was used as reference sequence for clade B; a clade C HIV-1 sequence from Botswana was used as reference for clade C. Clonal sequences, defined by complete sequence identity are highlighted by black arches. Bootstrap analysis with 1,000 replicates was performed to assign confidence to tree nodes; bootstrap support values >70% are shown in the trees. p < 0.05, ∗∗p < 0.01, ∗∗∗∗p < 0.0001. Two-tailed Mann-Whitney U tests were used for data shown in (B), (E), and (F); Wilcoxon matched-pairs signed-rank test were used for data shown in (A) and (C); Kruskal Wallis test with post-hoc Dunn’s test were used for data shown in (C); chi-square test was used for data shown in (D). (A–C, E, and F) Data from infants with peripartal infection are indicated in purple.
Figure 2
Figure 2
Longitudinal evolution of NK cell responses correlates with trajectory of intact HIV-1 proviruses (A) Linear discriminant analysis of the phenotypic profile of NK cells responses at indicated time points in early-treated infants. NK cells were phenotypically characterized using flow cytometry with 9 distinct surface markers. (B) Representative flow cytometry pseudocolor plot highlighting subclassification of NK cell subsets stratified according to CD16 and CD56 expression. (C) Pseudocolor plots indicating expression of CD57 and NKG2A in indicated NK cell subsets at week 0 (immediate after birth) and at 72/84 weeks after birth. (D and E) Longitudinal evolution of CD57-expressing (D) and NKG2A-expressing (E) NK cell subsets in early-treated infants. Data from weeks 0 (n = 11), 12/24 (n = 12), and 72/84 (n = 18) are shown. p < 0.05, ∗∗p < 0.01, ∗∗∗p < 0.001, ∗∗∗∗p < 0.0001; Kruskal Wallis test with post-hoc Dunn’s test. (F and G) Correlation between proportional changes of indicated NK cell subsets (between weeks 0 and 72/84) and corresponding changes in intact HIV-1 proviruses. Spearman correlation coefficient is indicated.
Figure 3
Figure 3
NK cell subsets associated with longitudinal trajectory of intact proviruses (A) (Top) Global t-distributed stochastic neighbor embedding (tSNE) maps of CD56dim CD16dim NK cells from early-treated infants; data from indicated time points are shown separately as overlays. (Bottom) tSNE maps showing the expression of individual phenotypic markers measured by flow cytometry in concatenated CD56dim CD16dim NK cells analyzed from early-treated infants. (B) tSNE map displaying 7 phenotypically distinct clusters identified by FlowSOM within concatenated CD56dim CD16dim NK cells from early-treated infants. (C) Heatmap showing the mean fluorescence intensity (MFI) of the phenotypic parameters measured in the 7 clusters shown in (B). (D) Longitudinal evolution of clusters 2 and 3 NK cell populations from weeks 0 (n = 11), 12/24 (n = 12), and 72/84 (n = 18). p < 0.05, ∗∗∗p < 0.001, ∗∗∗∗p < 0.0001; Kruskal Wallis test with post-hoc Dunn’s test. (E) Correlation between longitudinal fold changes in proportions of cluster 2 or 3 NK cells (between weeks 0 and 72/84) and corresponding changes in intact proviruses from early-treated infants. Spearman correlation coefficient is shown.
Figure 4
Figure 4
Innate immune cell profile in early-treated infants Proportion of ILC1, ILC2, and ILC3 (A) or DC1, DC2/3, and plasmacytoid dendritic cells (pDCs) (B) and of monocyte populations (C) within all PBMCs at weeks 0 (n = 11), 12/24 (n = 12), and 72/84 (n = 18) in early-treated HIV-1-infected infants (EIT) and at weeks 0 (n = 12) and 12/24 (n = 4) in HIV-1-negative infants. p < 0.05, ∗∗p < 0.01, ∗∗∗p < 0.001; Kruskal Wallis test with post-hoc Dunn’s test and Mann Whitney U test adjusted for multiple testing.

References

    1. Aagaard K., Ma J., Antony K.M., Ganu R., Petrosino J., Versalovic J. The placenta harbors a unique microbiome. Sci. Transl. Med. 2014;6:237ra265. - PMC - PubMed
    1. Ananworanich J., Puthanakit T., Suntarattiwong P., Chokephaibulkit K., Kerr S.J., Fromentin R., Bakeman W., Intasan J., Mahanontharit A., Sirivichayakul S., et al. Reduced markers of HIV persistence and restricted HIV-specific immune responses after early antiretroviral therapy in children. AIDS. 2014;28:1015–1020. - PubMed
    1. Bricault C.A., Yusim K., Seaman M.S., Yoon H., Theiler J., Giorgi E.E., Wagh K., Theiler M., Hraber P., Macke J.P., et al. HIV-1 neutralizing antibody signatures and application to epitope-targeted vaccine design. Cell Host Microbe. 2019;26:296. - PMC - PubMed
    1. Brooks A.G., Posch P.E., Scorzelli C.J., Borrego F., Coligan J.E. NKG2A complexed with CD94 defines a novel inhibitory natural killer cell receptor. J. Exp. Med. 1997;185:795–800. - PMC - PubMed
    1. Chomont N., El-Far M., Ancuta P., Trautmann L., Procopio F.A., Yassine-Diab B., Boucher G., Boulassel M.R., Ghattas G., Brenchley J.M., et al. HIV reservoir size and persistence are driven by T cell survival and homeostatic proliferation. Nat. Med. 2009;15:893–900. - PMC - PubMed

Publication types

Substances