. 2022 Jul 19;3(7):100694.
doi: 10.1016/j.xcrm.2022.100694.

Radiogenomic analysis reveals tumor heterogeneity of triple-negative breast cancer

Affiliations

Radiogenomic analysis reveals tumor heterogeneity of triple-negative breast cancer

Lin Jiang et al. Cell Rep Med. .

Abstract

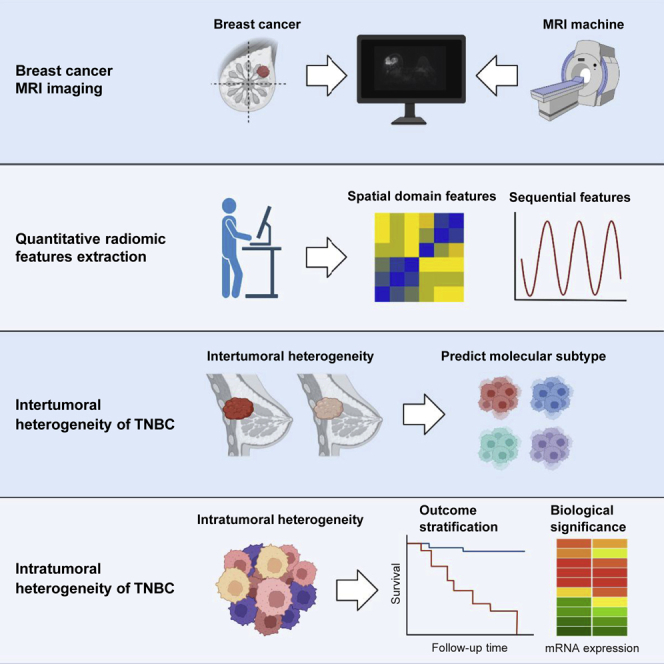
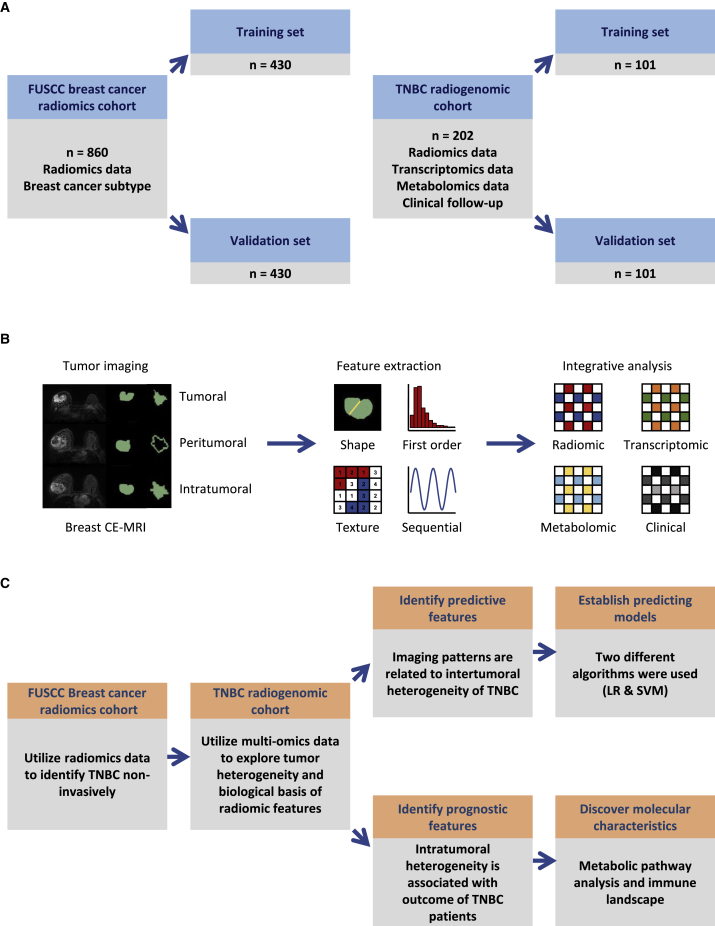
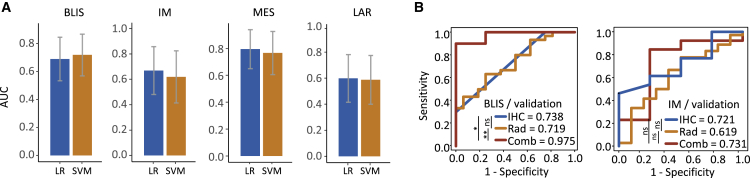
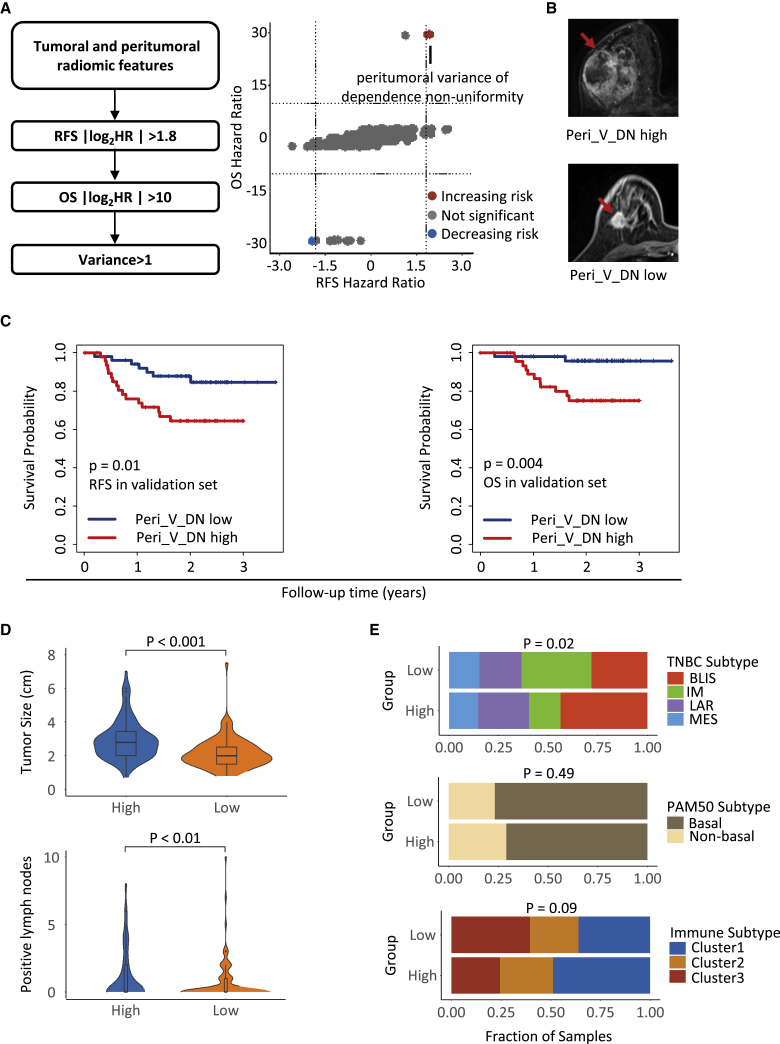
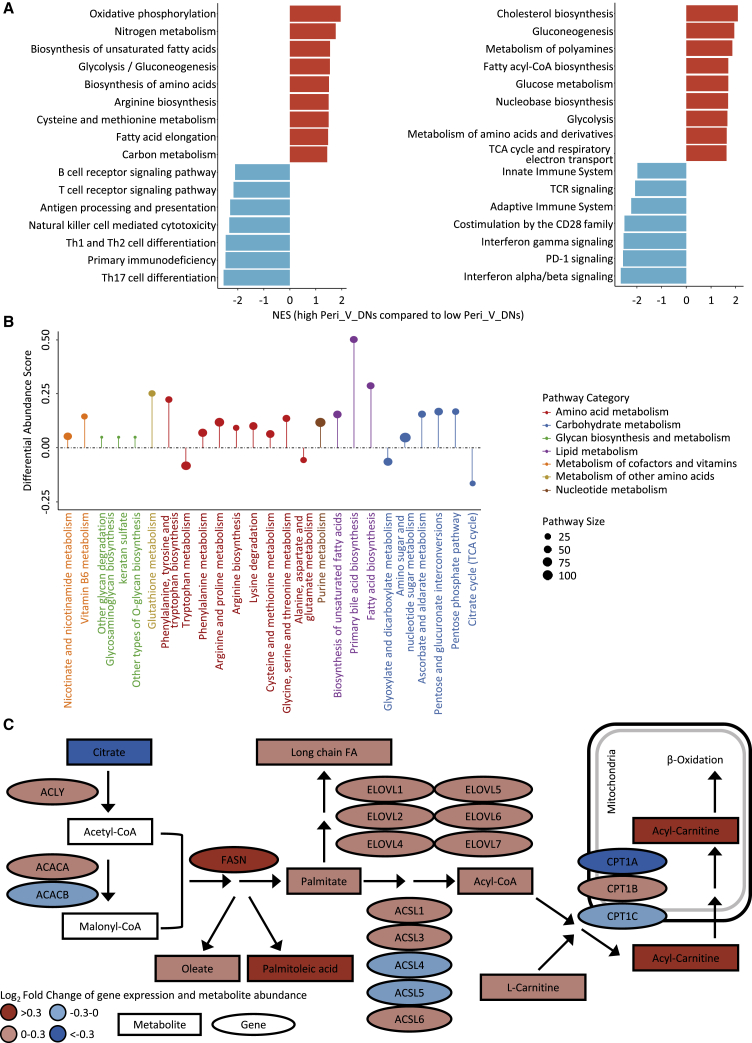
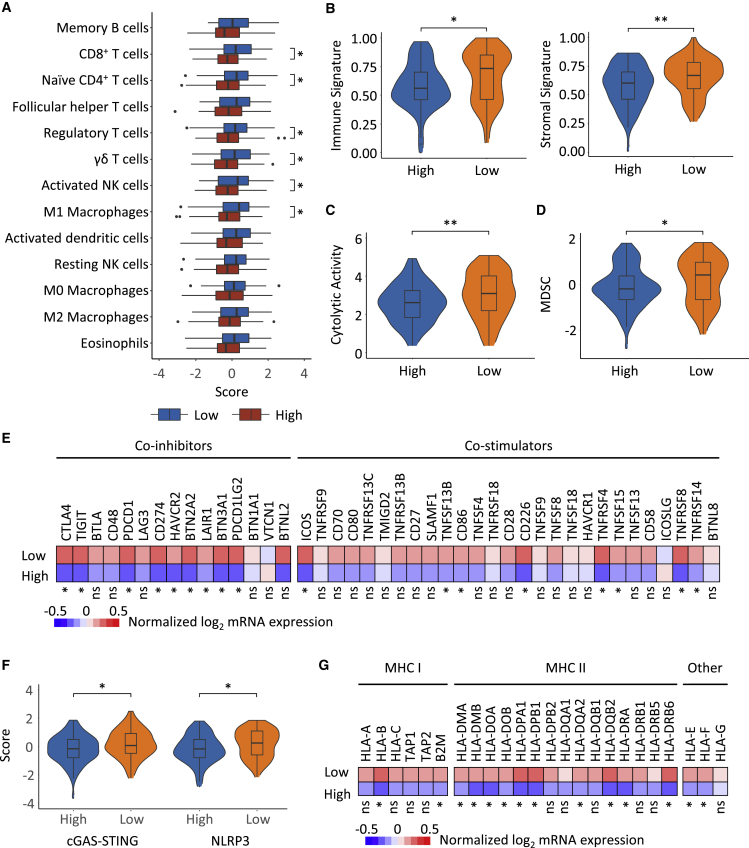
Triple-negative breast cancer (TNBC) is a subset of breast cancer with an adverse prognosis and significant tumor heterogeneity. Here, we extract quantitative radiomic features from contrast-enhanced magnetic resonance images to construct a breast cancer radiomic dataset (n = 860) and a TNBC radiogenomic dataset (n = 202). We develop and validate radiomic signatures that can fairly differentiate TNBC from other breast cancer subtypes and distinguish molecular subtypes within TNBC. A radiomic feature that captures peritumoral heterogeneity is determined to be a prognostic factor for recurrence-free survival (p = 0.01) and overall survival (p = 0.004) in TNBC. Combined with the established matching TNBC transcriptomic and metabolomic data, we demonstrate that peritumoral heterogeneity is associated with immune suppression and upregulated fatty acid synthesis in tumor samples. Collectively, this multi-omic dataset serves as a useful public resource to promote precise subtyping of TNBC and helps to understand the biological significance of radiomics.

Keywords: biomarker; prognosis; radiomics; triple-negative breast cancer; tumor heterogeneity.


Conflict of interest statement

Declaration of interests L.J. is currently an employee of AstraZeneca.

Figures

None
Graphical abstract
Figure 1
Figure 1
Overview of this integrative radiogenomic study (A) Description of the radiomic cohorts used in this study. (B) Generating process of radiomic data and integrative analysis used in TNBC radiogenomic cohort. (C) Analytical framework of integrative radiogenomic analysis. CE-MRI, contrast-enhanced magnetic resonance imaging; LR, logistic regression; SVM, support vector machine; TNBC, triple-negative breast cancer. See also Figures S1 and S2 and Tables S1–S3.
Figure 2
Figure 2
Efficacy of predicting TNBC molecular subtypes using radiomics and IHC data with machine learning method (A) AUC of the radiomic signatures for predicting BLIS, IM, MES, and LAR subtypes. Error bar represented the 95% confidence interval of AUC. (B) Comparison of combined model, individual radiomic model, and IHC model for predicting BLIS and IM subtypes. ∗∗0.001 < p ≤ 0.01; ∗0.01 < p ≤ 0.05; ns, p > 0.05. AUC, area under the receiver operating characteristic curve; BLIS, basal-like immune suppressed; IHC, immunohistochemistry; IM, immunomodulatory; LAR, luminal androgen receptor; LR, logistic regression; MES, mesenchymal like; SVM, support vector machine; TNBC, triple-negative breast cancer. See also Tables S3 and S4.
Figure 3
Figure 3
Identification of the prognostic feature Peri_V_DN and its clinicopathological associations (A) Criteria of prognostic feature selection (left) and hazard ratios for RFS and OS of the radiomic features (right). (B) Breast CE-MRI images from one patient with high Peri_V_DN (upper) and one patient with low Peri_V_DN (lower). (C) Kaplan-Meier plots show the prognostic value of Peri_V_DN for RFS and OS in the validation set. (D) Distribution of tumor size and pathologically confirmed metastatic lymph nodes between Peri_V_DN groups. (E) Distribution of the TNBC transcriptomic subtypes, PAM50 subtypes, and TNBC microenvironment clusters between Peri_V_DN groups. HR, hazard ratio; OS, overall survival; Peri_V_DN, peritumoral variance in dependence nonuniformity of peritumoral regions; RFS, recurrence-free survival. See also Figure S3.
Figure 4
Figure 4
Identification of differentially expressed pathways and transcriptomic-metabolomic integrative analysis (A) Enrichment of pathways in high Peri_V_DN group compared with low Peri_V_DN group using GSEA (left panel based on KEGG; right panel based on Reactome). (B) A pathway-based analysis of metabolomic changes between Peri_V_DN groups. The differential abundance (DA) score captured the overall change in a metabolic pathway. A score of 1 indicated that all metabolites in this pathway increased in high Peri_V_DN group compared with low Peri_V_DN group, and a score of −1 indicated that all metabolites in this pathway decreased. (C) Transcriptomics and metabolomics distinctions in fatty acid biosynthesis pathway between Peri_V_DN groups. Log2-fold changes of mRNA expression levels and metabolite abundances in high Peri_V_DN tumor samples compared with low Peri_V_DN tumor samples were demonstrated. CoA, coenzyme A; FA, fatty acid; GSEA, gene set enrichment analysis; KEGG, Kyoto Encyclopedia of Genes and Genomes; NES, normalized enrichment score; TCA, tricarboxylic acid; TCR, T cell receptor. See also Figure S4 and Tables S5, S6, S7, and S8.
Figure 5
Figure 5
Landscape of the tumor microenvironment of the Peri_V_DN groups and distinct escape mechanisms (A) Differences in the abundance of immune cell types in high Peri_V_DN group compared with low Peri_V_DN group. (B) Scores of the immune signature (left) and stromal signature (right) inferred by ESTIMATE between Peri_V_DN groups. (C) Comparison of cytolytic activity showed higher effector immune cell activity between Peri_V_DN groups. (D) Comparison of the abundance of MDSCs between Peri_V_DN groups. (E) Normalized mRNA expression levels of immune co-inhibitors and co-stimulators between Peri_V_DN groups. (F) Signature scores of two innate immunity-sensing pathways, cGAS-STING and the NLRP3 inflammasome, between Peri_V_DN groups. (G) Normalized mRNA expression levels of MHC molecules between Peri_V_DN groups. In total, 167 samples with transcriptomic data were included for analysis. ∗∗0.001 < p ≤ 0.01; ∗0.01 < p ≤ 0.05; ns, p > 0.05. GSVA, gene set variation analysis; MDSC, myeloid-derived suppressor cell; ssGSEA, single-sample gene set enrichment analysis.

References

    1. Waks A.G., Winer E.P. Breast cancer treatment: a review. J. Am. Med. Assoc. 2019;321:288. doi: 10.1001/jama.2018.19323. - DOI - PubMed
    1. Criscitiello C., Azim H.A., Jr., Schouten P.C., Linn S.C., Sotiriou C. Understanding the biology of triple-negative breast cancer. Ann. Oncol. 2012;23 doi: 10.1093/annonc/mds188. vi13-18. - DOI - PubMed
    1. Denkert C., Liedtke C., Tutt A., von Minckwitz G. Molecular alterations in triple-negative breast cancer—the road to new treatment strategies. Lancet. 2017;389:2430–2442. doi: 10.1016/s0140-6736(16)32454-0. - DOI - PubMed
    1. Metzger-Filho O., Tutt A., de Azambuja E., Saini K.S., Viale G., Loi S., Bradbury I., Bliss J.M., Azim H.A., Jr., Ellis P., et al. Dissecting the heterogeneity of triple-negative breast cancer. J. Clin. Oncol. 2012;30:1879–1887. doi: 10.1200/jco.2011.38.2010. - DOI - PubMed
    1. Lehmann B.D., Bauer J.A., Chen X., Sanders M.E., Chakravarthy A.B., Shyr Y., Pietenpol J.A. Identification of human triple-negative breast cancer subtypes and preclinical models for selection of targeted therapies. J. Clin. Invest. 2011;121:2750–2767. doi: 10.1172/jci45014. - DOI - PMC - PubMed

Publication types

Substances