. 2022 Aug 4;29(8):1273-1284.e8.
doi: 10.1016/j.stem.2022.06.012. Epub 2022 Jul 19.

Inflammatory exposure drives long-lived impairment of hematopoietic stem cell self-renewal activity and accelerated aging

Affiliations

Inflammatory exposure drives long-lived impairment of hematopoietic stem cell self-renewal activity and accelerated aging

Ruzhica Bogeska et al. Cell Stem Cell. .

Abstract

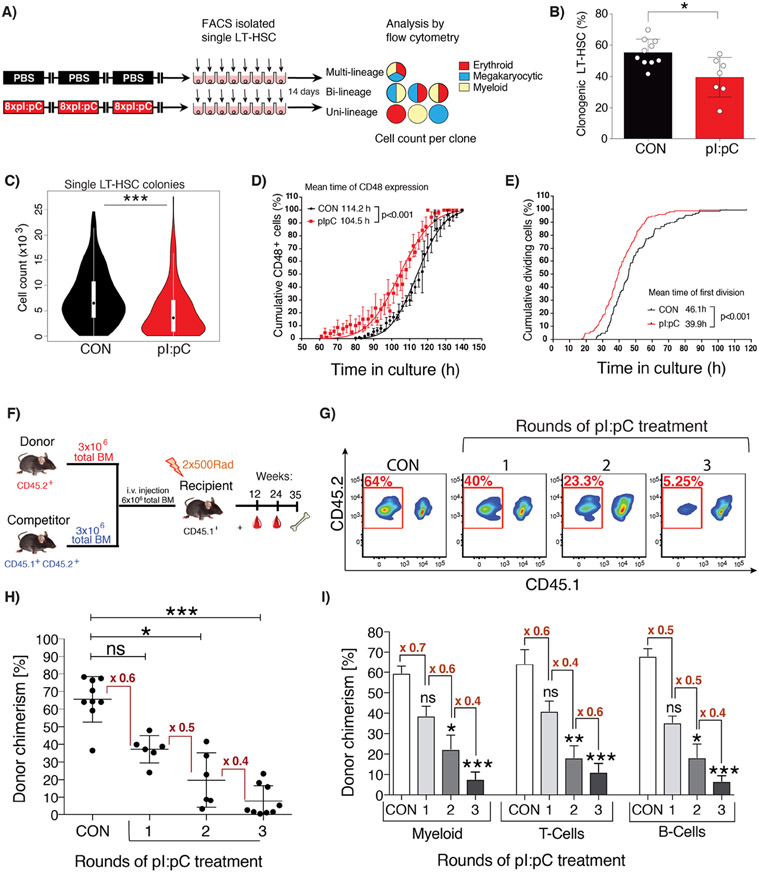
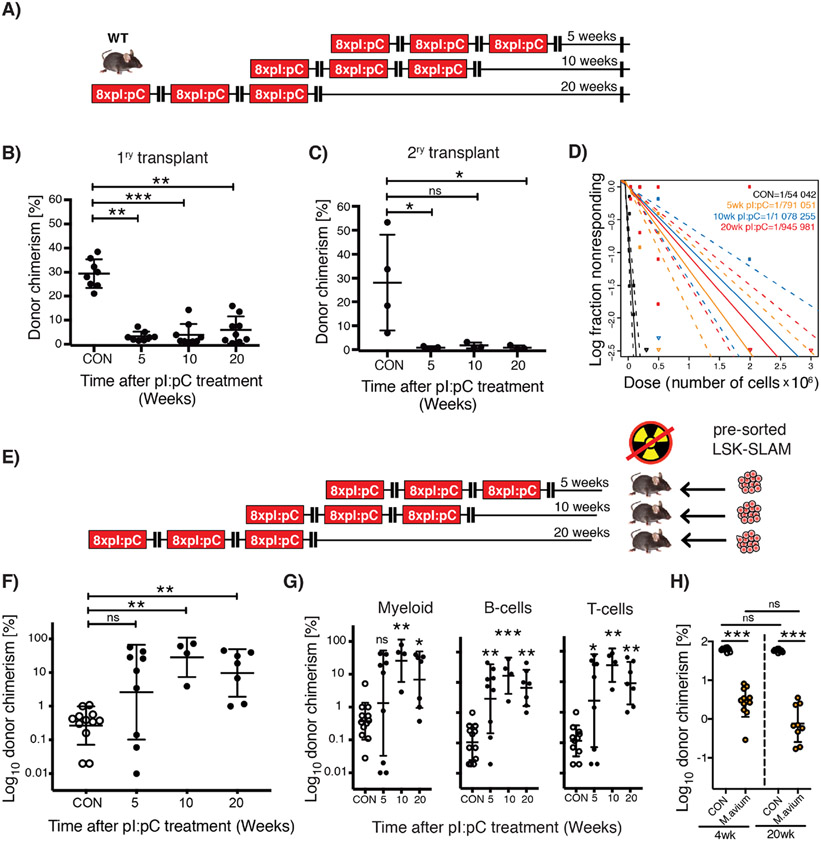
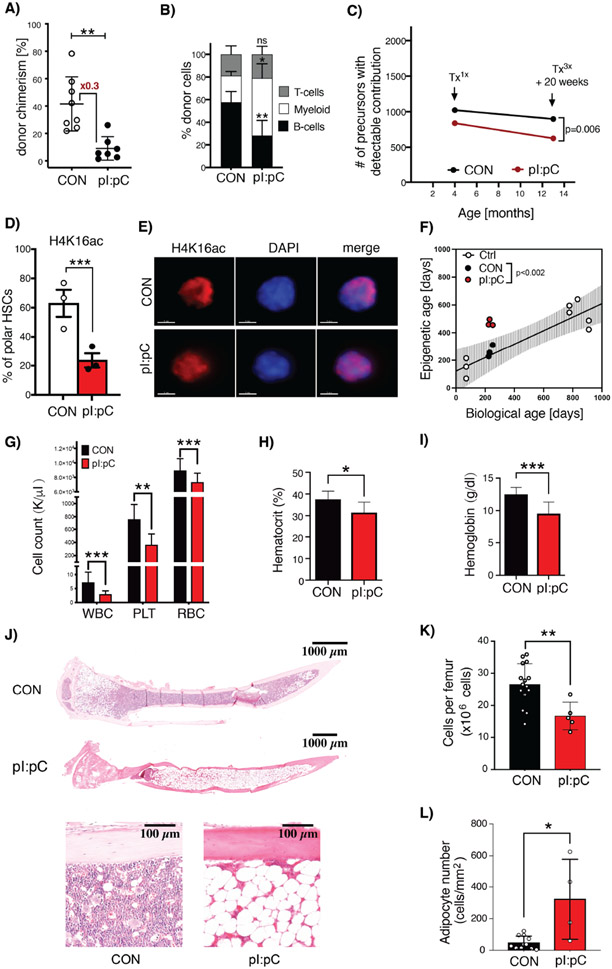
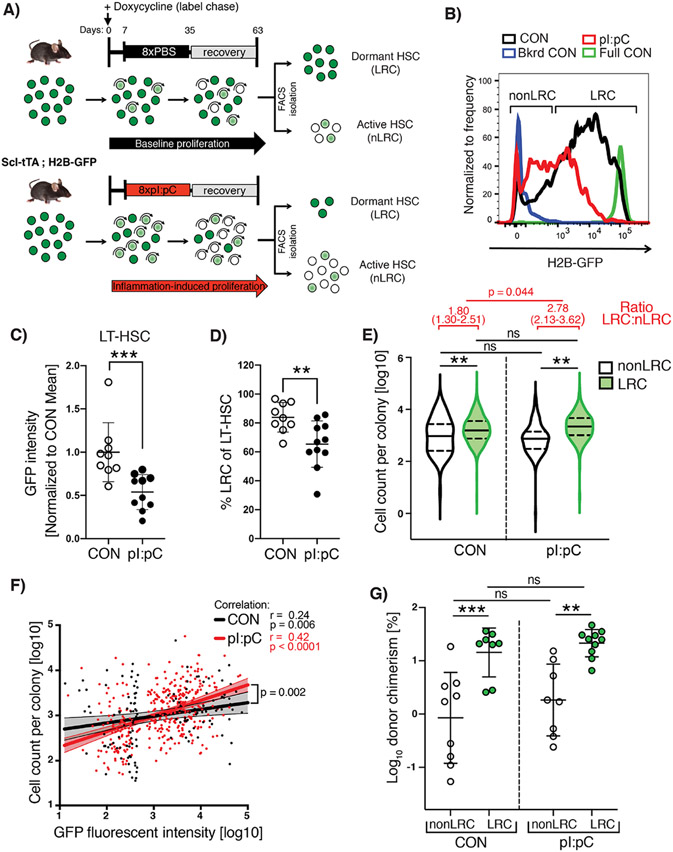
Hematopoietic stem cells (HSCs) mediate regeneration of the hematopoietic system following injury, such as following infection or inflammation. These challenges impair HSC function, but whether this functional impairment extends beyond the duration of inflammatory exposure is unknown. Unexpectedly, we observed an irreversible depletion of functional HSCs following challenge with inflammation or bacterial infection, with no evidence of any recovery up to 1 year afterward. HSCs from challenged mice demonstrated multiple cellular and molecular features of accelerated aging and developed clinically relevant blood and bone marrow phenotypes not normally observed in aged laboratory mice but commonly seen in elderly humans. In vivo HSC self-renewal divisions were absent or extremely rare during both challenge and recovery periods. The progressive, irreversible attrition of HSC function demonstrates that temporally discrete inflammatory events elicit a cumulative inhibitory effect on HSCs. This work positions early/mid-life inflammation as a mediator of lifelong defects in tissue maintenance and regeneration.

Keywords: HSCs; accelerated aging; aging; clonal hematopoiesis; hematopoietic stem cells; inflammaging; inflammation; self-renewal; stem cell exhaustion; stress hematopoiesis.


Conflict of interest statement

Declaration of interests The authors declare no competing interests.

Figures

Figure 1.
Figure 1.. Repetitive exposure to inflammatory stress progressively compromises the functional potency of LT-HSCs.
(A) Schematic representation of in vitro single cell liquid culture assay using purified LT-HSCs. (B) The percentage of LT-HSC clones capable of forming colonies is shown for LT-HSC isolated from CON or Tx3X mice (plus mean±SD, n=7-10 mice). (C) Violin plots representing the total number of daughter cells generated by each LT-HSC. (D&E) In vitro time-lapse microscopy-based cell tracking, evaluating: (D) the cumulative percentage of cells expressing CD48 versus time in culture, fitted to a Gaussian distribution curve; (E) the cumulative incidence of LT-HSC having undergone first cell division per unit time in culture (mean±SD, n= 128 or 148 individual LT-HSCs for CON or pI:pC groups, respectively; n=3 independent biological repeats per group). (F-I) Competitive repopulation assays were performed as described in methods. PB was analyzed at 24 weeks post-transplantation. (F) Schematic representation of the standard competitive transplantation assay (G) Representative flow cytometry plots of total donor leukocyte chimerism in PB. PB cells derived from donor BM isolated from pI:pC-treated or CON donors are outlined in red. (H) Percentage total donor leukocyte chimerism in PB for the indicated groups. Each dot represents transplantation outcome of BM from an individual treated donor mouse (I) Percentage donor chimerism in defined compartments of PB. Myeloid=CD11b+, T-cells=CD4+/CD8+, B-cells=B220+ (plus mean±SD, n=8-9 mice per group). ns=P>0.05, *P<0.05, **P<0.01,***P<0.001.
Figure 2.
Figure 2.. Lack of HSC functional recovery in vivo following inflammatory stress.
(A) Schematic representation of treatment schedule incorporating increasing duration of recovery post-challenge with pI:pC. (B&C) Serial competitive repopulation assay using BM harvested from mice at indicated time points post-treatment: (B) Percentage total donor leukocyte chimerism at 24 weeks post-transplantation in primary recipients; (C) Percentage total donor leukocyte chimerism at 24 weeks post-transplantation in secondary recipients. Each dot represents transplantation outcome of BM from an individual treated mouse or primary recipient mouse (plus mean±SD). (D) Limiting dilution transplantation assays to determine LT-HSC frequency in BM isolated from femora of individual mice. 95% confidence intervals are indicated with dashed lines (n=6-9 recipients per dilution, per donor, representing analysis of BM from 3-4 individual treated donor mice). (E) Schematic representation of reverse transplant experiment. Mice exposed to the indicated treatment regimen were injected i.v. with saturating doses of purified donor HSCs in the absence of any conditioning with irradiation. (F&G) Percentage donor contribution in PB at 24 weeks post-reverse transplantation to the following defined populations: (F) total leukocytes; (G) Myeloid (CD11b+/GR-1+), B-cells (B220+) and T-cells (CD4+/CD8+). Each dot indicates an individual treated recipient (plus mean ± SD). (H) Competitive repopulation assay using BM from mice infected three times with M. avium, treated with clarithromycin to resolve the infection, then harvested at either 4- or 20-weeks post-treatment. Percentage total donor leukocyte chimerism at 24 weeks post-transplantation is shown. Control (CON) group was also treated with clarithromycin for equivalent time period. Each circle indicates a transplantation outcome from an individual treated donor mouse. ns=P>0.05, *P<0.05, **P<0.01, ***P<0.001.
Figure 3.
Figure 3.. Inflammatory challenge promotes accelerated hematologic aging.
(A&B) PB flow cytometry analysis at 24 weeks post-competitive transplantation of BM cells harvested from CON or Tx3X mice at 12 months post-challenge. (A) Total donor leukocyte chimerism and (B) relative frequency of myeloid (CD11b+/Gr-1+), B- (B220+) and T-cells (CD4+/CD8+) are shown. Dots represent individual mice, mean±SD is indicated, n=7-8 mice per group. (C) The clonal complexity of LT-HSC in CON, Tx1x or Tx3X (20 weeks post-treatment) Conf-Flk-1Cre mice was calculated as previously described(Ganuza et al., 2019). n=6-10 mice per group. (D&E) Assessment of polarity of distribution of H4K16ac within the nucleus of LT-HSCs. (D) Percentage of LT-HSCs isolated from CON or Tx3X mice that had a polar distribution of H4K16ac staining. n=3 mice per group; 39 single cells for CON and 41 single cells for Tx3X mice. Each point indicates an individual mouse; data are mean±SD. (E) Representative single-cell IF images showing the distribution of H4K16ac (red) in the nuclei of LT-HSCs from Tx3X or CON mice. Nuclei are stained with DAPI (blue), scale bar=3μm. (F) Plot of chronological age versus biological age calculated via DNA methylome clock, for LT-HSCs isolated from: non-treated young and aged mice (white circles); Tx3X mice (red circles); and age-matched CON mice (black circles). Line represents linear regression on young and aged non-treated mice with 95% CI (shaded area). (G-L) Mice were challenged repeatedly with pI:pC or PBS in early/mid-life as illustrated in Figure S4A. At 24 months of age, the following hematologic parameters were assessed: (G) Leukocyte (WBC), platelet (PLT) and red blood cell (RBC) counts in PB; (H) PB hematocrit; (I) Hemoglobin; (J) Representative whole mount H&E sections of tibiae; (K) BM cellularity per femur; and (L) Microscopy-based enumeration of adipocyte density within medullary cavity of tibiae (n=5-15 mice per group in G-I). Circles represent individual treated aged mice (plus mean±SD). *P<0.05, **P<0.01, ***P<0.001.
Figure 4.
Figure 4.. Dormant HSCs are protected from inflammation-associated functional decline while proliferating cells fail to self-renew.
(A) Schematic representation of combined label retention and treatment schedule. Scl-tTA;H2B-GFP mice were treated with pI:pC or PBS (CON) as indicated. Label chase was induced by sustained administration of doxycycline starting 7 days before pI:pC/PBS treatment. Flow cytometry analysis/sorting was performed on BM at 8 weeks after initiation of pI:pC/PBS treatment. (B) Representative flow cytometry histograms of GFP fluorescence in LT-HSCs from PBS and pI:pC treated mice. Background fluorescence (Bkrd CON) and fully labeled (Full CON) controls are indicated (C) Mean fluorescent intensity of GFP in LT-HSCs and (D) the proportion of LRCs within the LT-HSC population in CON and pI:pC treated mice. Each dot represents a single mouse (plus mean±SD). (E) Violin plots showing the cell number of progeny generated per individual LRC or nonLRC following 14 days in-vitro culture (n=4-5 mice per group, n=280, 364, 293 or 260 analyzed clones for nonLRC CON, LRC CON, nonLRC pI:pC and LRC pI:pC, respectively). Solid lines represent median, dashed lines interquartile range. Analysis of ratio between LRC and nLRC groups is shown in red. (F) Correlation analysis between GFP intensity and cell number of progeny per individual LT-HSCs following 14 days in-vitro culture (n=3 mice per group, n=132 and n=363 analyzed LT-HSCs per CON and pI:pC group respectively). Dots represent individual LT-HSCs, lines are simple linear regression with 95% CI. (G) Percentage total donor PB leukocyte chimerism following competitive transplantation of LRC or nonLRC from CON or pI:pC-treated mice at 12 weeks post-transplantation. n=8-10 donor mice per condition. ns=P>0.05, *P<0.05, **P<0.01, ***P<0.001).

Comment in

References

    1. Andrejak C, Almeida DV, Tyagi S, Converse PJ, Ammerman NC, and Grosset JH (2015). Characterization of mouse models of Mycobacterium avium complex infection and evaluation of drug combinations. Antimicrob Agents Chemother 59, 2129–2135. - PMC - PubMed
    1. Angerer P, Haghverdi L, Buttner M, Theis FJ, Marr C, and Buettner F (2016). destiny: diffusion maps for large-scale single-cell data in R. Bioinformatics 32, 1241–1243. - PubMed
    1. Baldridge MT, King KY, Boles NC, Weksberg DC, and Goodell MA (2010). Quiescent haematopoietic stem cells are activated by IFN-gamma in response to chronic infection. Nature 465, 793–797. - PMC - PubMed
    1. Beerman I, Bock C, Garrison BS, Smith ZD, Gu H, Meissner A, and Rossi DJ (2013). Proliferation-dependent alterations of the DNA methylation landscape underlie hematopoietic stem cell aging. Cell Stem Cell 12, 413–425. - PubMed
    1. Biino G, Santimone I, Minelli C, Sorice R, Frongia B, Traglia M, Ulivi S, Di Castelnuovo A, Gogele M, Nutile T, et al. (2013). Age- and sex-related variations in platelet count in Italy: a proposal of reference ranges based on 40987 subjects' data. PLoS One 8, e54289. - PMC - PubMed

Publication types