. 2022 Sep 7;110(17):2867-2885.e7.
doi: 10.1016/j.neuron.2022.06.017. Epub 2022 Jul 19.

Vagus nerve stimulation drives selective circuit modulation through cholinergic reinforcement

Affiliations

Vagus nerve stimulation drives selective circuit modulation through cholinergic reinforcement

Spencer Bowles et al. Neuron. .

Abstract

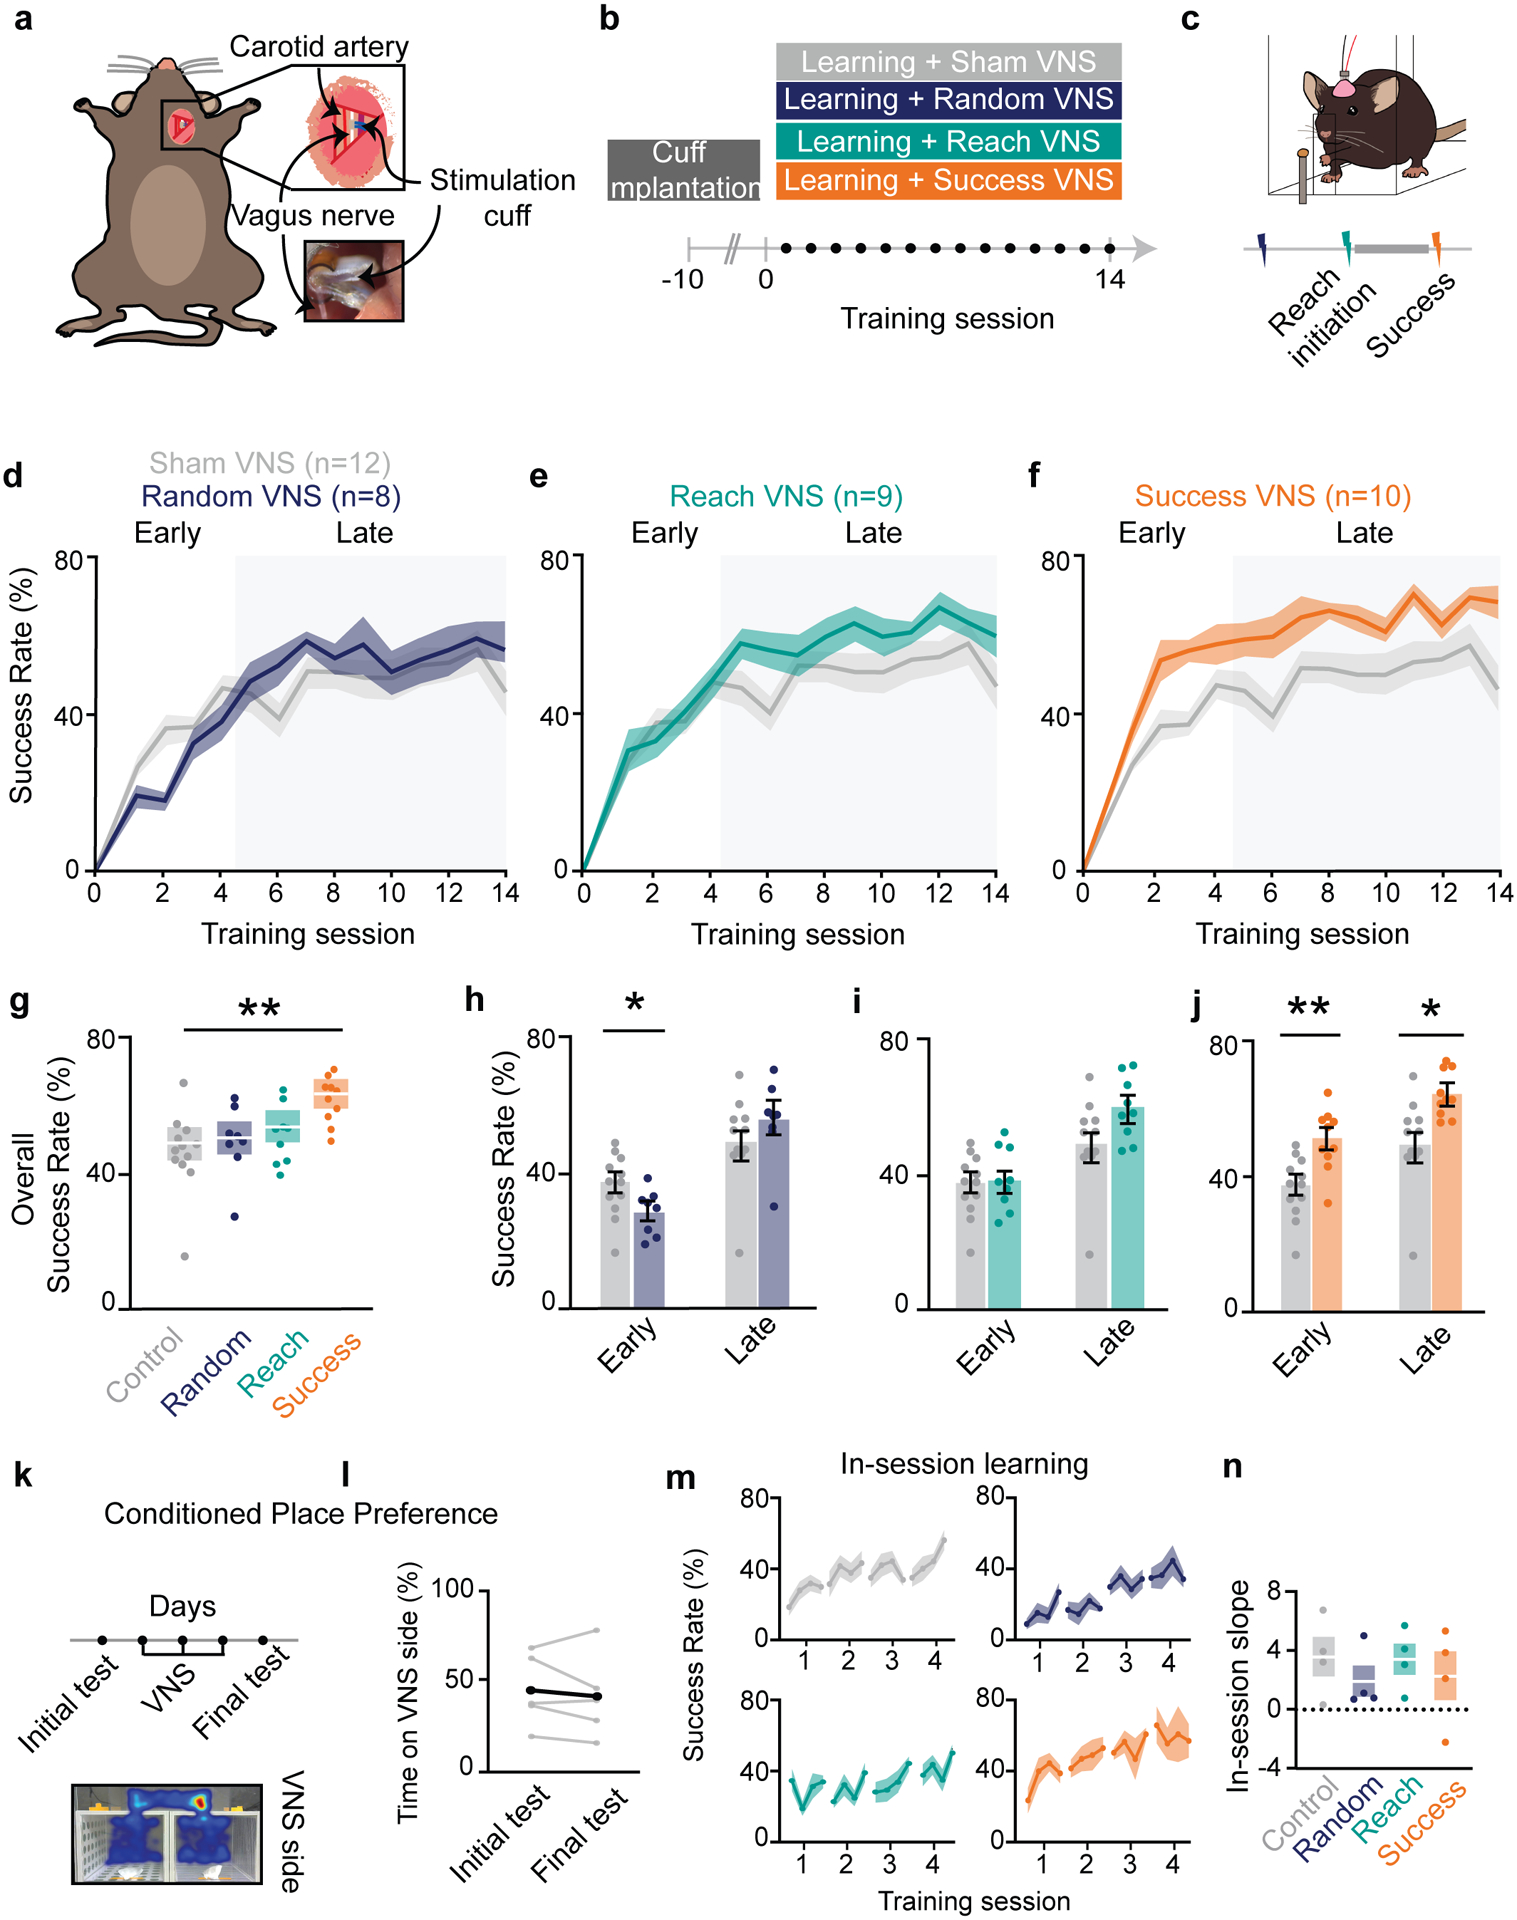
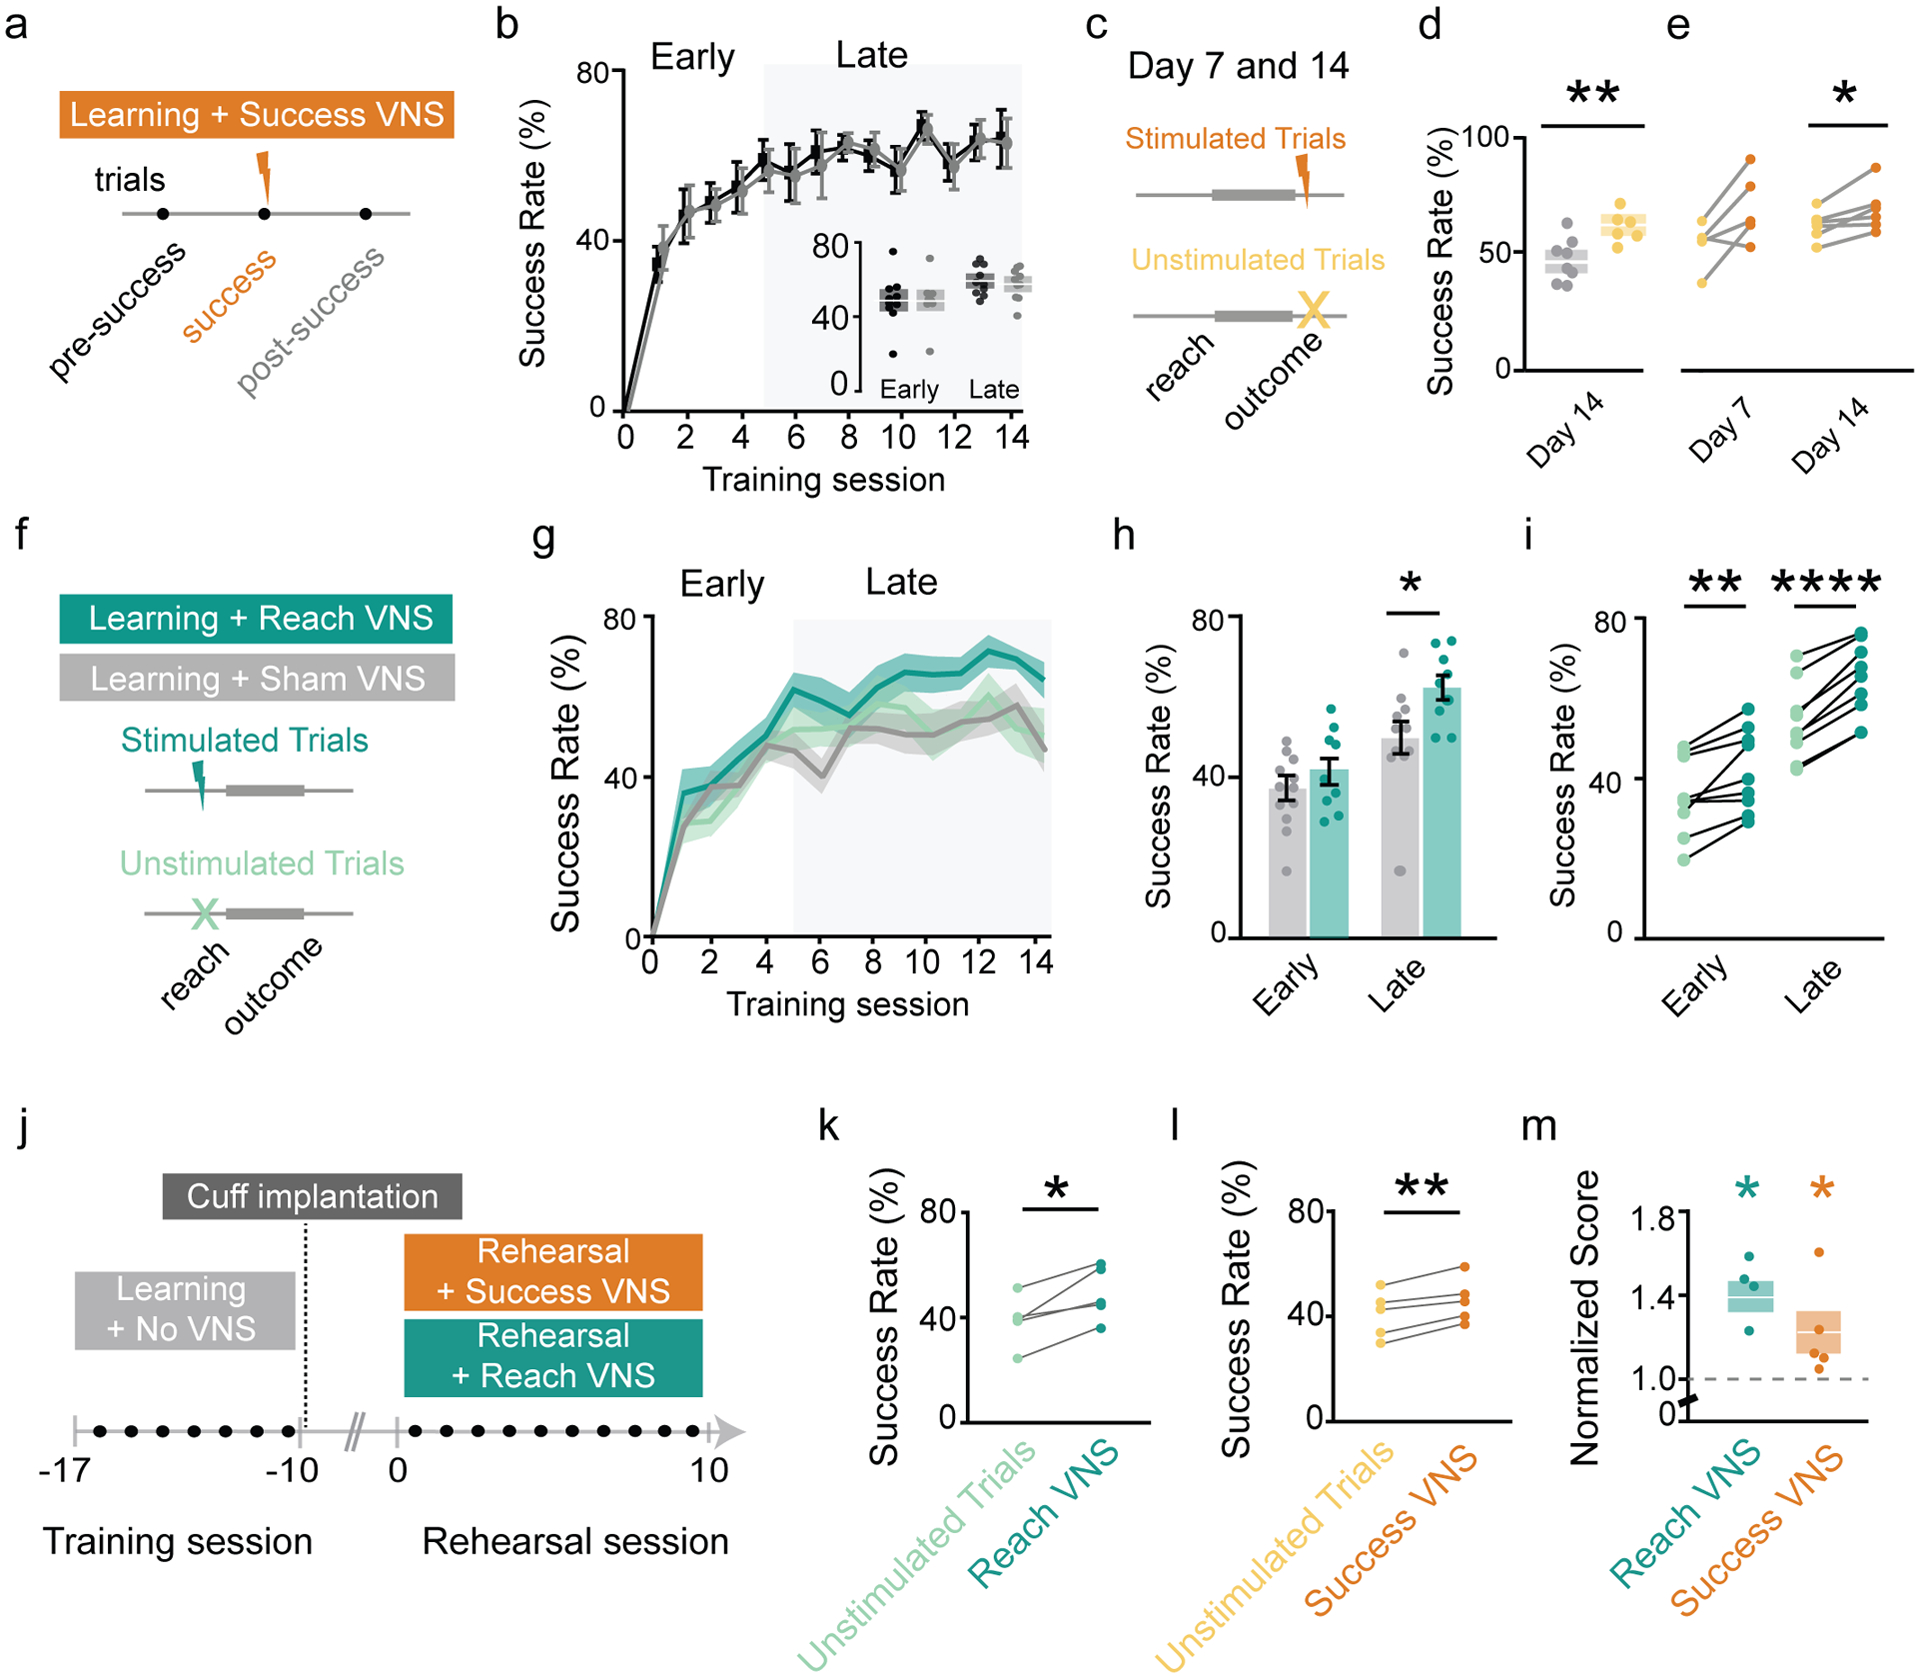
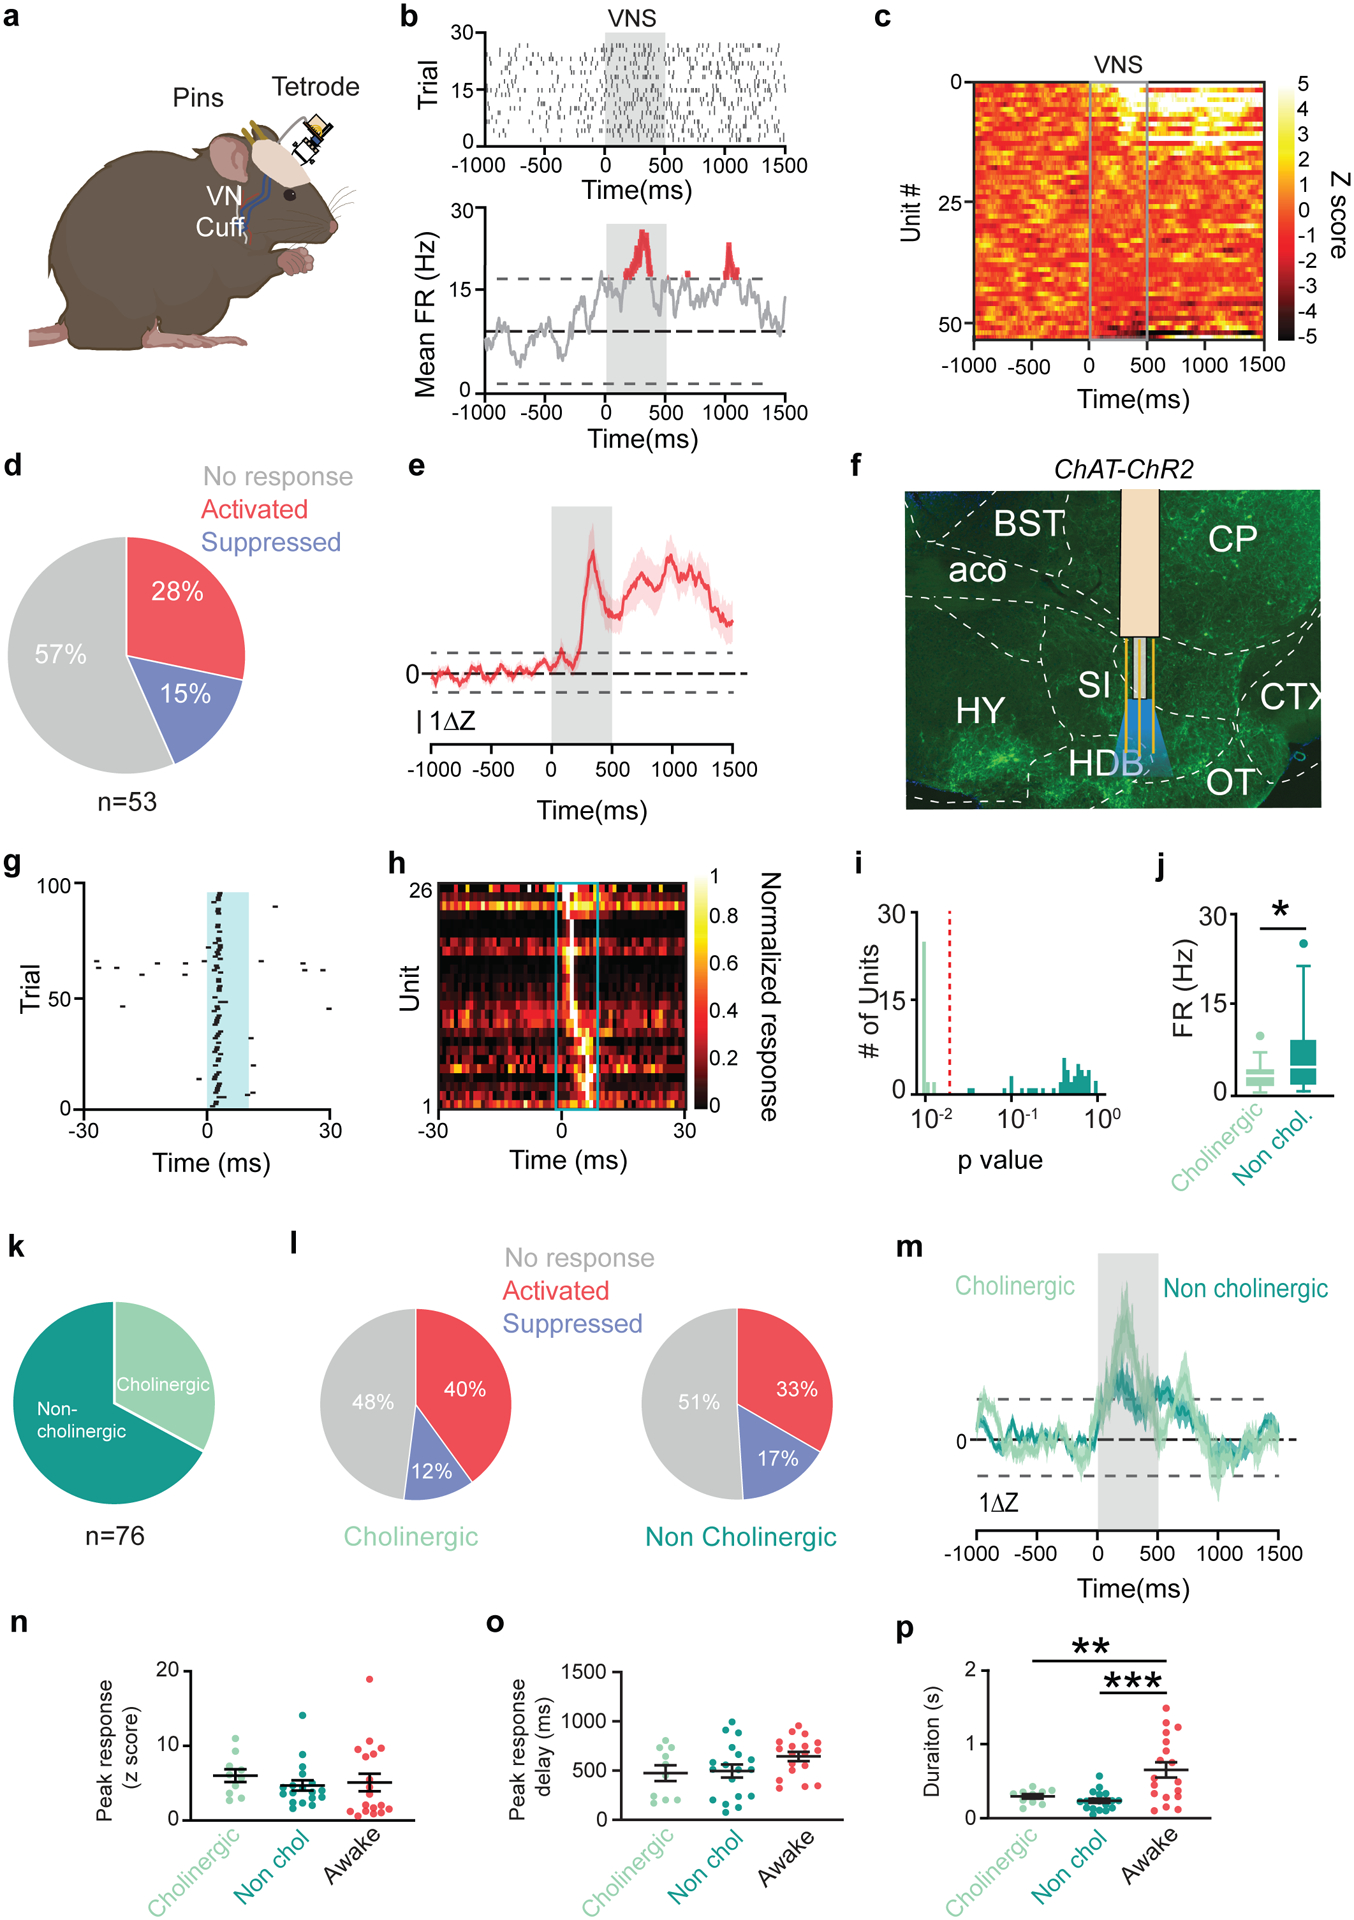
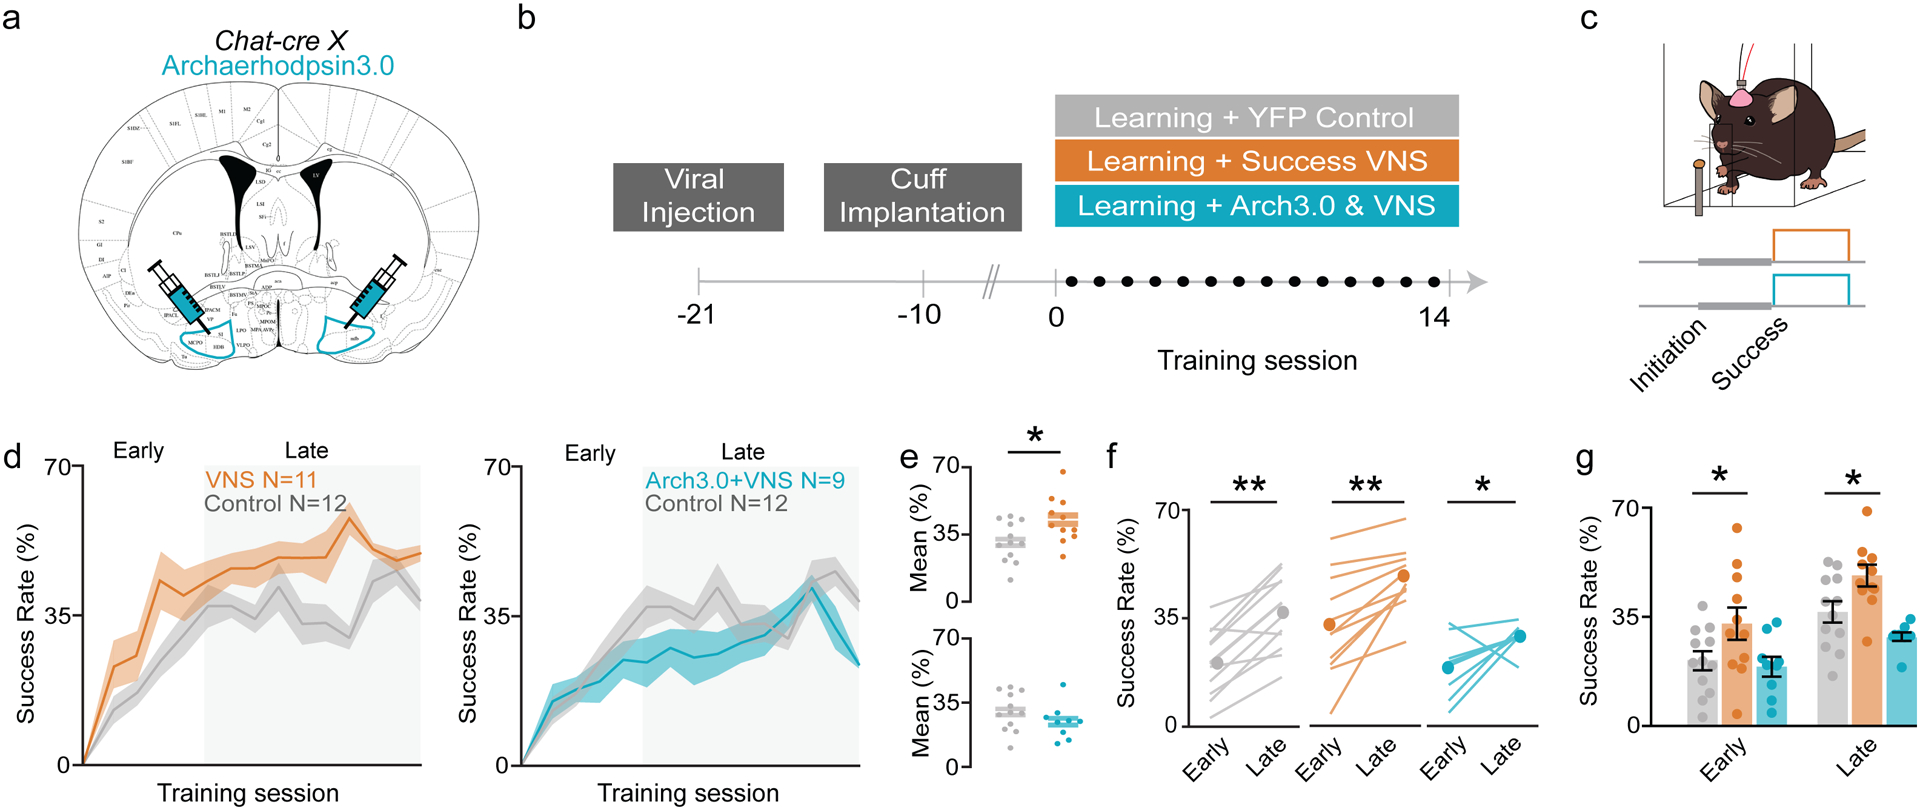
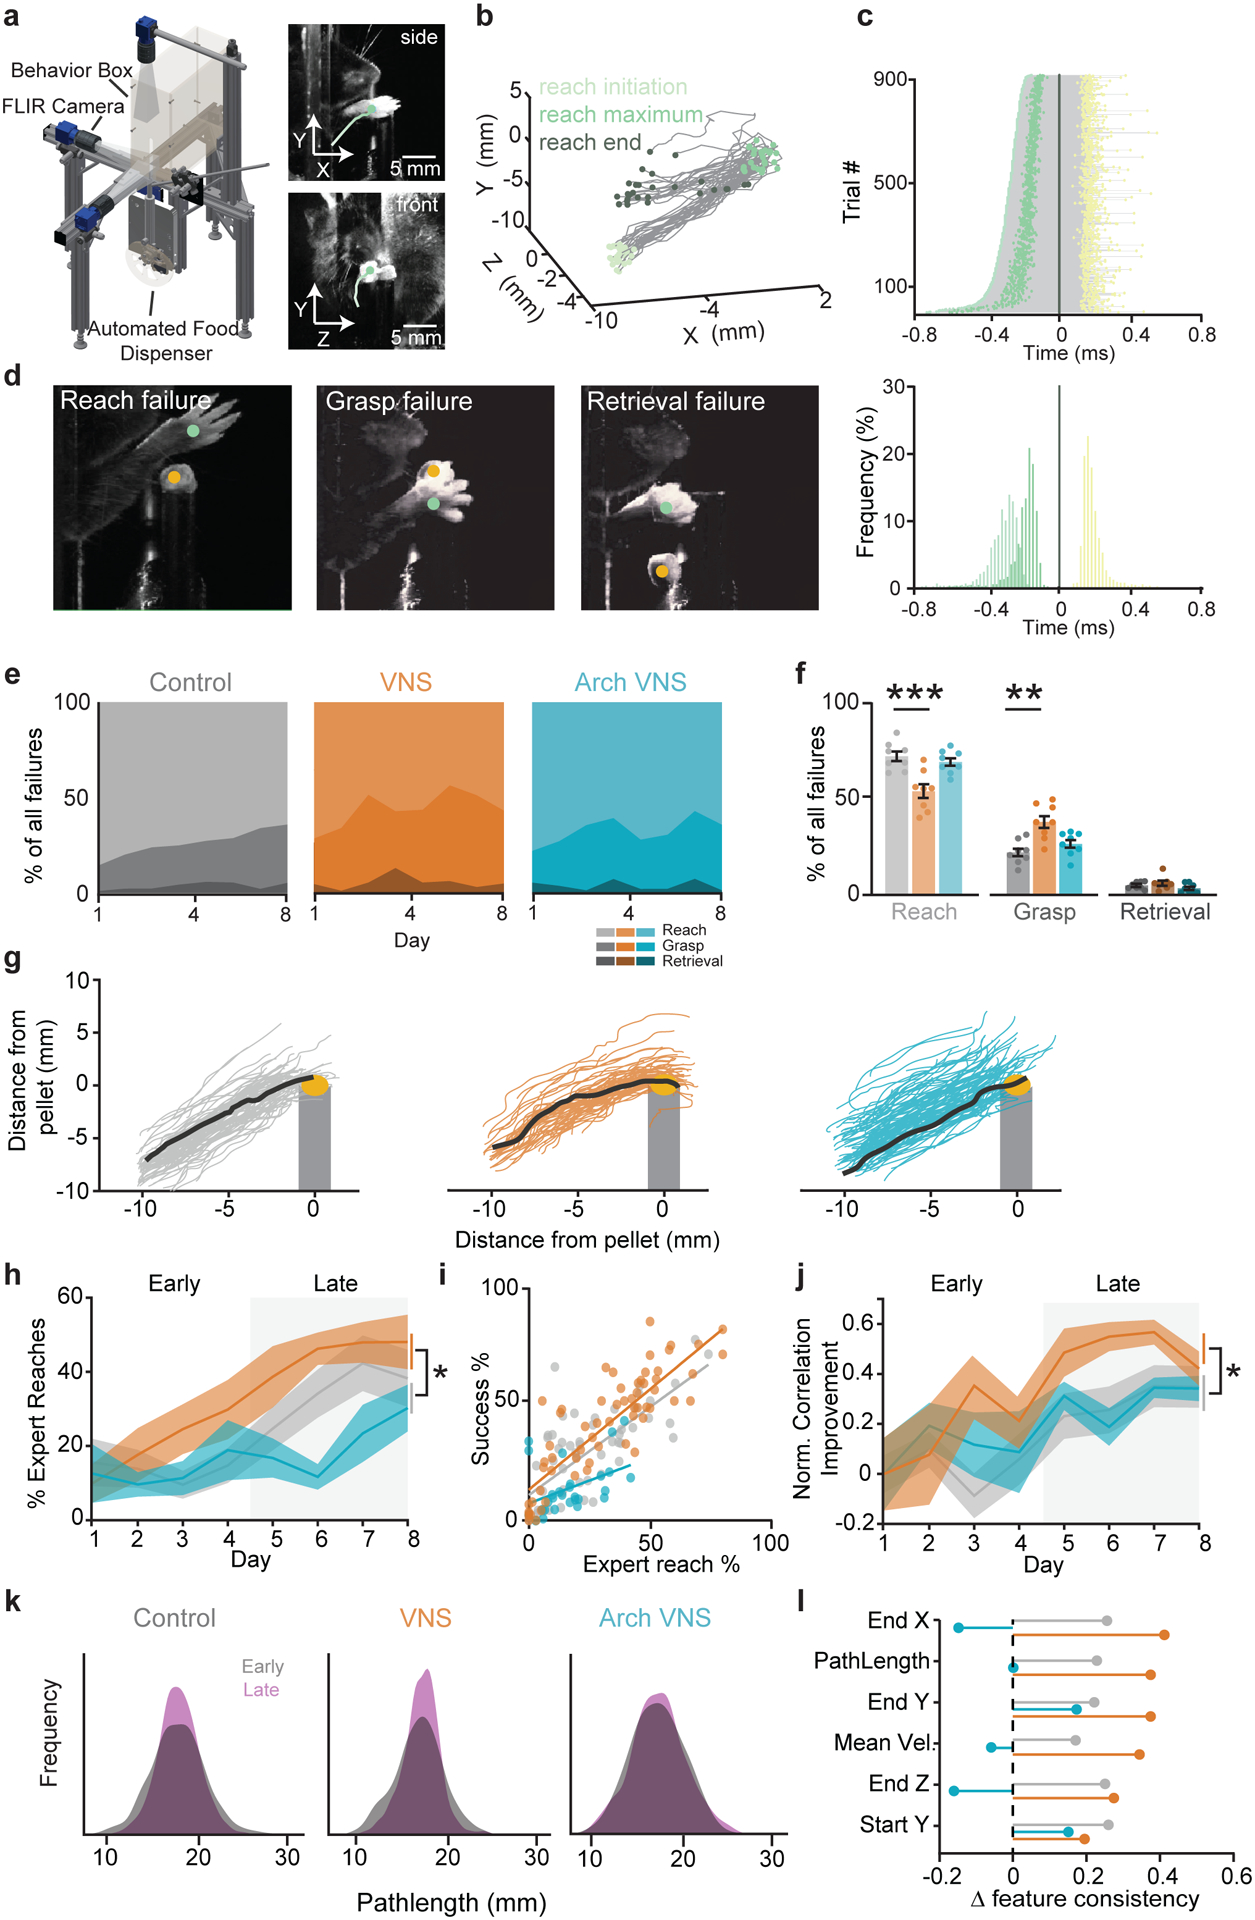
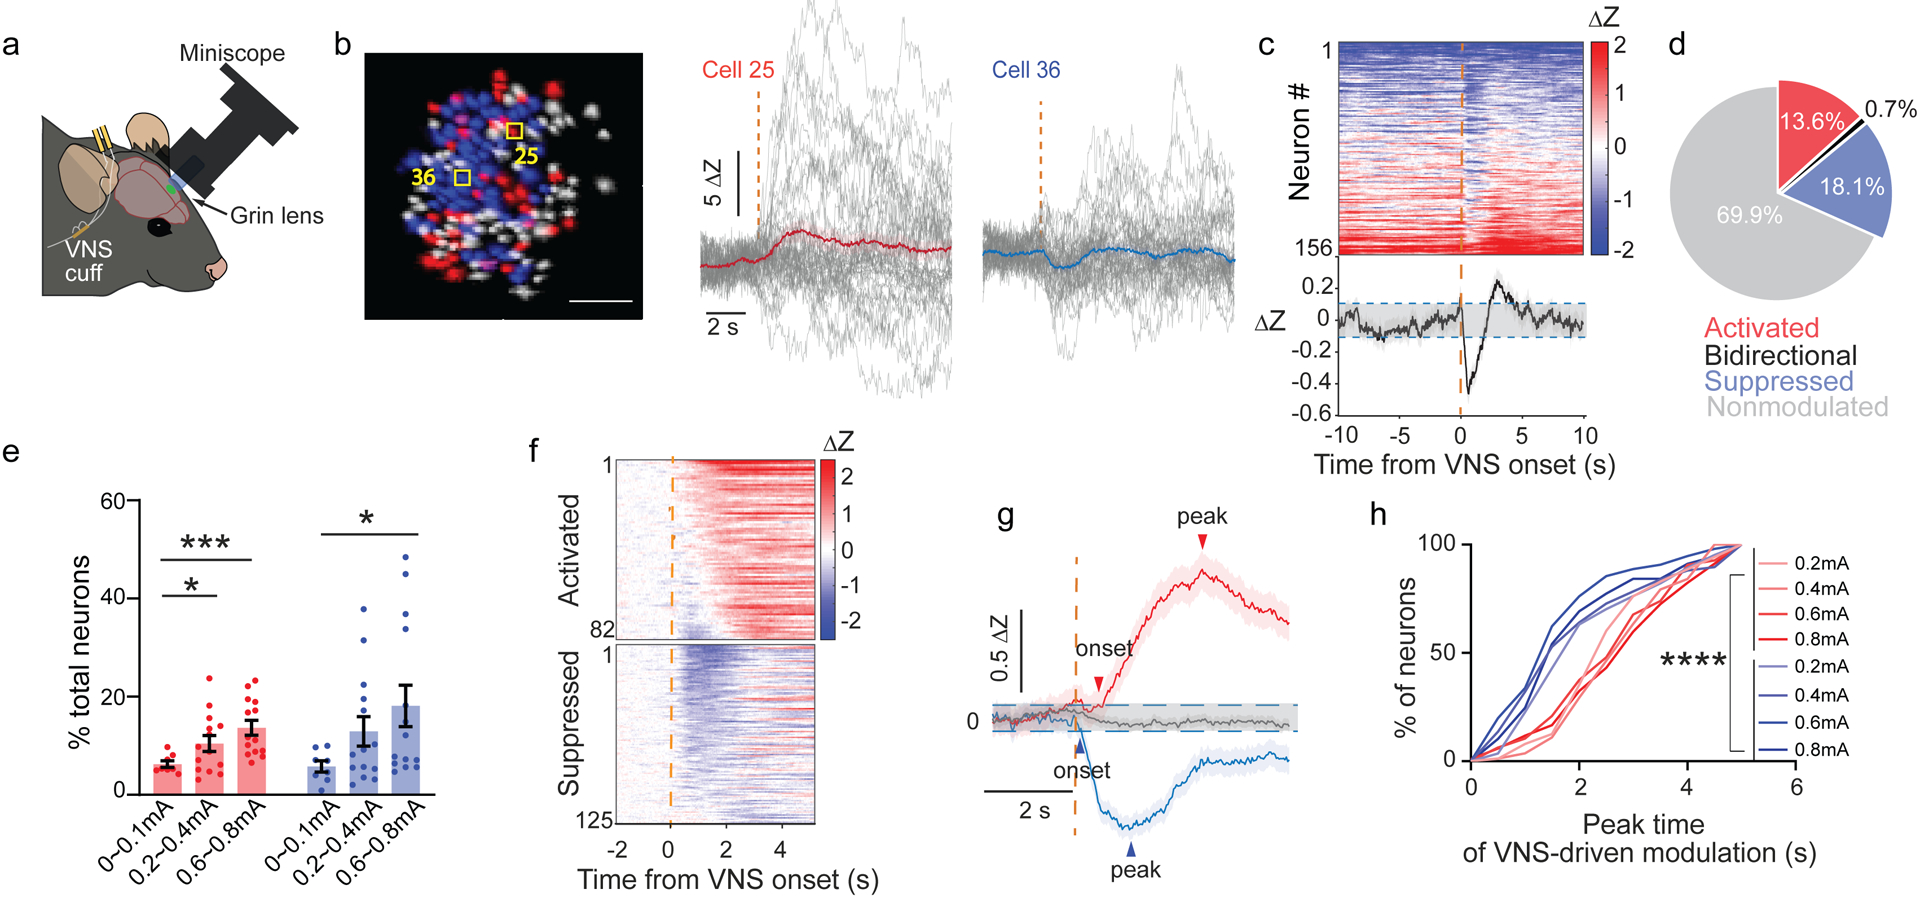
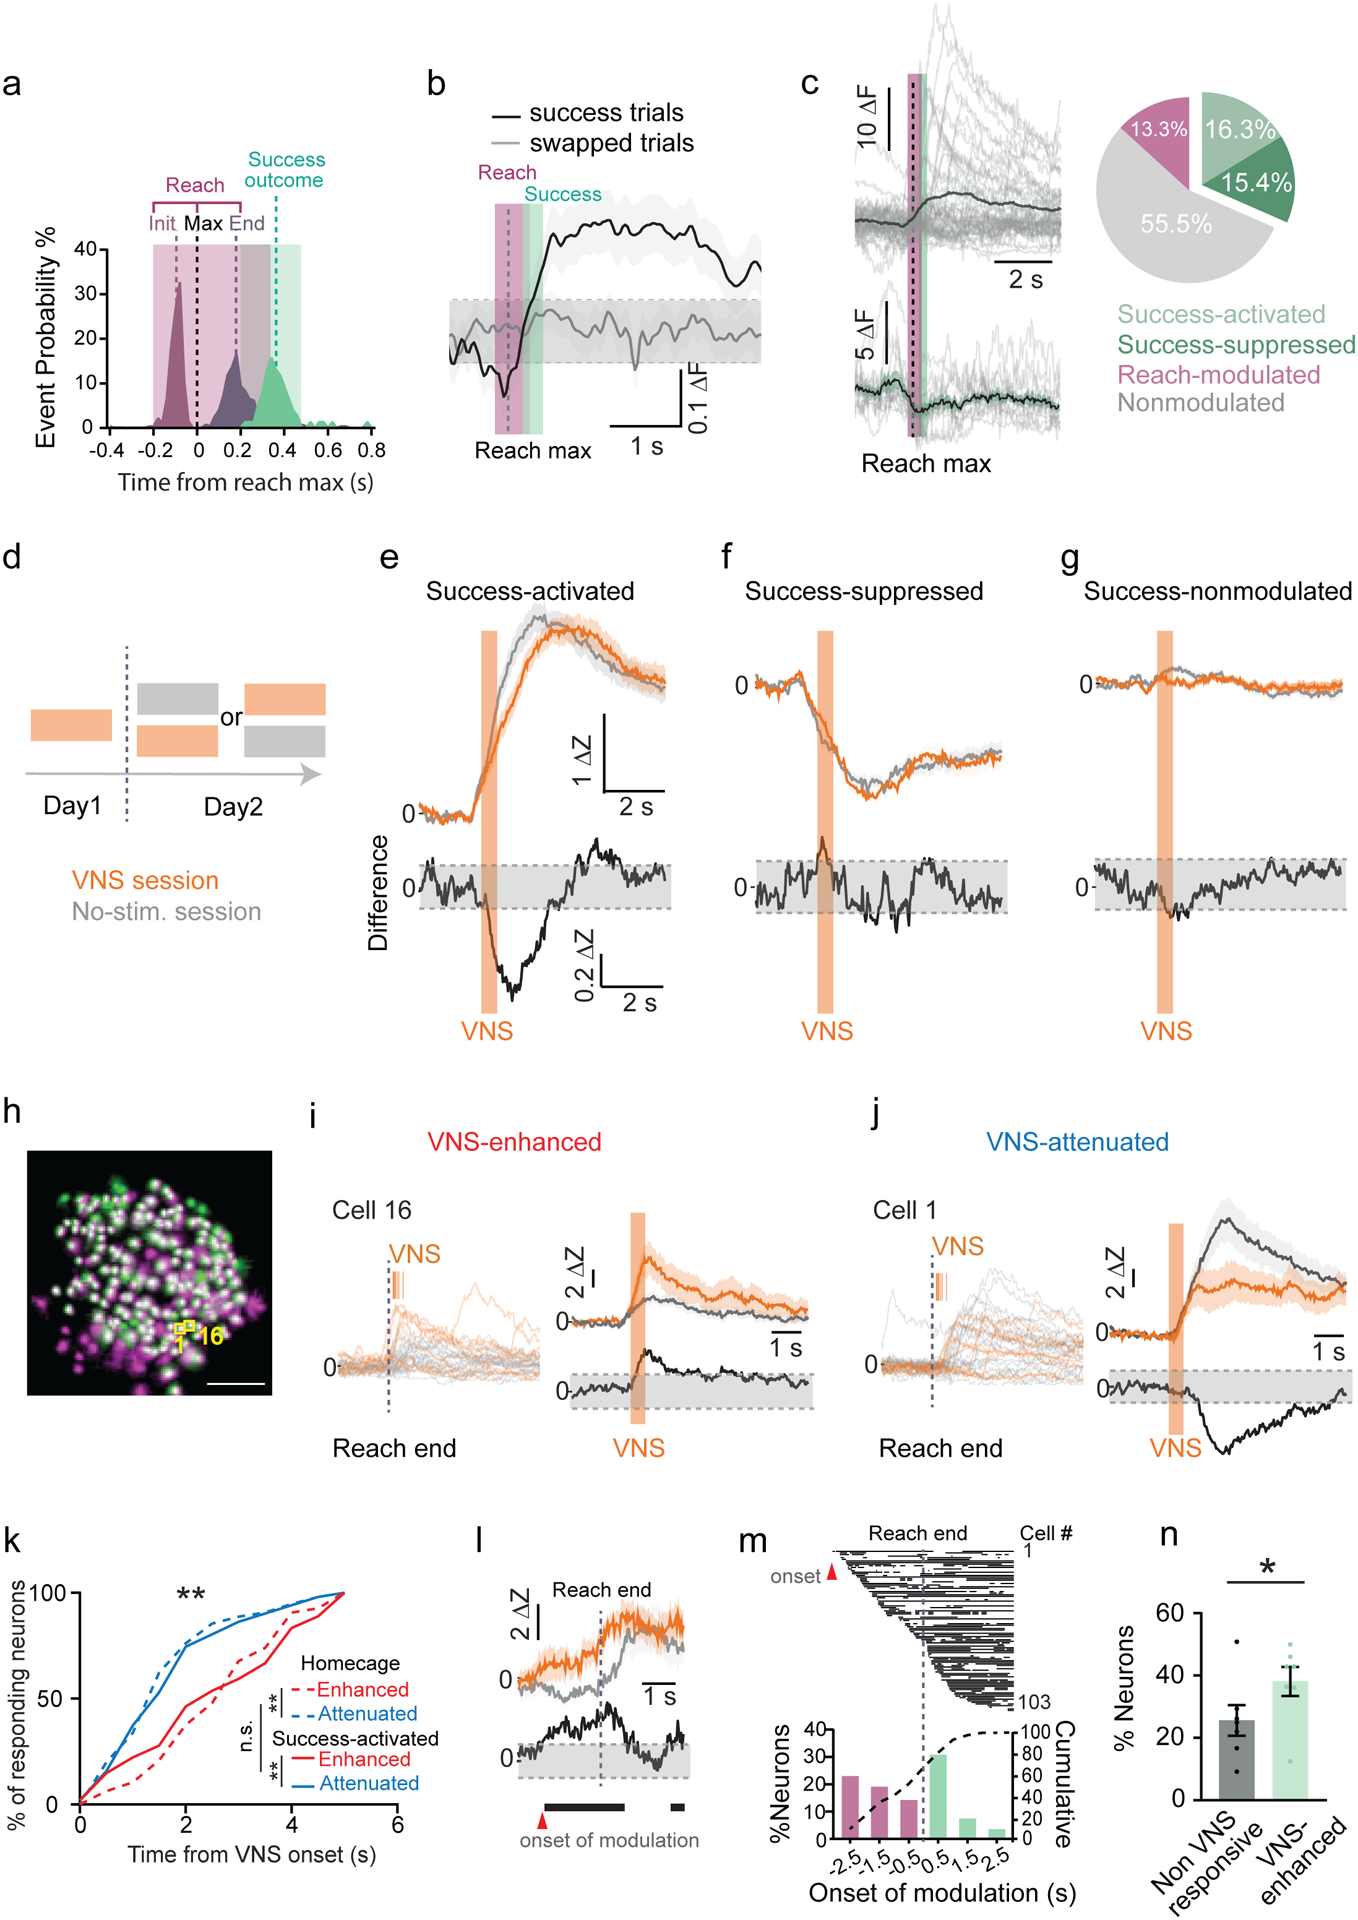
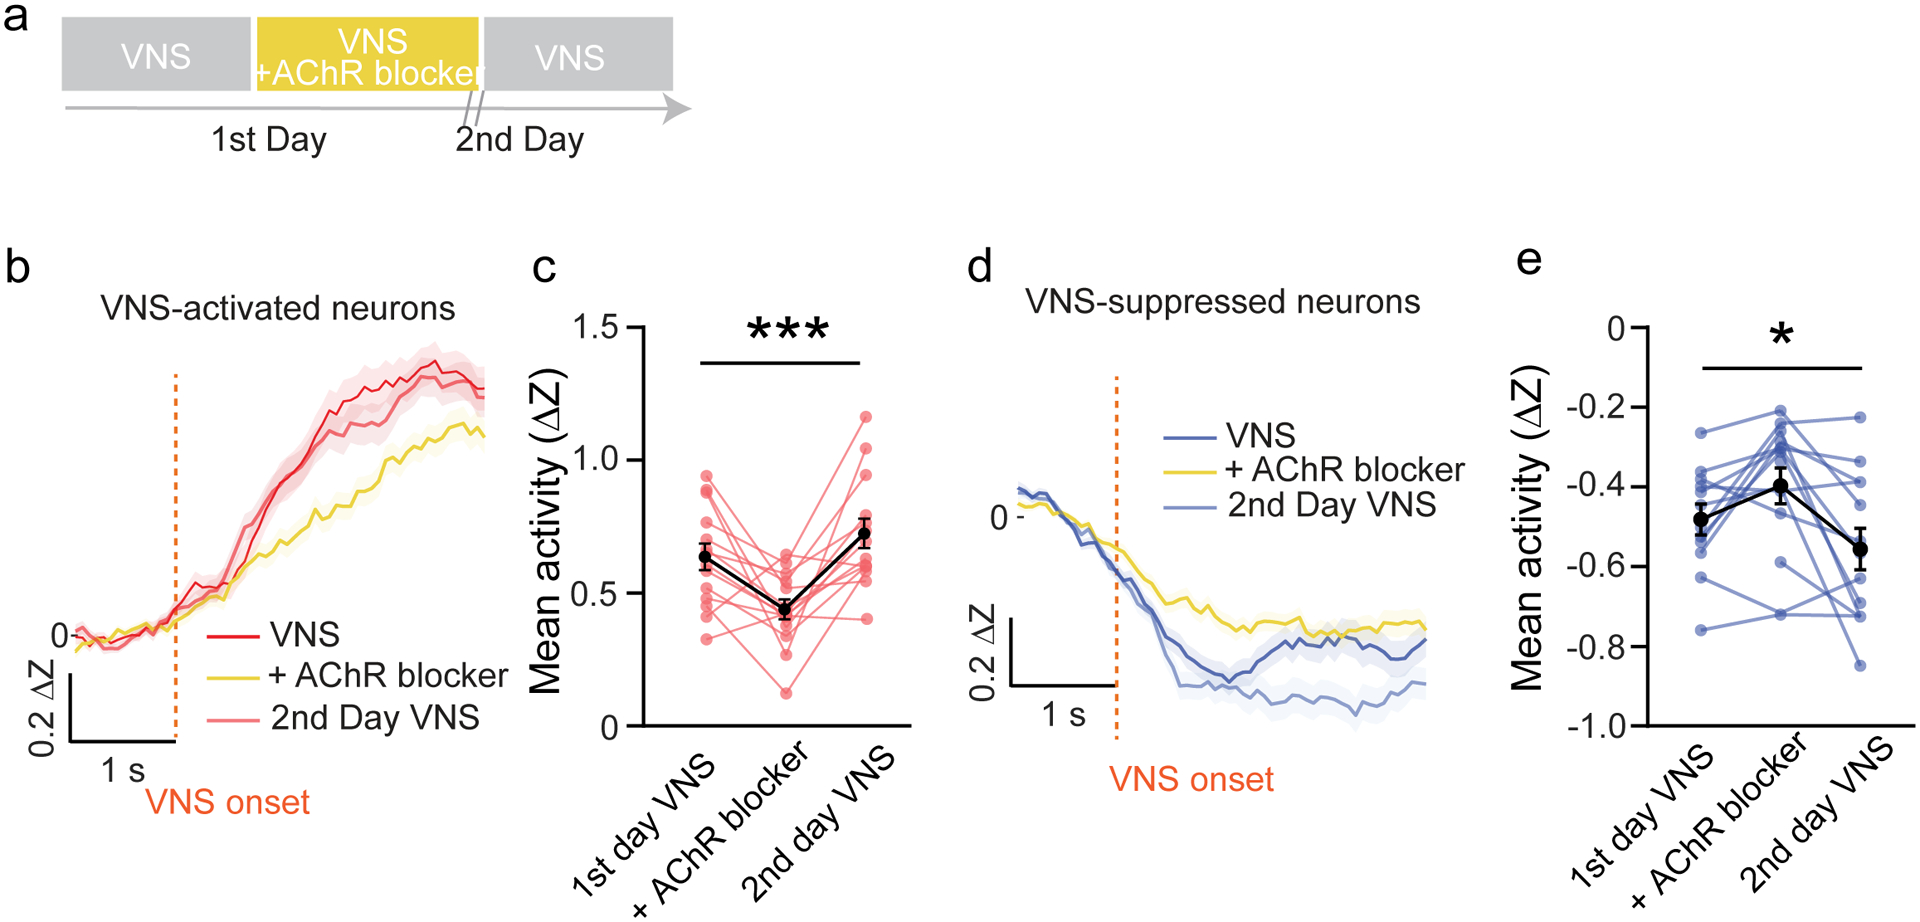
Vagus nerve stimulation (VNS) is a neuromodulation therapy for a broad and expanding set of neurologic conditions. However, the mechanism through which VNS influences central nervous system circuitry is not well described, limiting therapeutic optimization. VNS leads to widespread brain activation, but the effects on behavior are remarkably specific, indicating plasticity unique to behaviorally engaged neural circuits. To understand how VNS can lead to specific circuit modulation, we leveraged genetic tools including optogenetics and in vivo calcium imaging in mice learning a skilled reach task. We find that VNS enhances skilled motor learning in healthy animals via a cholinergic reinforcement mechanism, producing a rapid consolidation of an expert reach trajectory. In primary motor cortex (M1), VNS drives precise temporal modulation of neurons that respond to behavioral outcome. This suggests that VNS may accelerate motor refinement in M1 via cholinergic signaling, opening new avenues for optimizing VNS to target specific disease-relevant circuitry.

Keywords: basal forebrain; cholinergic; learning; motor cortex; motor learning; neuromodulation; outcome; plasticity; reinforcement; vagus nerve stimulation.


Conflict of interest statement

Declaration of interests The authors declare no competing interests.

Figures

Figure 1 |
Figure 1 |. VNS modulates forelimb reach learning and requires temporally specific stimulation.
a, VNS surgical approach b, Behavior timeline c, Stimulation protocol, with Reach and Success VNS applied before and after reach, respectively. d-f, Random VNS, Reach VNS, and Success VNS success rate across 14 sessions of training. g, Comparison of mean performance across all days between control and stimulated groups (Success VNS: p=0.0065, f=9.24, Random VNS: p>0.05, Reach VNS: p>0.05, REML). Shaded boxes denote s.e.m. h, Comparison of mean success rate for control and Random VNS mice during early (p=0.028, f=7.07, Student T test) and late learning (p>0.05). i, Comparison of mean success rate for control and Reach VNS mice during early and late learning (p>0.05). j, Comparison of mean success rate for control and Success VNS mice during early (p=0.0031) and late learning (p=0.0126). k&l, VNS mice performed a conditioned place preference test after 3 days being stimulated in one of two distinct rooms. m&n, In-session learning trajectories for each group. o, Comparison of within session learning between all groups across 4 days of learning. In all figures, *p < 0.05, **p < 0.01, ***p< 0.001 bars and error bars represent the mean ± s.e.m.
Figure 2 |
Figure 2 |. VNS improves success rate within sessions and in learned mouse during rehearsal of forelimb reach task.
a, Trials before and after a stimulated success are investigated in success VNS. b, Comparison of success rate for reaches preceding or following stimulated reach. c, For Success VNS, day 7 and 14 trials are divided into equal blocks of unstimulated and stimulated trials. d, Comparison of unstimulated (light orange) and sham (grey) trials on day 14 (p=0.0059, t=3.34, Student’s T test). e, Comparison of stimulated (dark orange) and unstimulated (light orange) trials on days 7 & 14 (Day 7: p>0.05; Day 14: p=0.0499, t=2.57, Ratio paired t test). f, Reach VNS schematic. g, Success rates across training sessions for Sham (grey), Stimulated Reach VNS (dark green), and Unstimulated Reach VNS (light green). h, Comparison of Stimulated Reach VNS and Sham VNS trials in early (p>0.05) and late learning (p=0.024, t=2.47, Student’s T test). i, Comparison between stimulated Reach VNS and unstimulated Reach VNS trails in early (p=0.004, t=3.98, paired t test) and late learning (p<0.0001, t=10.08, paired t test). j, Success VNS and Reach VNS applied during rehearsal of reach task in trained mice. k, Stimulated Reach VNS trials improve success rate during rehearsal (p=0.015, t=4.058, paired t test). l, Stimulated Success VNS trials improve success rate during rehearsal (p=0.005, t=5.62, paired t test). m, Normalized improvement of Stimulated Reach VNS (p=0.047, t=3.56) and stimulated Success VNS trials (p=0.028, t=4.16) compared to unstimulated trials (Sidak’s multiple comparison’s test in RM one-way ANOVA).
Figure 3 |
Figure 3 |. VNS drives BF neural activity in anesthetized and awake mice.
a, Schematic of experimental set up. b, Example raster (top) and average firing rate from a response to VNS. Grey box denotes stimulus delivery. c, Average responses of all recorded neurons to VNS (grey box). d, % of neurons that respond to VNS (N = 5 mice, 53 neurons). e, Average activity of all ‘activated’ neurons in response to VNS. Dashed lines mark significance, shading represents SE. f, Recordings with optrodes were targeted at the HDB in ChAT-ChR2 transgenic mice under light anesthesia. Green fluorescence denotes the presence of ChR2. g, Example cholinergic neuron responding consistently to pulses of 488 nm light. h, Average activity of all cholinergic neurons during opto-tagging. Each row represents a neuron. i, Stimulus-associated latency tests (SALT) separate light responsive neurons from non-light responsive neurons. j, Mean baseline FR of cholinergic and non-cholinergic neurons (p=0.013, N = 5 mice, 53 neurons). k, Percent of neurons categorized as cholinergic (light green) and non-cholinergic (dark green) (N = 6 mice, 76 neurons). l, Percent of units that are VNS-responsive in cholinergic (left) and noncholinergic (right) populations. m, Average response to VNS for all ‘activated’ neurons. n, Mean peak activation during VNS. o, Average delay of peak activation from VNS onset. p, Mean duration of significantly elevated activity after VNS (cholinergic vs. awake p=0.0087, non-cholinergic vs. awake p=0.0003).
Figure 4 |
Figure 4 |. Success-paired VNS motor learning enhancement requires cholinergic neuromodulation.
a, A subset of VNS-implanted ChAT-Cre transgenic mice received injections of viral constructs containing Archaerhodpsin3.0 in the BF. b, Timeline of experimental set up and training. Each training session lasts for 20 minutes. c, Depending on cohort, mice receive VNS, or continuous 532 nm light and VNS simultaneously, after successful reach attempts. d, Average success rate for all mice over the course of learning (VNS N=11, Arch+VNS N=9, Control N=12). e, Mean performance across all days between VNS and control (p=0.0409 ,top), and Arch+VNS and control (p>0.05 ,bottom). f, Mean success rate of all groups between early and late phases (Control p=0.0001, VNS p=0.0009, Arch VNS p=0.0379). g, Mean success rate for control and VNS mice during early (p=0.0458) and late (p=0.0001) learning phases and control and Arch+VNS mice (p>0.05).
Figure 5 |
Figure 5 |. VNS improves performance through improved consolidation of reach trajectory.
a, The Closed-loop automated reaching apparatus (CLARA) provides 3D tracking of the paw and pellet. b, Example trajectories and automatically generated reach events (one control session). c, Top: duration of all stimulated control trials, yellow dot denotes stimulus delivery (180±5ms). Bottom: a histogram of reach timepoints normalized to reach end. d, Example images of the subcategories of failed reaches (see Methods). e, Breakdown of failure outcomes for each group over 8 days of learning. Light colors: reach failures; intermediate: grasp failures; dark: retrieval failures. f, A comparison of types of failed attempts between control and VNS (reach errors: p=0.0005; grasp errors: p=0.0035) and between control and Arch+VNS mice (p>0.05, VNS N=8, Arch+VNS N=8, Control N=8). g, Examples outward trajectories during a session on day 8. Black lines represent each mouse’s ‘expert reach’. h, % of expert reaches. Comparisons were made for the mean ‘expert’ reaches in the late learning phase (grey box) between control and VNS mice (p=0.0142) and control and Arch+VNS mice (p>0.05, VNS N=8, Arch+VNS N=6, Control N=8). i, Correlation of expert reaches and task performance for all mice, R2=0.62. j, Improvement in reach failures toward an expert trajectory (normalized to day 1). Comparisons were made during late learning between control and VNS mice (p=0.0455) and control and Arch+VNS mice (p>0.05). k, Distribution of trajectory lengths from all failure attempts during early (grey) and late (purple) learning phases. l, Normalized improvement in reach features from early to late learning phases.
Figure 6 |
Figure 6 |. VNS drives acute neural suppression and activation in forelimb motor cortex
a, Schematic of experiment design. b, Left: representative neural ROIs from the field of view of one mouse M1 (n = 156 neurons): VNS-activated (red) and suppressed (blue), scale bar = 100 μm. Middle and right: representative neurons’ Ca2+ responses aligned by VNS onset (gray: individual trials; red: VNS-activated; blue: VNS-suppressed). c, Top: individual neurons’ average response z-scored to inactive phases of all neurons from the representative mouse in b; bottom: average neural responses of all neurons from the same mouse. d, Average % of total neurons activated, suppressed, bidirectionally modulated after 0.6~0.8mA VNS delivery (N = 7 mice, 767 neurons). e, % of total neurons that are activated or suppressed by VNS across different current amplitudes. (N = 7 mice, n= 747~807 neurons, One-way ANOVA and multiple group comparison to 0~0.1 mA group). f, Neural response heatmap of all activated neurons and all suppressed neurons aligned at VNS onset. g, Average neural activity of all activated neurons and all suppressed neurons aligned at VNS onset (N=7 mice, 82 activated, 125 suppressed, 0.6mA VNS). h, Cumulative distribution of neural response peak time of activated and suppressed neurons (See Methods, 82 to 151 neurons from each group, Kruskal-Wallis test followed by Dunn’s multiple comparisons test, p < 0.0001).
Figure 7 |
Figure 7 |. Success VNS selectively modulates activities of a subpopulation of task-activated M1 neurons in the reach task.
a, Peri-event histogram of the task related events aligned at reach max (N = 6 control mice, day 4, n = 278success trials). Magenta indicates full reaches, green success recognition. b, Average neural activity of success trials (black) and random control trials (grey, n = 488 neurons). Gray dashed line indicates 2 s.d. from the baseline mean. c, Left: representative neural responses: top success-activated, bottom success-suppressed, gray individual trials. Right: % neurons modulated in the task (903 neurons; 16.3 ± 6.4% success-activated, 15.4 ± 10.2% success-suppressed, 13.3 ± 5.5% preparation/reach modulated). d, Assignment of VNS or no-stimulation sessions. e-g, Top: Average responses of success-activated (d, n=115 & 101), success-suppressed (e, n=122 & 92) and success-nonmodulated neurons (f, n=383 & 394) in VNS (orange) and in no-stimulation session (gray). Bottom: the difference trace. h, Registered neurons (white) in VNS (green) and no-stimulation session (Magenta). i&j, Left: trial responses of success-activated neurons in no-stimulation and VNS session (orange ticks: VNS onset). Right: the average and difference responses aligned by VNS onset. k, Cumulative distribution of neural response onset (See Methods) of VNS-enhanced or attenuated neurons in homecage and success-activated populations (Homecage p=0.0001, Success-activated p=0.033, Kruskal-Wallis test). l, Example success-activated neuron modulated by VNS (supp. Fig. 6h) also have higher neural activity before reach end in VNS session. Arrowhead: onset of increased activity. m, Onset timing histogram of VNS-driven modulation of success-activated neurons. n, % neurons modulated in reach in VNS-nonmodulated versus VNS-enhanced neurons.
Figure 8 |
Figure 8 |. VNS driven acute neural modulation is mediated through AChRs.
a, Diagram of experimental design. b&d, Average neural activity of VNS-activated neurons (b, n = 104 ~116 neurons) or VNS-suppressed neurons (d, n = 124~143 neurons) in control VNS session, VNS session with AChR blocker and the 2nd day recovery VNS session. c, Average neural activity comparison of VNS-activated neurons quantified from 0.8 to 2.8 s after VNS onset (See Methods, N = 7 mice × two repeats each mouse, Repeated measures ANOVA, p < 0.001). e, Average neural activities comparison of VNS suppressed-neurons quantified from 0.2 to 1.6 s from VNS onset (N = 7 mice × two repeats each mouse, Repeated measures ANOVA, p = 0.02).

Comment in

Similar articles

Cited by

References

    1. Adler A, Zhao R, Shin ME, Yasuda R, Gan W-B, 2019. Somatostatin-Expressing Interneurons Enable and Maintain Learning-Dependent Sequential Activation of Pyramidal Neurons. Neuron 102, 202–216.e7. 10.1016/j.neuron.2019.01.036 - DOI - PMC - PubMed
    1. Aronov D, Andalman AS, Fee MS, 2008. A Specialized Forebrain Circuit for Vocal Babbling in the Juvenile Songbird. Science 320, 630–634. 10.1126/science.1155140 - DOI - PubMed
    1. Athalye VR, Carmena JM, Costa RM, 2020. Neural reinforcement: re-entering and refining neural dynamics leading to desirable outcomes. Current Opinion in Neurobiology, Neurobiology of Behavior 60, 145–154. 10.1016/j.conb.2019.11.023 - DOI - PubMed
    1. Athalye VR, Ganguly K, Costa RM, Carmena JM, 2017. Emergence of Coordinated Neural Dynamics Underlies Neuroprosthetic Learning and Skillful Control. Neuron 93, 955–970.e5. 10.1016/j.neuron.2017.01.016 - DOI - PubMed
    1. Athalye VR, Santos FJ, Carmena JM, Costa RM, 2018. Evidence for a neural law of effect. Science 359, 1024–1029. 10.1126/science.aao6058 - DOI - PubMed

Publication types

Substances