. 2022 Aug 15;209(4):772-782.
doi: 10.4049/jimmunol.2200154.

Single-Cell Analysis Reveals the Range of Transcriptional States of Circulating Human Neutrophils

Affiliations

Single-Cell Analysis Reveals the Range of Transcriptional States of Circulating Human Neutrophils

Gustaf Wigerblad et al. J Immunol. .

Abstract

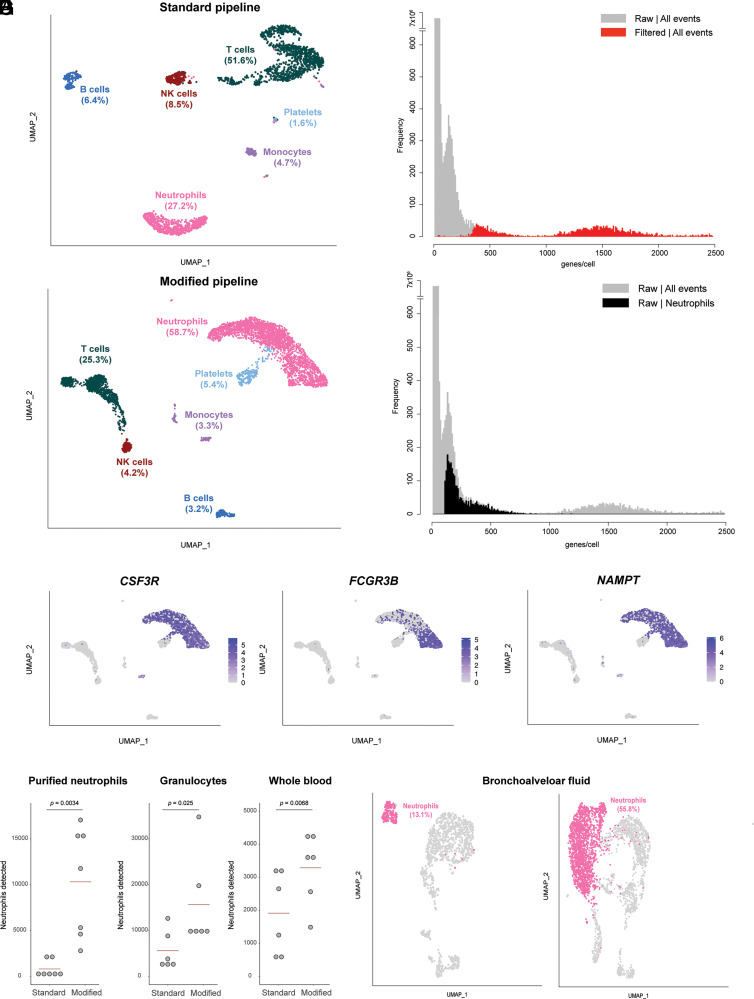
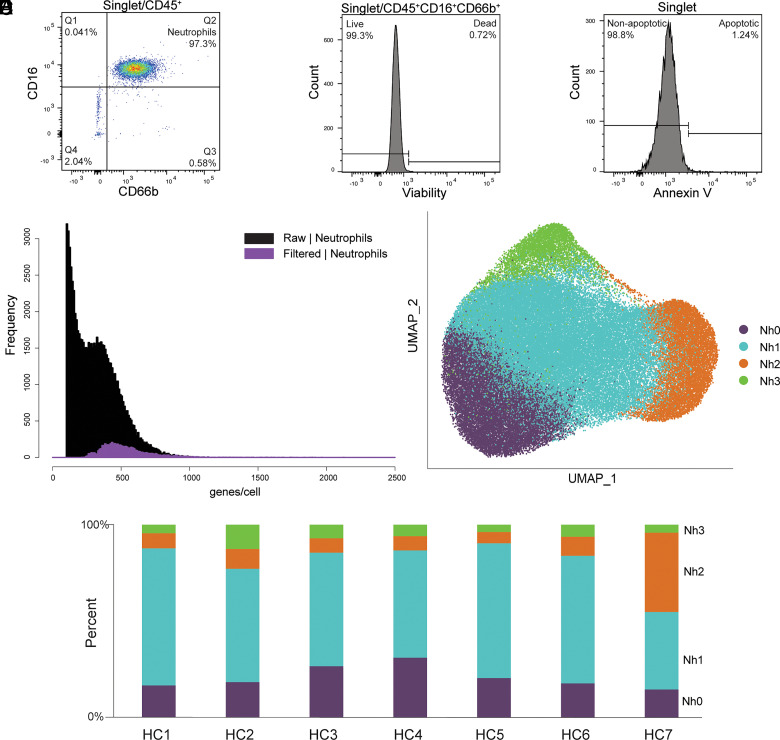
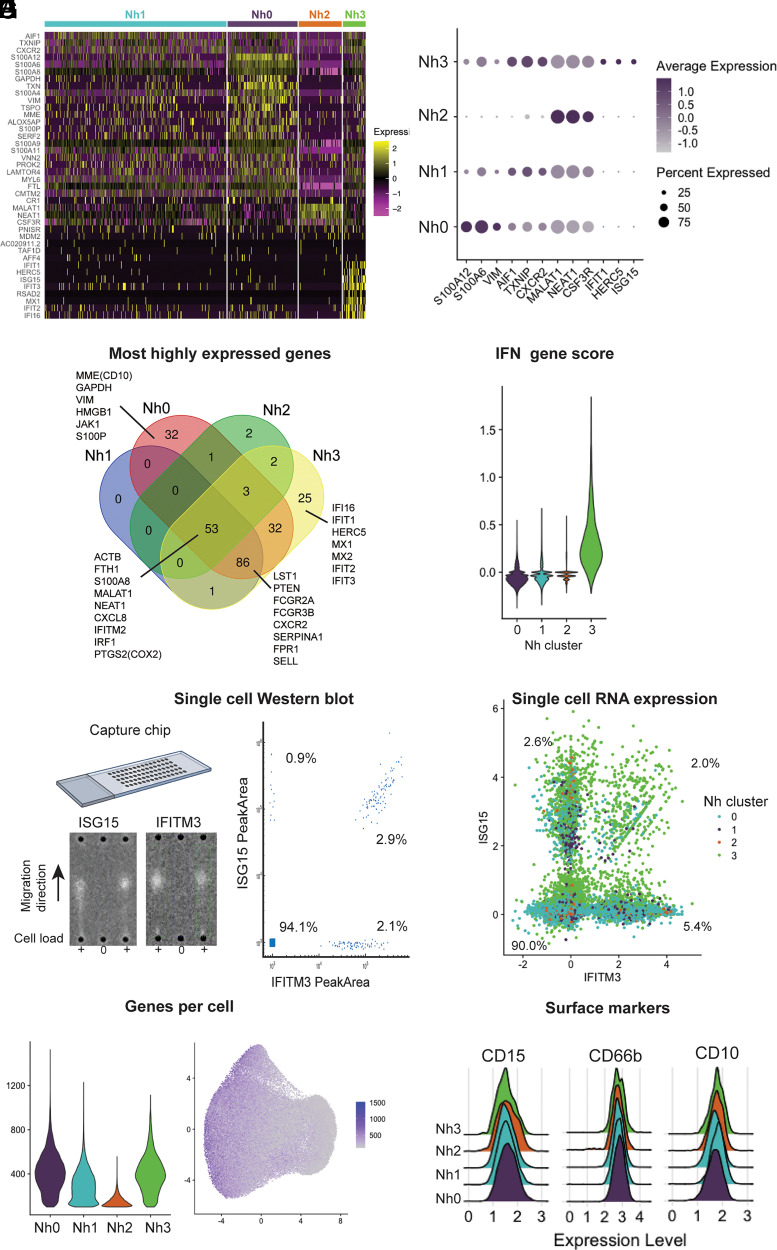
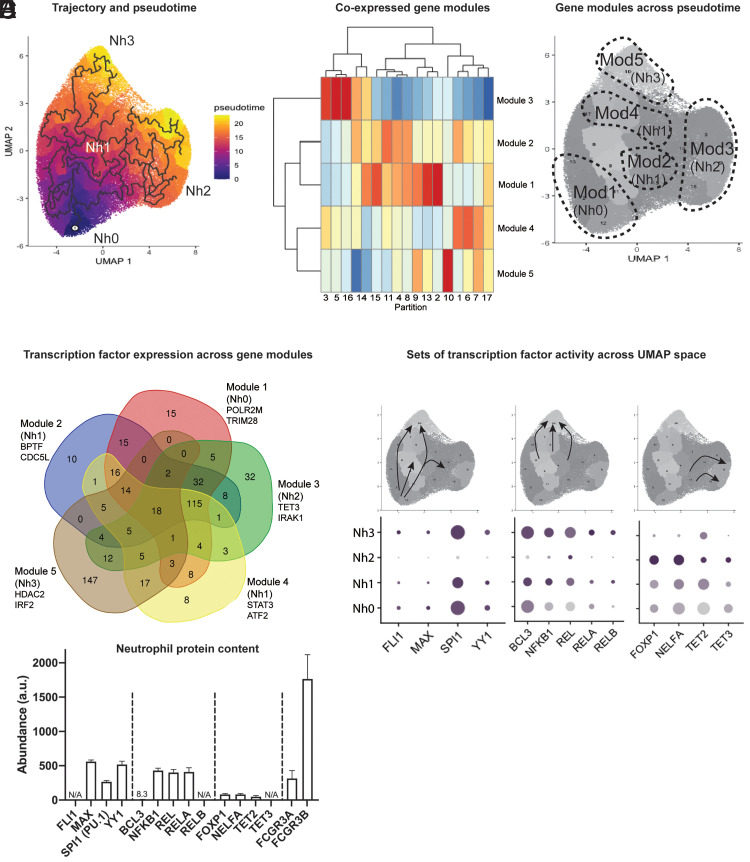
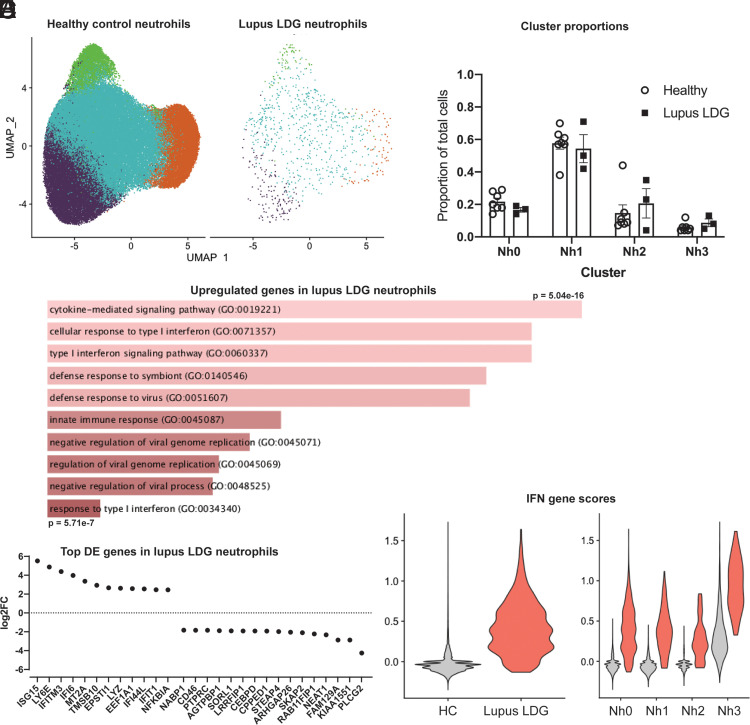
Neutrophils are the most abundant leukocytes in human blood and are essential components of innate immunity. Until recently, neutrophils were considered homogeneous and transcriptionally inactive cells, but both concepts are being challenged. Single-cell RNA sequencing (scRNA-seq) offers an unbiased view of cells along a continuum of transcriptional states. However, the use of scRNA-seq to characterize neutrophils has proven technically difficult, explaining in part the paucity of published single-cell data on neutrophils. We have found that modifications to the data analysis pipeline, rather than to the existing scRNA-seq chemistries, can significantly increase the detection of human neutrophils in scRNA-seq. We have then applied a modified pipeline to the study of human peripheral blood neutrophils. Our findings indicate that circulating human neutrophils are transcriptionally heterogeneous cells, which can be classified into one of four transcriptional clusters that are reproducible among healthy human subjects. We demonstrate that peripheral blood neutrophils shift from relatively immature (Nh0) cells, through a transitional phenotype (Nh1), into one of two end points defined by either relative transcriptional inactivity (Nh2) or high expression of type I IFN-inducible genes (Nh3). Transitions among states are characterized by the expression of specific transcription factors. By simultaneously measuring surface proteins and intracellular transcripts at the single-cell level, we show that these transcriptional subsets are independent of the canonical surface proteins that are commonly used to define and characterize human neutrophils. These findings provide a new view of human neutrophil heterogeneity, with potential implications for the characterization of neutrophils in health and disease.


Conflict of interest statement

The authors have no financial conflicts of interest.

Figures

FIGURE 1.
FIGURE 1.
Pipeline for identification of neutrophils in scRNA-seq data. (A) Distribution of cell types identified in RBC-depleted whole blood in a scRNA-seq analysis performed with the filtered matrix output from Cell Ranger (standard pipeline). Data from one capture are shown. (B) Frequency distribution of the number of features per barcode (genes per cell) for the dataset shown in (A), comparing data from the filtered (red) versus raw (gray) matrices. (C) Distribution of cell types identified in the dataset shown in (A) when the analysis is performed with the raw matrix output from Cell Ranger (modified pipeline). (D) Frequency distribution of the number of features per barcode (genes per cell) for the dataset shown in (A) and (C), with the distribution for cells identified as neutrophils in the analysis of the raw matrix (modified pipeline) highlighted in black. (E) Feature plot on the UMAP shown in (C) for three genes expected to be highly expressed in human neutrophils. (F) Number of neutrophils detected by the standard or modified pipelines in samples from the same subjects processed by three methods. Each dot represents one biological replicate (one unrelated healthy donor). Statistical testing results are from a paired t test. (G) Proportion of neutrophils identified in a published scRNA-seq dataset of bronchoalveolar lavage fluid from patients with severe COVID-19 infection, comparing the results of the standard pipeline (left) with those of the modified pipeline (right).
FIGURE 2.
FIGURE 2.
Circulating human neutrophils consist of distinct transcriptional subsets. (AC) Flow cytometry documentation of human neutrophil purity and viability. A representative sample is shown for each panel. Purity was defined as the proportion of CD66b+CD16+ events among CD45+ events, as shown in (A). Viability was assessed by uptake of an amine-binding dye, as shown in (B). Evidence of early apoptosis was assessed by Annexin V staining, as shown in (C). Results for each sample are in Supplemental Table II. (D) Frequency distribution of the number of features per barcode (genes/cell) in the purified neutrophils dataset, comparing data from the filtered (purple) and raw (black) matrices. (E) Two-dimensional projection (UMAP) of 72,183 purified circulating human neutrophils showing clusters Nh0–Nh3. (F) Bar graph showing the cluster proportion of the neutrophils from each of seven healthy controls (HC1–HC7).
FIGURE 3.
FIGURE 3.
Neutrophil transcriptional subsets vary by type and number of genes expressed. (A) Heatmap of the top marker genes from each cluster. Each row represents one gene, and each column represents one cell. The cells corresponding to each cluster are grouped, as indicated by the colored bars. The top marker genes were defined by their adjusted p value and log2 (fold difference) on differential expression analysis (expression in a cluster versus expression in all other clusters). Genes with adjusted p = 0 and log2 (fold difference) ≥ 0.5 in any cluster are shown. (B) Dot plot of the top three marker genes for each neutrophil cluster, showing the average expression level and the percent of cells expressing the gene in each cluster. (C) Venn diagram displaying the intersection of the top genes in each cluster by absolute expression. (D) Violin plot showing the score per cluster for a panel of IFN-related genes, as described by Aran et al. (27). (E) Single-cell Western blot on 3300 neutrophils, with Abs against the proteins ISG15 and IFITM3. A representative blot is shown on the left, and a bivariate plot of the estimated single-cell abundances (peak areas) is displayed on the right. (F) Neutrophil single-cell RNA expression of the same targets as in (E): ISG15 and IFITM3. (G) Violin plot of the number of genes per cell in each cluster (left) and distribution of the number of genes per cell on the UMAP projection (right). (H) Ridge plots showing the distribution of CD10, CD15, and CD66b surface protein expression among cells in each transcriptional cluster. Surface expression and RNA-seq were measured simultaneously, by Cellular Indexing of Transcriptomes and Epitopes by Sequencing (CITE-seq). Data for 11 additional neutrophil surface markers are shown in Supplemental Fig. 2.
FIGURE 4.
FIGURE 4.
Nh2 and Nh3 cells are end points in the transcriptional trajectory of circulating human neutrophils. (A) Trajectory analysis showing the learned graph on the UMAP space with the pseudotime ordering by color. (B) Heatmap showing unsupervised classification of genes that vary across clusters of circulating neutrophils into five clusters of coexpressed genes. (C) Correspondence between the five modules of coexpressed genes and the four transcriptional clusters of circulating human neutrophils. (D) Venn diagram of transcription factors associated with cis-regulatory elements most likely to regulate the coexpressed genes in each module. Gene lists from the modules were used as input in BART. The overlap across modules for the top-ranking transcription factors (Irwin–Hall p < 0.01) is shown. (E) Transcription factor gene expression changes along the transcriptional trajectory of circulating human neutrophils. Three patterns are shown: transcription factors expressed along the Nh0-Nh1-Nh3 trajectory, but not in Nh2 cells (left); transcription factors expressed in the transition from Nh1 to Nh3 cells (middle); and transcription factors expressed in the transition from Nh1 to Nh2 cells (right). (F) Mass spectrometry data from bulk neutrophil preparations obtained from five healthy donors, showing relative protein abundances for the transcription factors in (E), with FCGR3A and FCGR3B as abundance references.
FIGURE 5.
FIGURE 5.
LDGs from SLE patients show upregulated IFN-induced gene expression but normal proportions of Nh clusters. (A) UMAP of healthy control (n = 7) neutrophils integrated with SLE LDGs (n = 3), split between healthy control and lupus cells. (B) Nh cluster proportions in healthy donor neutrophils and lupus LDGs. (C) Gene Ontology terms for the top 50 upregulated genes in a pseudobulk comparison between healthy neutrophils and lupus LDGs. (D) Top upregulated and downregulated genes based on log2 (fold change), in a pseudobulk comparison between healthy neutrophils and lupus LDGs. (E) Total IFN-gene score for healthy control and lupus LDG (left) and IFN-gene scores by cluster (right).

References

    1. Geginat J., Paroni M., Maglie S., Alfen J. S., Kastirr I., Gruarin P., De Simone M., Pagani M., Abrignani S.. 2014. Plasticity of human CD4 T cell subsets. Front. Immunol. 5: 630. - PMC - PubMed
    1. Muranski P., Restifo N. P.. 2013. Essentials of Th17 cell commitment and plasticity. Blood 121: 2402–2414. - PMC - PubMed
    1. Sica A., Mantovani A.. 2012. Macrophage plasticity and polarization: in vivo veritas. J. Clin. Invest. 122: 787–795. - PMC - PubMed
    1. Ng L. G., Ostuni R., Hidalgo A.. 2019. Heterogeneity of neutrophils. Nat. Rev. Immunol. 19: 255–265. - PubMed
    1. Silvestre-Roig C., Fridlender Z. G., Glogauer M., Scapini P.. 2019. Neutrophil diversity in health and disease. Trends Immunol. 40: 565–583. - PMC - PubMed

Publication types

Substances