. 2022 Aug 25;32(8):1529-1541.
doi: 10.1101/gr.276766.122.

ATAC-STARR-seq reveals transcription factor-bound activators and silencers within chromatin-accessible regions of the human genome

Affiliations

ATAC-STARR-seq reveals transcription factor-bound activators and silencers within chromatin-accessible regions of the human genome

Tyler J Hansen et al. Genome Res. .

Abstract

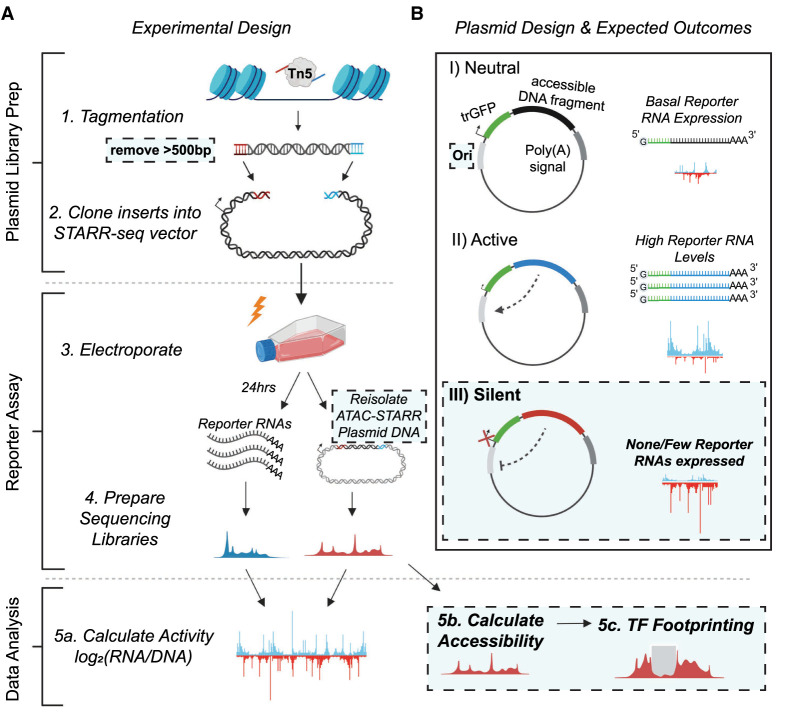
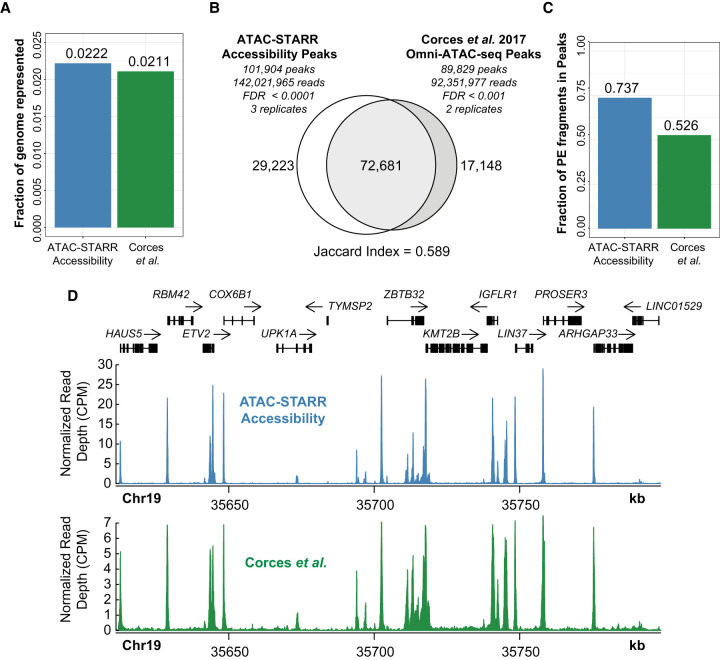
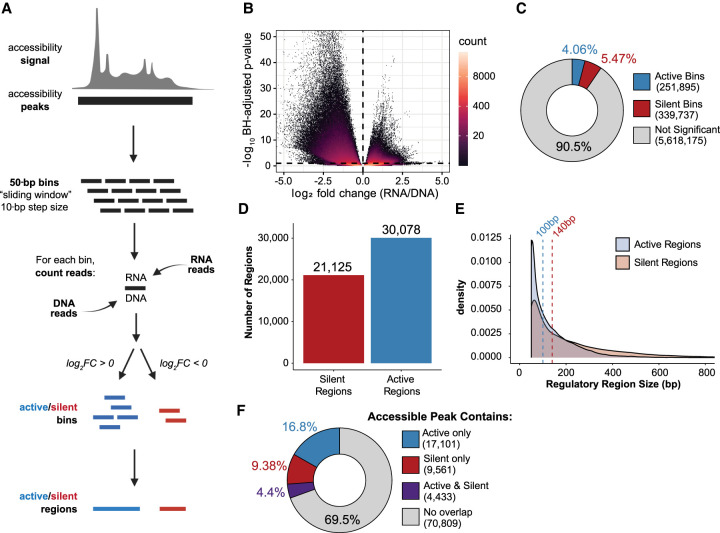
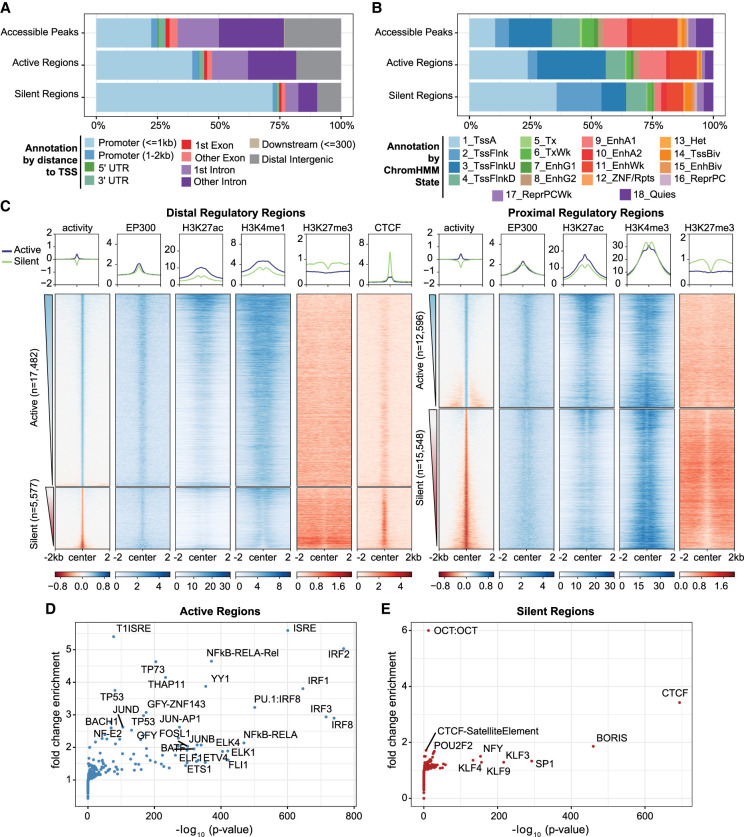
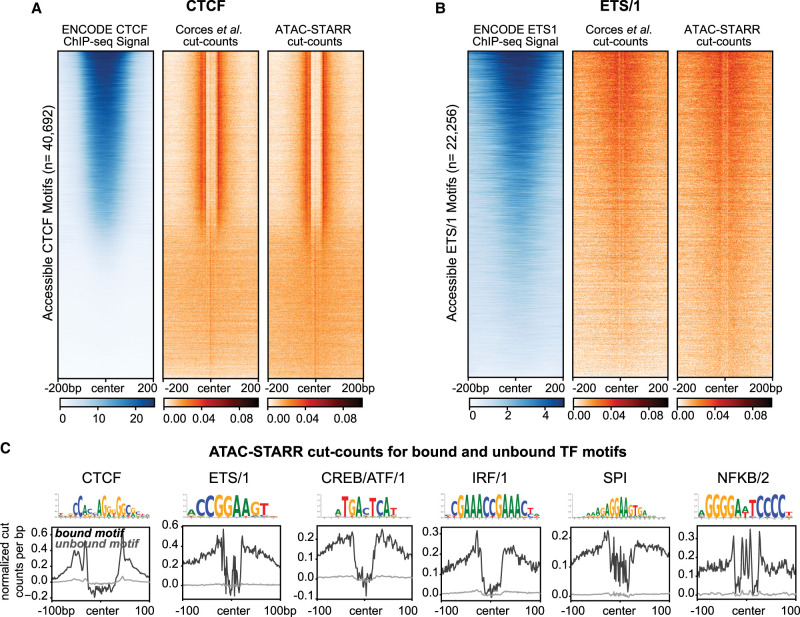
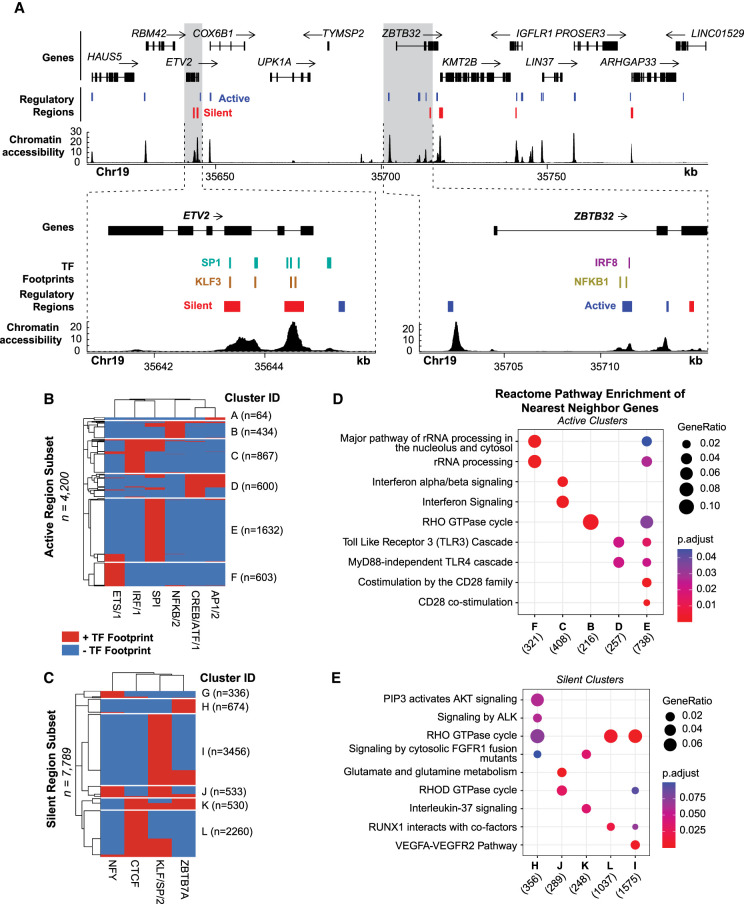
Massively parallel reporter assays (MPRAs) test the capacity of putative gene regulatory elements to drive transcription on a genome-wide scale. Most gene regulatory activity occurs within accessible chromatin, and recently described methods have combined assays that capture these regions-such as assay for transposase-accessible chromatin using sequencing (ATAC-seq)-with self-transcribing active regulatory region sequencing (STARR-seq) to selectively assay the regulatory potential of accessible DNA (ATAC-STARR-seq). Here, we report an integrated approach that quantifies activating and silencing regulatory activity, chromatin accessibility, and transcription factor (TF) occupancy with one assay using ATAC-STARR-seq. Our strategy, including important updates to the ATAC-STARR-seq assay and workflow, enabled high-resolution testing of ∼50 million unique DNA fragments tiling ∼101,000 accessible chromatin regions in human lymphoblastoid cells. We discovered that 30% of all accessible regions contain an activator, a silencer, or both. Although few MPRA studies have explored silencing activity, we demonstrate that silencers occur at similar frequencies to activators, and they represent a distinct functional group enriched for unique TF motifs and repressive histone modifications. We further show that Tn5 cut-site frequencies are retained in the ATAC-STARR plasmid library compared to standard ATAC-seq, enabling TF occupancy to be ascertained from ATAC-STARR data. With this approach, we found that activators and silencers cluster by distinct TF footprint combinations, and these groups of activity represent different gene regulatory networks of immune cell function. Altogether, these data highlight the multilayered capabilities of ATAC-STARR-seq to comprehensively investigate the regulatory landscape of the human genome all from a single DNA fragment source.


Figures

Figure 1.
Figure 1.
Schematic of the ATAC-STARR-seq methodology. (A) The experimental design of ATAC-STARR-seq consists of three parts: plasmid library generation; reporter assay; and data analysis. Open chromatin is isolated from cells with the cut-and-paste transposase Tn5 and only large DNA fragments (>500 bp) are removed. The open chromatin fragments are cloned into a reporter plasmid and the resulting clones—called an ATAC-STARR-seq plasmid library—are electroporated into cells. Twenty-four hours later, both reporter RNAs (blue)—which are transcribed directly off the ATAC-STARR-seq plasmid—and ATAC-STARR-seq plasmid DNA (red) are harvested, and Illumina sequencing libraries are prepared and sequenced. The resulting ATAC-STARR-seq data are analyzed to extract regulatory activity, chromatin accessibility, and transcription factor footprints. (B) Reporter plasmid design and the expected outcomes for neutral, active, and silent regulatory elements. Each ATAC-STARR-seq plasmid within a library contains a truncated GFP (trGFP) coding sequence, a polyadenylation signal sequence, an origin of replication (Ori) (which moonlights as a minimal core promoter), and the unique open chromatin fragment being assayed. Because the accessible region is contained in the 3′ UTR, the abundance of itself in the transcript pool reflects its activity. In this way, neutral elements do not affect the system and reporter RNAs are expressed at a basal expression level dictated by the minimal core promoter, the Ori. Accessible chromatin fragments that are active express reporter RNAs at a higher level than the basal expression level, whereas silent elements repress the Ori and reporter RNAs are expressed at a lower level than basal expression. Dashed boxes represent new components of the ATAC-STARR-seq assay design and workflow.
Figure 2.
Figure 2.
ATAC-STARR-seq accurately quantifies chromatin accessibility. ATAC-seq data from Corces et al. (2017) is compared with ATAC-STARR-seq plasmid DNA data. (A) Fraction of the human genome represented by each peak set. (B) Venn diagram of peak overlap between the two data sets and the associated Jaccard index. (C) Fraction of paired-end (PE) fragments in peaks—FRiP scores—for both samples. (D) Signal tracks comparing counts per million (CPM) normalized read count at a representative locus.
Figure 3.
Figure 3.
ATAC-STARR-seq quantifies regulatory activity within accessible chromatin. (A) Schematic of the sliding window peak calling method. Accessibility peaks are chopped into 50-bp bins at a 10-bp step size with the BEDTools makewindows function (options -w 50, -s 10). For each window, RNA and DNA reads are counted using Subread's featureCounts function. Differential analysis comparing RNA and DNA read count is performed with DESeq2. Significant bins are called at a Benjamini–Hochberg (BH) adjusted P-value < 0.1 and parsed into active or silent depending on log2 fold-change (FC) value (± zero). Finally, bins are collapsed into regions using the BEDTools merge function. Log2FC scores are averaged across merged bins. (B) Volcano plot of log2FC scores against –log10-transformed BH adjusted P-value from DESeq2 for all bins analyzed. (C) The proportion of bins called as active or silent. (D) The number of regions defined as either active or silent. (E) Overlapping density plots of active and silent regulatory region size; dashed lines represent the medians in each case. (F) The proportion of accessible peaks that overlap an active or silent region, or both.
Figure 4.
Figure 4.
Regulatory regions defined by ATAC-STARR exhibit annotations, histone modifications, and TFs characteristic of their function. (A) Annotation of regulatory regions relative to the transcriptional start site (TSS). The promoter is defined as 2 kb upstream and 1 kb downstream of the TSS. (B) Annotation of regulatory regions by the ChromHMM 18-state model for GM12878 cells. (C) Heat maps of GM12878 ENCODE ChIP-seq signal and regulatory activity for proximal and distal ATAC-STARR-defined regulatory regions. Proximal regions were classified as within 2 kb upstream and 1 kb downstream of a TSS; all other regions were annotated as distal. Active and silent regions were ranked by mean activity signal for both proximal and distal regions. (D,E) Transcription factor motif enrichment analysis as quantified by HOMER. Fold-change values are relative to the default background calculated by HOMER.
Figure 5.
Figure 5.
ATAC-STARR-seq identifies transcription factor footprints. (A) Comparison of ENCODE CTCF ChIP-seq signal to Corces et al. (2017) and ATAC-STARR-seq cut count signal for all accessible CTCF motifs. (B) Comparison of ENCODE ETS1 ChIP-seq signal to Corces et al. (2017) and ATAC-STARR-seq cut count signal for all accessible motifs with the ETS/1 motif archetype. For both, regions were ranked by largest mean ChIP-seq signal. (C) Aggregate plots representing mean signal for the TOBIAS-defined bound and unbound motif archetypes: CTCF, ETS/1, CREB/ATF/1, IRF/1, SPI, NFKB/2.
Figure 6.
Figure 6.
TF footprints stratify ATAC-STARR-defined regulatory regions into gene regulatory networks. (A) ATAC-STARR-defined chromatin accessibility, TF footprints, and regulatory regions at Chr 19: 35,611,232–35,798,446 (hg38). Signal tracks represent counts per million normalized read depth of chromatin accessibility. Zooms into ETV2 and ZBTB32 show that some regulatory regions are occupied by a SP1, KLF3, IRF8, or NFKB1 footprint. (B,C) Heat maps of clustered (B) active and (C) silent regions based on presence or absence of footprints for select TF motif archetypes. (D,E) Reactome pathway enrichment analysis for nearest-neighbor gene sets for each of the clusters. Genes counts for each cluster are displayed below their group identifier.

Similar articles

Cited by

References

    1. Arnold CD, Gerlach D, Stelzer C, Boryń LM, Rath M, Stark A. 2013. Genome-wide quantitative enhancer activity maps identified by STARR-seq. Science 339: 1074–1077. 10.1126/science.1232542 - DOI - PubMed
    1. Barnett KR, Decato BE, Scott TJ, Hansen TJ, Chen B, Attalla J, Smith AD, Hodges E. 2020. ATAC-Me captures prolonged DNA methylation of dynamic chromatin accessibility loci during cell fate transitions. Mol Cell 77: 1350–1364.e6. 10.1016/j.molcel.2020.01.004 - DOI - PMC - PubMed
    1. Bentsen M, Goymann P, Schultheis H, Klee K, Petrova A, Wiegandt R, Fust A, Preussner J, Kuenne C, Braun T, et al. 2020. ATAC-seq footprinting unravels kinetics of transcription factor binding during zygotic genome activation. Nat Commun 11: 4267. 10.1038/s41467-020-18035-1 - DOI - PMC - PubMed
    1. Buenrostro JD, Giresi PG, Zaba LC, Chang HY, Greenleaf WJ. 2013. Transposition of native chromatin for fast and sensitive epigenomic profiling of open chromatin, DNA-binding proteins and nucleosome position. Nat Methods 10: 1213–1218. 10.1038/nmeth.2688 - DOI - PMC - PubMed
    1. Cao Z, Sun X, Icli B, Wara AK, Feinberg MW. 2010. Role of Krüppel-like factors in leukocyte development, function, and disease. Blood 116: 4404–4414. 10.1182/blood-2010-05-285353 - DOI - PMC - PubMed

MeSH terms