. 2022 Jul 20;13(1):4199.
doi: 10.1038/s41467-022-31857-5.

Polycomb-lamina antagonism partitions heterochromatin at the nuclear periphery

Affiliations

Polycomb-lamina antagonism partitions heterochromatin at the nuclear periphery

Allison P Siegenfeld et al. Nat Commun. .

Abstract

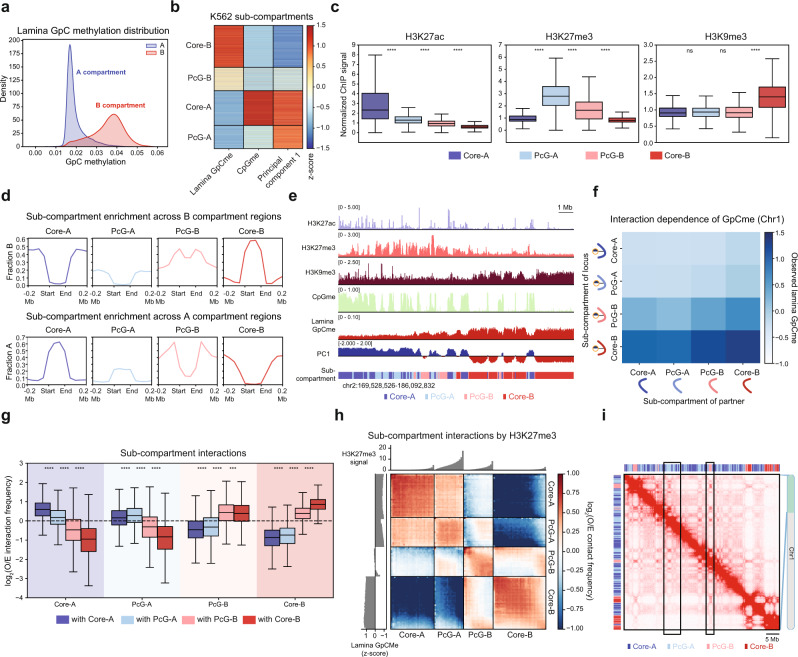
The genome can be divided into two spatially segregated compartments, A and B, which partition active and inactive chromatin states. While constitutive heterochromatin is predominantly located within the B compartment near the nuclear lamina, facultative heterochromatin marked by H3K27me3 spans both compartments. How epigenetic modifications, compartmentalization, and lamina association collectively maintain heterochromatin architecture remains unclear. Here we develop Lamina-Inducible Methylation and Hi-C (LIMe-Hi-C) to jointly measure chromosome conformation, DNA methylation, and lamina positioning. Through LIMe-Hi-C, we identify topologically distinct sub-compartments with high levels of H3K27me3 and differing degrees of lamina association. Inhibition of Polycomb repressive complex 2 (PRC2) reveals that H3K27me3 is essential for sub-compartment segregation. Unexpectedly, PRC2 inhibition promotes lamina association and constitutive heterochromatin spreading into H3K27me3-marked B sub-compartment regions. Consistent with this repositioning, genes originally marked with H3K27me3 in the B compartment, but not the A compartment, remain largely repressed, suggesting that constitutive heterochromatin spreading can compensate for H3K27me3 loss at a transcriptional level. These findings demonstrate that Polycomb sub-compartments and their antagonism with lamina association are fundamental features of genome structure. More broadly, by jointly measuring nuclear position and Hi-C contacts, our study demonstrates how compartmentalization and lamina association represent distinct but interdependent modes of heterochromatin regulation.


Conflict of interest statement

B.B.L. is on the Scientific Advisory Board of H3 Biomedicine. M.J.A. declares outside interest in Excelsior Genomics. The remaining authors declare no competing interests.

Figures

Fig. 1
Fig. 1. LIMe-Hi-C simultaneously identifies LADs, CpG methylation, and Hi-C contacts.
a Schematic of the LIMe-Hi-C workflow. b LIMe-Hi-C contact map for replicate 1 with lamina GpC methylation, CpG methylation, and principal component 1 at 100 kb resolution. c Density heatmap comparing DamID signal (x-axis, Dam-Lamin B1/Dam-only enrichment) to replicate-averaged LIMe-Hi-C GpC methylation fraction (y-axis) across 50 kb bins. Published datasets are specified in Supplementary Table 1. d Density heatmap comparing replicate-averaged principal component 1 (x-axis) to replicate-averaged LIMe-Hi-C GpC methylation fraction (y-axis) across 50 kb bins. e Genome browser tracks depicting lamina GpC methylation signal, LIMe LADs, DamID signal, and DamID LADs. Published datasets are specified in Supplementary Table 1. f Venn diagram describing the genome-wide base pair overlap between LIMe LADs and published DamID LADs. g Example Hi-C interaction matrix merged across replicates for a region on chromosome 1 depicting only contacts where both reads are GpC methylated (left) or CpG methylated (right). h Normalized average lamina GpC methylation for loci as a function of the compartment status of the loci’s interaction partner for chromosome 1 (see Methods). Curved lines represent the compartment identities of the DNA regions within each interaction pair. i Boxplot across 50 kb bins genome-wide for both compartments (x-axis) depicting the log2 ratio of the interval’s lamina association status (y-axis) if it is interacting with the B versus the A compartment. P values were calculated by a one-sample one-sided t-test to determine if the mean is greater than 0. j Boxplot across 50 kb bins genome-wide for both compartments (x-axis) depicting the log2 ratio of the interval’s CpG methylation status (y-axis) if it is interacting with the B versus the A compartment. P values were calculated by a one-sample one-sided t-test to determine if the mean is less than 0. In (i, j) the interquartile range (IQR) is depicted by the box with the median represented by the center line. Whiskers maximally extend to 1.5 × IQR (with outliers excluded). P values are annotated as follows: ns: not significant; *: 0.01 < p ≤ 0.05; **: 0.001 < p ≤ 0.01; ***: 0.0001 < p ≤ 0.001; ****: p ≤ 0.0001. Exact p values and the number of datapoints (n) compared are provided in the source data file.
Fig. 2
Fig. 2. Identification of topologically distinct Polycomb sub-compartments with LIMe-Hi-C.
a Density plot depicting the relative density (y-axis) of the average fraction lamina GpC methylation (x-axis) for 50 kb bins across compartments. The density function for each compartment is independently scaled. b Heatmap of 50 kb genomic regions clustered into sub-compartments identified by k-means clustering. Color represents the z-score-transformed value for LIMe features across every genomic bin. c Boxplot showing levels of histone modifications (y-axis, fold-change over input/median signal) for 50 kb bins across sub-compartments (x-axis). Published datasets are specified in Supplementary Table 1. d Aggregate plot depicting the fraction of a specified sub-compartment type (y-axis) across compartment regions (x-axis) for the B compartment (top) and A compartment (bottom). e Representative genome browser tracks depicting histone ChIP-seq signal along with CpG methylation (replicate 1), lamina GpC methylation (replicate 1), and principal component 1 (replicate 1). The sub-compartment designation is included below. Published datasets are specified in Supplementary Table 1. f Normalized average lamina GpC methylation for loci as a function of the sub-compartment status of the loci’s interaction partner for chromosome 1 (see Methods). Curved lines represent the sub-compartment identities of the DNA regions within each interaction pair. g Boxplot showing average log2(observed/expected contact frequency) for 50 kb bin level interactions (y-axis) across sub-compartments (x-axis). O/E denotes observed/expected. h Summary interaction heatmap ordered by sub-compartment and H3K27me3 ChIP-seq signal of the log2(observed/expected contact frequency). Replicate-averaged z-score lamina GpC methylation (left) and H3K27me3 levels (top) per quantile are displayed alongside the interaction heatmap. O/E denotes observed/expected. i LIMe-Hi-C contact map merged across the three replicates. Example regions are highlighted with black boxes. In (c, g) the interquartile range (IQR) is depicted by the box with the median represented by the center line. Whiskers maximally extend to 1.5 × IQR (with outliers excluded). P values were calculated by a Mann-Whitney-Wilcoxon two-sided test and are annotated as follows: ns: not significant; *: 0.01 <p ≤ 0.05; **: 0.001 <p ≤ 0.01; ***: 0.0001 <p ≤ 0.001; ****: p ≤ 0.0001. Exact p values and the number of datapoints (n) compared are provided in the source data file.
Fig. 3
Fig. 3. Inhibition of EZH2 and DNMT1 differentially remodel chromatin compartmentalization.
a Boxplot depicting replicate-averaged difference in log2(A/B ratio) for 50 kb bins (y-axis) (see Methods) between inhibitor treatment and vehicle treatment across compartments (x-axis). b Summary interaction heatmap ordered by sub-compartment and baseline H3K27me3 ChIP-seq signal of the difference in the log2(observed/expected contact frequency) averaged across replicates between DNMT1 inhibition and vehicle treatment. Averaged baseline z-score lamina GpC methylation (left) and H3K27me3 (top) levels per quantile are displayed alongside the interaction heatmap. c Summary interaction heatmap ordered by sub-compartment and baseline H3K27me3 ChIP-seq signal of the difference in the log2(observed/expected contact frequency) averaged across replicates between EZH2 inhibition and vehicle treatment. Averaged baseline z-score lamina GpC methylation (left) and H3K27me3 (top) levels per quantile are displayed alongside the interaction heatmap. Example interaction changes are highlighted with colored boxes. d Boxplot showing replicate-averaged difference in log2(observed/expected contact frequency) of every 50 kb bin (y-axis) for DNMT1 inhibition relative to vehicle treatment for interactions with Core-B across sub-compartments (x-axis). e Boxplot showing replicate-averaged difference in log2(observed/expected contact frequency) of every 50 kb bin (y-axis) for EZH2 inhibition relative to vehicle treatment for interactions with PcG-A (left) and Core-B (right) across sub-compartments (x-axis). f Representative Hi-C observed/expected contact map comparing EZH2 inhibitor to vehicle treatment. Contacts from the three replicates were pooled together. Example interaction changes are highlighted with colored boxes. g Pearson correlation heatmap of z-score-normalized GpC methylation across 50 kb bins for LIMe-Hi-C samples. h Normalized average lamina GpC methylation for loci as a function of the sub-compartment status of the loci’s interaction partner for vehicle and inhibitor treatments for chromosome 1 (see Methods). Curved lines represent the sub-compartment identities of the DNA regions within each interaction pair. In (a, d, e) the interquartile range (IQR) is depicted by the box with the median represented by the center line. Whiskers maximally extend to 1.5 × IQR (with outliers excluded). P values were calculated by a Mann-Whitney-Wilcoxon two-sided test and are annotated as follows: ns: not significant; *: 0.01 < p ≤ 0.05; **: 0.001 < p ≤ 0.01; ***: 0.0001 < p ≤ 0.001; ****: p ≤ 0.0001. Exact p values and the number of datapoints (n) compared are provided in the source data file. O/E denotes observed/expected.
Fig. 4
Fig. 4. PRC2 antagonizes lamina association.
a Boxplot showing z-score-normalized GpC methylation change between EZH2i and vehicle treatment for 50 kb bins (y-axis) across sub-compartments (x-axis). b Boxplot showing log2 fold-change in H3K27me3 levels between EZH2i and vehicle treatment for 50 kb bins (y-axis) segregated into three equally sized quantiles by change in z-score-normalized lamina GpC methylation (x-axis) for PcG-A (left) and PcG-B (right). c Boxplot showing change in log2(A/B ratio) between EZH2i and vehicle treatment for 50 kb bins (y-axis) segregated into three equally sized quantiles by change in z-score-normalized GpC methylation (x-axis) for PcG-B. d Density plot depicting density (y-axis) of average lamina GpC methylation bin rank value across replicates (x-axis) for vehicle treatment (top) and EZH2 inhibitor treatment (bottom) for 50 kb bins colored by sub-compartment designation. e Genome browser tracks of replicate-averaged z-score-normalized lamina GpC methylation levels, principal component 1, and H3K27me3 ChIP-seq signal for LIMe-Hi-C and ChIP-seq data near the HOXD locus. f Aggregate profile plot of log2 fold-change H3K27me3 ChIP-seq signal between EZH2 inhibition and vehicle treatment (y-axis) across regions gaining lamina contact upon EZH2 inhibition (x-axis) (see Methods). g Aggregate profile plot of baseline H3K27me3 ChIP-seq signal for vehicle treatment (y-axis) across B compartments (x-axis). h Aggregate profile plots depicting change in z-score-normalized lamina GpC methylation (y-axis) across B compartment regions (x-axis) upon inhibitor treatments. i Clustered Pearson correlation heatmap of z-score-normalized GpC methylation across 250 kb bins for LIMe-ID data. j Genome browser tracks of replicate-averaged z-score-normalized lamina GpC methylation levels for LIMe-ID data near the HOXD locus. k Aggregate profile plots depicting change in z-score-normalized lamina GpC methylation (y-axis) across LIMe LADs (x-axis) for EZH2 degradation relative to vehicle treatment. In (ac) the interquartile range (IQR) is depicted by the box with the median represented by the center line. Whiskers maximally extend to 1.5 × IQR (with outliers excluded). P values were calculated by a Mann-Whitney-Wilcoxon two-sided test and are annotated as follows: ns: not significant; *: 0.01 < p ≤ 0.05; **: 0.001 < p ≤ 0.01; ***: 0.0001 < p ≤ 0.001; ****: p ≤ 0.0001. Exact p values and the number of datapoints (n) compared are provided in the source data file.
Fig. 5
Fig. 5. H3K27me3 antagonizes constitutive heterochromatin spreading.
a Boxplot showing log2 fold-change H3K9me3 ChIP-seq signal between EZH2 inhibition and vehicle treatment for 50 kb bins (y-axis) across sub-compartments (x-axis). b Boxplot showing log2 fold-change in H3K9me3 levels between EZH2i and vehicle treatment for 50 kb bins (y-axis) segregated into three equally sized quantiles by change in z-score-normalized lamina GpC methylation (x-axis) for PcG-B. c Boxplot showing log2 fold-change in H3K27me3 levels between EZH2i and vehicle treatment for 50 kb bins (y-axis) segregated into three equally sized quantiles by log2 fold-change in H3K9me3 (x-axis) for PcG-B. d Aggregate profile plot of log2 fold-change H3K9me3 ChIP-seq signal between EZH2 inhibition and vehicle treatment (y-axis) across B compartment regions (x-axis). e Genome browser tracks of replicate-averaged z-score-normalized lamina GpC methylation levels for the LIMe-Hi-C data, log2 fold-change H3K9me3 ChIP-seq, and log2 fold-change H3K27me3 ChIP-seq signal between EZH2i and vehicle treatment near the HOXD locus. f Boxplot of log2(TRIP expression) (y-axis) across sub-compartments for promoters (x-axis). Outlier points are excluded. Published TRIP data is specified in Supplementary Table 1. g Boxplot of log2(fold-change expression) (y-axis) between EZH2 inhibition and vehicle treatment for genes that overlap with H3K27me3 peaks across sub-compartments (x-axis). In (ac, f, g) the interquartile range (IQR) is depicted by the box with the median represented by the center line. Whiskers maximally extend to 1.5 × IQR (with outliers excluded). P values were calculated by a Mann-Whitney-Wilcoxon two-sided test and are annotated as follows: ns: not significant; *: 0.01 < p ≤ 0.05; **: 0.001 < p ≤ 0.01; ***: 0.0001 < p ≤ 0.001; ****: p ≤ 0.0001. Exact p values and the number of datapoints (n) compared are provided in the source data file.
Fig. 6
Fig. 6. Proposed model of Polycomb-lamina antagonism.
Schematic of epigenomic changes elicited by loss of PRC2.

References

    1. Steensel Bvan, Belmont AS. Lamina-Associated Domains: Links with Chromosome Architecture, Heterochromatin, and Gene Repression. Cell. 2017;169:780–791. doi: 10.1016/j.cell.2017.04.022. - DOI - PMC - PubMed
    1. Steensel Bvan, Furlong EEM. The role of transcription in shaping the spatial organization of the genome. Nat. Rev. Mol. Cell Bio. 2019;20:327–337. - PMC - PubMed
    1. Marchal C, Sima J, Gilbert DM. Control of DNA replication timing in the 3D genome. Nat. Rev. Mol. Cell Biol. 2019;20:721–737. doi: 10.1038/s41580-019-0162-y. - DOI - PMC - PubMed
    1. Zheng H, Xie W. The role of 3D genome organization in development and cell differentiation. Nat. Rev. Mol. Cell Bio. 2019;20:535–550. doi: 10.1038/s41580-019-0132-4. - DOI - PubMed
    1. Kempfer, R. & Pombo, A. Methods for mapping 3D chromosome architecture. Nat. Rev. Genet21, 207–226 (2019). - PubMed

Publication types

MeSH terms