. 2022 Jul 20;12(1):12420.
doi: 10.1038/s41598-022-16455-1.

Amplification of CDK4 and MDM2: a detailed study of a high-risk neuroblastoma subgroup

Affiliations

Amplification of CDK4 and MDM2: a detailed study of a high-risk neuroblastoma subgroup

Angela Martinez-Monleon et al. Sci Rep. .

Abstract

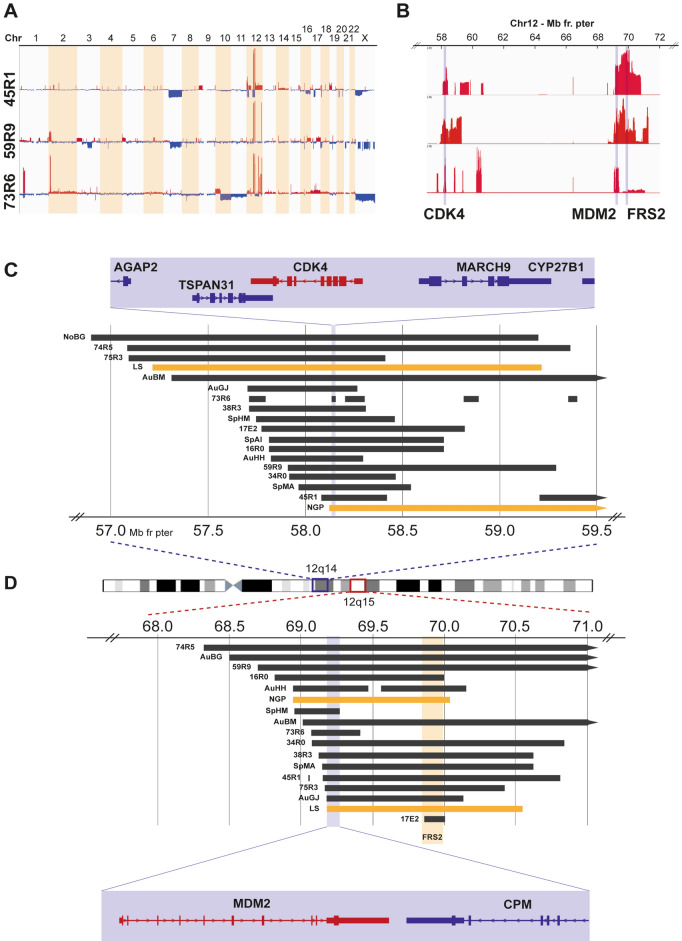
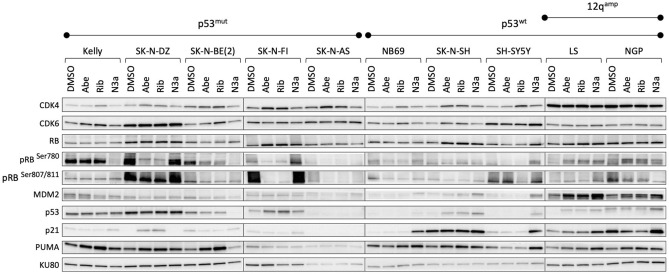
In neuroblastoma, MYCN amplification and 11q-deletion are important, although incomplete, markers of high-risk disease. It is therefore relevant to characterize additional alterations that can function as prognostic and/or predictive markers. Using SNP-microarrays, a group of neuroblastoma patients showing amplification of one or multiple 12q loci was identified. Two loci containing CDK4 and MDM2 were commonly co-amplified, although amplification of either locus in the absence of the other was observed. Pharmacological inhibition of CDK4/6 with ribociclib or abemaciclib decreased proliferation in a broad set of neuroblastoma cell lines, including CDK4/MDM2-amplified, whereas MDM2 inhibition by Nutlin-3a was only effective in p53wild-type cells. Combined CDK4/MDM2 targeting had an additive effect in p53wild-type cell lines, while no or negative additive effect was observed in p53mutated cells. Most 12q-amplified primary tumors were of abdominal origin, including those of intrarenal origin initially suspected of being Wilms' tumor. An atypical metastatic pattern was also observed with low degree of bone marrow involvement, favoring other sites such as the lungs. Here we present detailed biological data of an aggressive neuroblastoma subgroup hallmarked by 12q amplification and atypical clinical presentation for which our in vitro studies indicate that CDK4 and/or MDM2 inhibition also could be beneficial.


Conflict of interest statement

The authors declare no competing interests.

Figures

Figure 1
Figure 1
Genomic findings regarding the tumors with 12q amplification. (A) Whole-genome copy number profiles generated from WGS for three NB tumors with 12q amplification and (B) copy number profiles for chromosome 12, 57–72 Mb from the p-terminal with corresponding amplification peaks. (C) Amplified regions at 12q14 in relation to genomic position and genes with the shortest region of overlap (SRO), indicated in blue, based on amplicon boundaries of all primary tumors and cell lines analyzed. (D) Amplified regions at 12q15 in relation to genomic position and genes with the SRO indicated in blue.
Figure 2
Figure 2
Clinical presentation of 12q-amplified tumors. (A,B) CT images of patient 45R1 showing a large primary NB tumor adjacent the upper part of the right kidney and (C) metastases of the lungs as indicated by arrows. (D,E) Corresponding images of a Wilms’ tumor with comparable growth pattern in a child at the similar age. Hematoxylin–eosin staining showing: (F) conventional poorly differentiated neuroblastoma with uniform nuclei and incipient resetting, patient 17E2, (G) large cell neuroblastoma with partly spindling cells and atypical mitoses, patient 45R1 and (H) undifferentiated large and anaplastic cell neuroblastoma with coarse nuclear chromatin, prominent nucleoli and atypical mitoses, patient 38R3. (I) Kaplan–Meier overall survival analysis show upon poor outcome among NB patients with 12q amplification in comparison to NB patients of different genomic subgroups.
Figure 3
Figure 3
Mutational spectra and structural variants in 12q-amplified tumors. Circos plots showing structural variants, CNAs, and somatic SNVs. Copy number plots calculated based on the coverage ratio between tumor and corresponding normal tissue are shown on the inner circle, with gain of genomic material indicated in red and loss of genomic material indicated in blue. The lines within the inner circle indicate structural variants within and between chromosomes, while genes affected by somatic SNVs are shown outside the outer circle.
Figure 4
Figure 4
Neuroblastoma cell line response to MDM2i or CDK4/6i. (A) Normalized cell viability after treatment with Nutlin-3a (upper panels), ribociclib (middle panels), and abemaciclib (lower panels) for 24, 48, and 72 h. (B) IC50 values calculated after 24, 48, and 72 h of treatment. The bars represent the 95% CI for each IC50 value with statistical significance indicated as follows: *p < 0.01, **p < 0.001, *** p < 0.0001, and ****p < 0.00001.
Figure 5
Figure 5
Inhibition dose–response matrix and synergy score heatmaps for representative neuroblastoma cell lines. Dose–response matrix and synergy score heatmaps generated by SynergyFinder for combinational treatment with Nutlin-3a and ribociclib and with Nutlin-3a and abemaciclib for the cell lines LS (CDK4/MDM2-amp, p53wt, MNA), SK-N-SH (p53wt, MNA), SK-N-BE (p53mut, MNA), and SK-N-AS (p53mut). Dose–response matrix and synergy score heatmaps for all used cell lines can be found in Supplementary Fig. 5.
Figure 6
Figure 6
Effect on proteins of the CDK4 and MDM2 pathway after CDK4/6 or MDM2 inhibition. The cells were treated with abemaciclib (Abe), ribociclib (Rib), and Nutlin-3a (N3a) at IC50 values for 72 h before protein extraction. This figure is a representation of the protein expression using different blots. The blots are delineated to clarify that belong to different gels or to different parts of the same gel. Each blot was normalized using KU80 as control. Exposure time for each protein analysis was the same for all cell lines.

References

    1. DuBois SG, et al. Metastatic sites in stage IV and IVS neuroblastoma correlate with age, tumor biology, and survival. J. Pediatr. Hematol. Oncol. 1999;21:181–189. doi: 10.1097/00043426-199905000-00005. - DOI - PubMed
    1. Valteau-Couanet D, et al. Long-term results of the combination of the N7 induction chemotherapy and the busulfan-melphalan high dose chemotherapy. Pediatr. Blood Cancer. 2014;61:977–981. doi: 10.1002/pbc.24713. - DOI - PubMed
    1. Pearson AD, et al. High-dose rapid and standard induction chemotherapy for patients aged over 1 year with stage 4 neuroblastoma: A randomised trial. Lancet Oncol. 2008;9:247–256. doi: 10.1016/S1470-2045(08)70069-X. - DOI - PubMed
    1. Pugh TJ, et al. The genetic landscape of high-risk neuroblastoma. Nat. Genet. 2013;45:279–284. doi: 10.1038/ng.2529. - DOI - PMC - PubMed
    1. Pandey GK, et al. The risk-associated long noncoding RNA NBAT-1 controls neuroblastoma progression by regulating cell proliferation and neuronal differentiation. Cancer Cell. 2014;26:722–737. doi: 10.1016/j.ccell.2014.09.014. - DOI - PubMed

Publication types

MeSH terms