. 2022 Jul;607(7920):799-807.
doi: 10.1038/s41586-022-04972-y. Epub 2022 Jul 20.

Mechanisms of APOBEC3 mutagenesis in human cancer cells

Affiliations

Mechanisms of APOBEC3 mutagenesis in human cancer cells

Mia Petljak et al. Nature. 2022 Jul.

Abstract

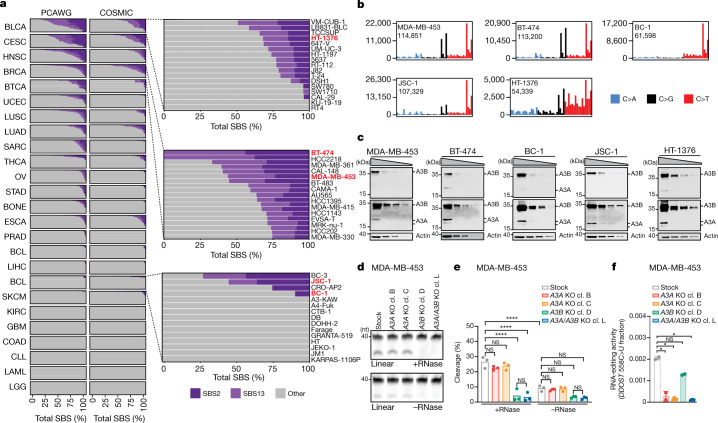
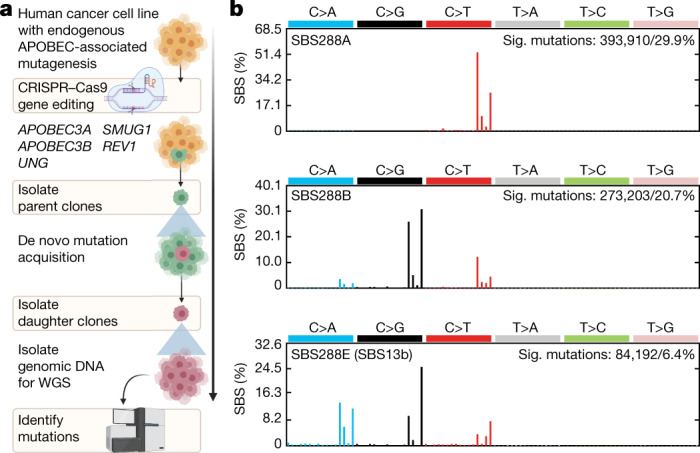
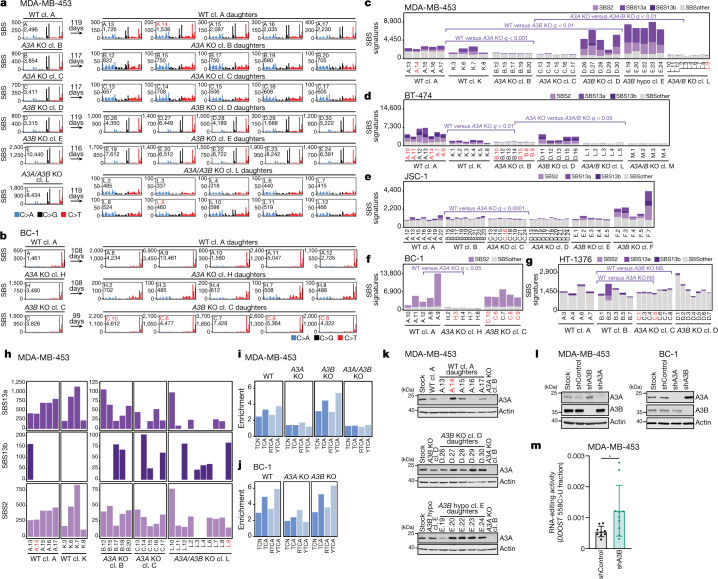
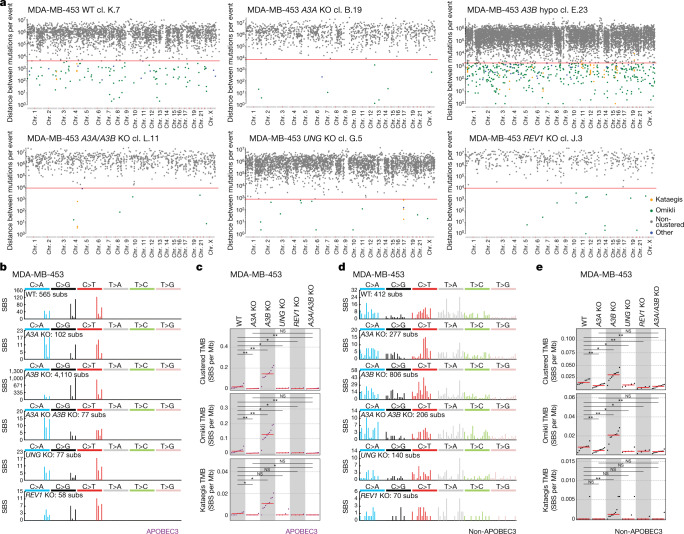
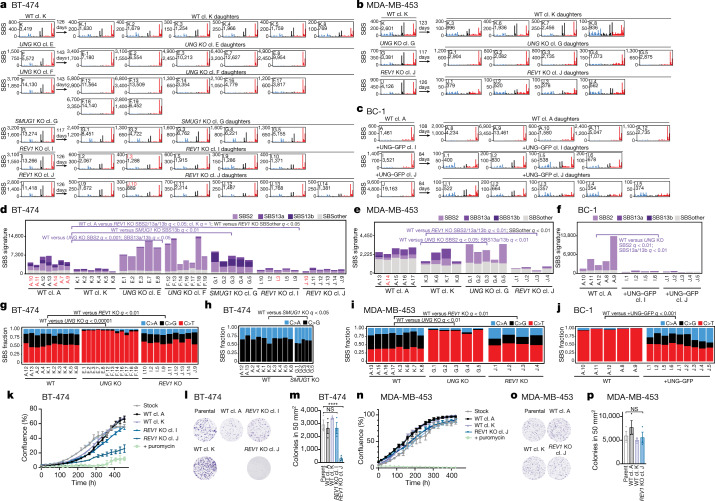
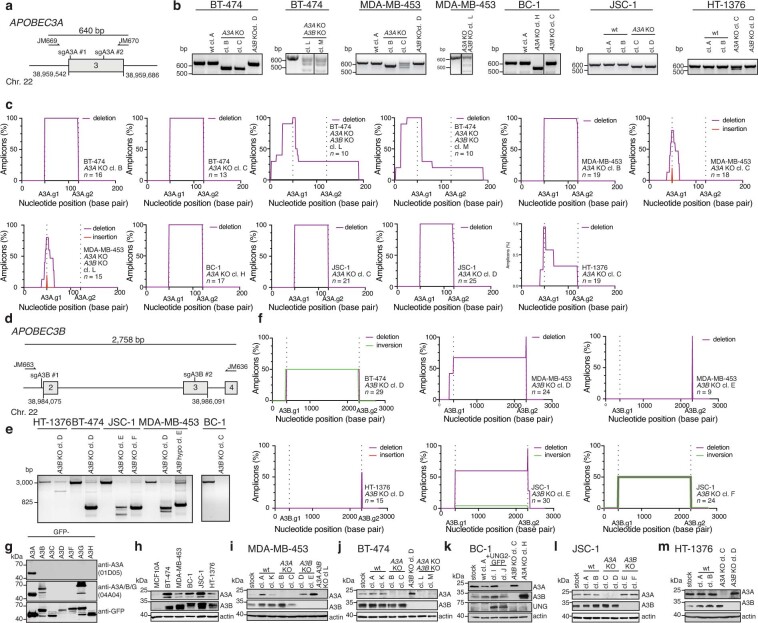
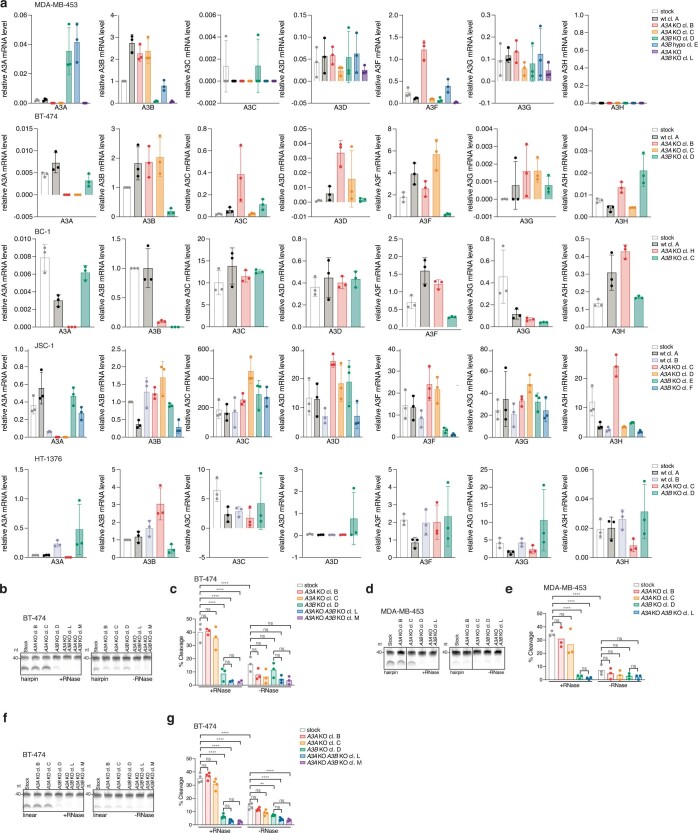
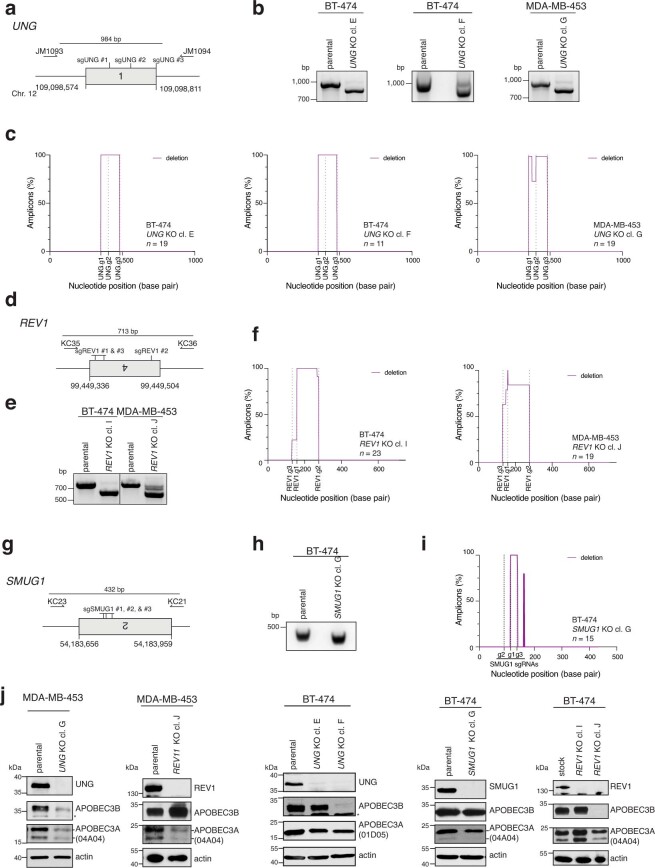
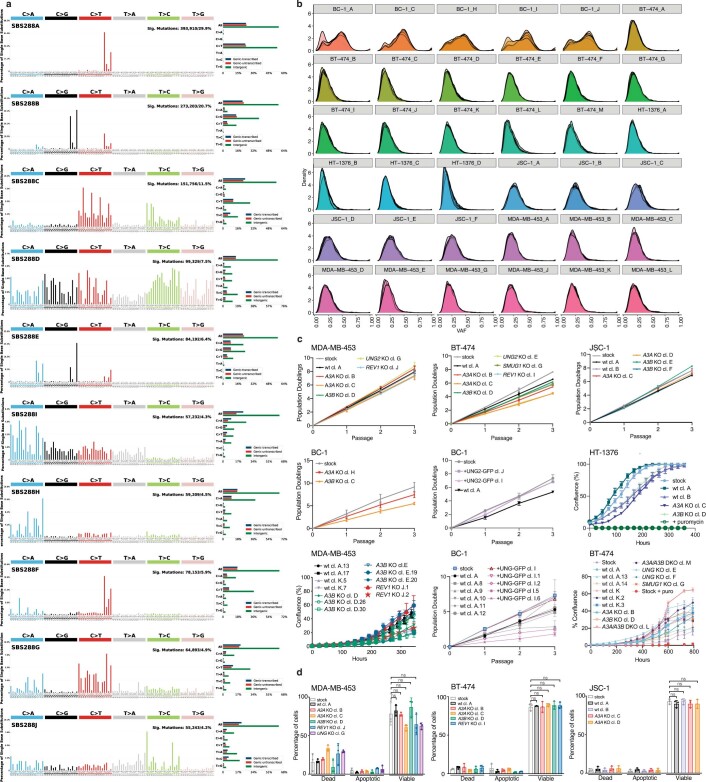
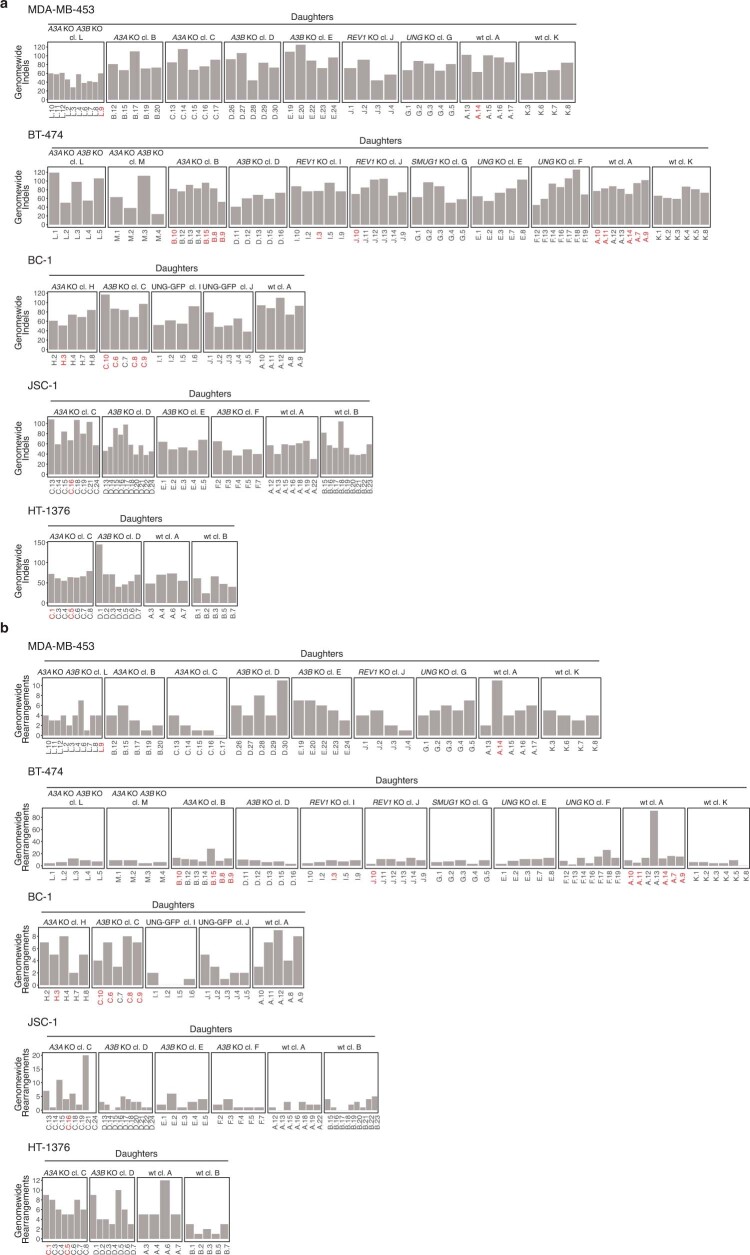
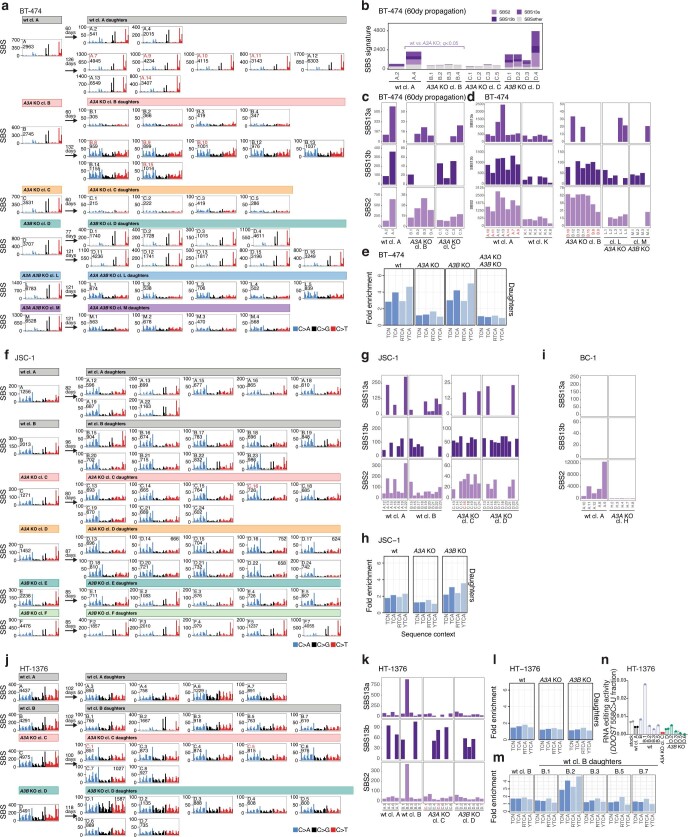
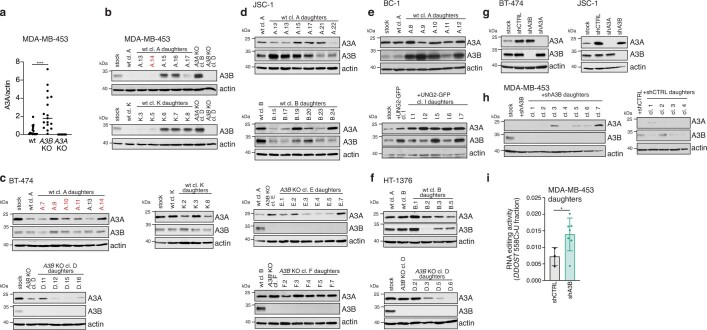
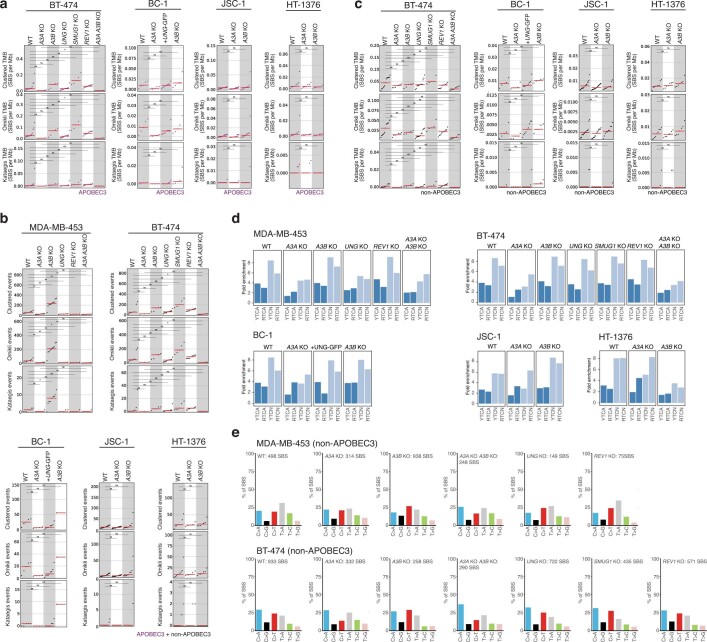
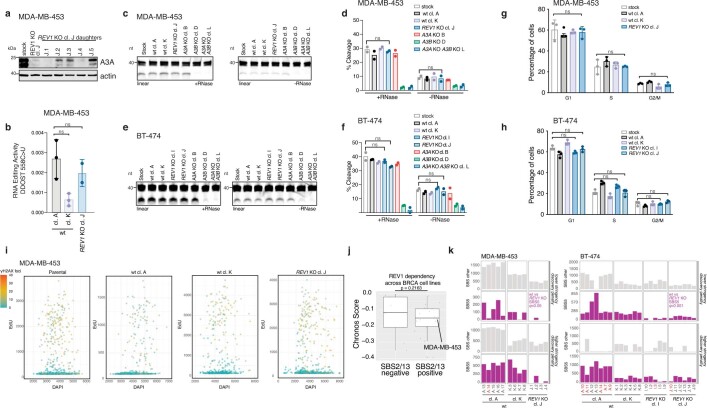
The APOBEC3 family of cytosine deaminases has been implicated in some of the most prevalent mutational signatures in cancer1-3. However, a causal link between endogenous APOBEC3 enzymes and mutational signatures in human cancer genomes has not been established, leaving the mechanisms of APOBEC3 mutagenesis poorly understood. Here, to investigate the mechanisms of APOBEC3 mutagenesis, we deleted implicated genes from human cancer cell lines that naturally generate APOBEC3-associated mutational signatures over time4. Analysis of non-clustered and clustered signatures across whole-genome sequences from 251 breast, bladder and lymphoma cancer cell line clones revealed that APOBEC3A deletion diminished APOBEC3-associated mutational signatures. Deletion of both APOBEC3A and APOBEC3B further decreased APOBEC3 mutation burdens, without eliminating them. Deletion of APOBEC3B increased APOBEC3A protein levels, activity and APOBEC3A-mediated mutagenesis in some cell lines. The uracil glycosylase UNG was required for APOBEC3-mediated transversions, whereas the loss of the translesion polymerase REV1 decreased overall mutation burdens. Together, these data represent direct evidence that endogenous APOBEC3 deaminases generate prevalent mutational signatures in human cancer cells. Our results identify APOBEC3A as the main driver of these mutations, indicate that APOBEC3B can restrain APOBEC3A-dependent mutagenesis while contributing its own smaller mutation burdens and dissect mechanisms that translate APOBEC3 activities into distinct mutational signatures.


Conflict of interest statement

M.P. is a shareholder in Vertex Pharmaceuticals and a compensated consultant for the GLG Network. J.M. has received consulting fees from Ono Pharmaceutical Co. His spouse is an employee of and has equity in Bristol Myers Squibb. J.M., M.P. and M.R.S. are inventors of the patent application ‘Tracking APOBEC mutational signatures in tumor cells’ (PCT/US2022/013328) by Broad, MSKCC, and Sanger (patent pending). L.B.A. is a compensated consultant and has equity interest in io9. His spouse is an employee of Biotheranostics. L.B.A. is also listed as an inventor on US Patent 10,776,718 for source identification by non-negative matrix factorization. E.N.B. and L.B.A. declare provisional patent applications for ‘Clustered mutations for the treatment of cancer’ (US provisional application serial number 63/289,601) and ‘Artificial intelligence architecture for predicting cancer biomarker’ (serial number 63/269,033). The other authors declare no competing interests.

Figures

Fig. 1
Fig. 1. Human cancer cell line models of APOBEC3-associated mutagenesis.
a, The prevalence of the SBS2 and SBS13 signatures in 1,843 whole-genome-sequenced human cancers and 780 whole-exome-sequenced COSMIC cancer cell lines. Each bar represents the percentage of mutations attributed to the indicated SBS signatures in an individual sample from the indicated cancer types. Abbreviations are defined in Supplementary Table 1. Subsets of the BLCA, BRCA and BCL datasets are magnified to highlight the cell lines chosen for further study (red). b, The mutational profiles of the indicated cell lines plotted as the numbers of genome-wide substitutions (y axis) at cytosine bases classified into 48 possible trinucleotide sequence contexts (x axis; Extended Data Fig. 4a). c, Immunoblotting with anti-APOBEC3 (04A04) and anti-actin antibodies. Extracts (40 µg, 20 µg, 10 µg and 5 µg) were prepared from the indicated cell lines. The anti-APOBEC3 antibody detects APOBEC3A and APOBEC3B (Extended Data Fig. 1g). Multiple exposures are shown to better depict APOBEC3A (A3A) and APOBEC3B (A3B) signals. n = 3 experiments. d, Cytosine deaminase activity in the indicated cell lines was measured against a linear probe with (top) or without (bottom) RNase treatment to degrade RNA in the extracts. cl., clone; nt, nucleotides. e, Quantification of APOBEC3 deaminase activity as the percentage of processed DNA as in d. Data are mean. Statistical analysis was performed using one-way analysis of variance (ANOVA) with Tukey multiple-comparisons test; ****P< 0.0001; NS, not significant. n = 3 experiments. f, Quantification of DDOST 558C>U levels in the indicated MDA-MB-453 cells. Data are mean ± s.d. Statistical analysis was performed using one-way ANOVA with Tukey multiple-comparisons test; *P < 0.05; NS, not significant. n = 2 experiments.
Fig. 2
Fig. 2. Using human cancer cell lines to investigate the origins of APOBEC3-associated mutagenesis.
a, The experimental design used to track mutation acquisition in vitro over specific timeframes. The schematic was generated using BioRender. b, Profiles of APOBEC-associated signatures (sig.) extracted from SBSs identified across mutational catalogues of 5 stock cell lines and 251 parent and daughter clones. Mutational profiles are plotted as the percentage of genome-wide substitutions (y-axis) at cytosine or thymine bases classified into 96 possible trinucleotide sequence contexts (x-axis; Extended Data Fig. 4a). Subsequent deconvolution into COSMIC signatures revealed that SBS288A corresponds to COSMIC reference signature SBS2, SBS288B to SBS13 (termed SBS13a), whereas SBS288E represents a new version of COSMIC SBS13, which was termed SBS13b and quantified across samples in its extracted (rather than COSMIC) form. PCAWG, pan-cancer analysis of whole genomes; WGS, whole-genome sequencing.
Fig. 3
Fig. 3. APOBEC3 deaminases drive the acquisition of SBS2 and SBS13 in human cancer cells.
a,b, Mutational profiles of the indicated MDA-MB-453 (a) and BC-1 (b) clones plotted as the numbers of genome-wide substitutions (y axis) at cytosine bases classified into 48 possible trinucleotide sequence contexts (x axis; Extended Data Fig. 4a). cl., clone. The arrows indicate the number of days spanning the cloning events of parents (left of arrow) and daughters (right) during which mutation acquisition was tracked. cg, The numbers of SBSs attributed to colour-coded mutational signatures discovered in the indicated daughter clones from the MDA-MB-453 (c), BT-474 (d), JSC-1 (e), BC-1 (f) and HT-1376 (g) cell lines with the indicated genotypes. q values comparing cumulative counts of SBS2, SBS13a, and SBS13b were calculated using one-tailed Mann–Whitney U-tests and false-discovery rate (FDR)-corrected using the Benjamini–Hochberg procedure. hypo, hypomorph. h, Focused plots showing SBS2 and SBS13a/b burdens in the indicated daughter clones. i,j, Enrichment of cytosine mutations in APOBEC3B-preferred RTCA and APOBEC3A-preferred YTCA sequence contexts in the indicated MDA-MB-453 (i) and BC-1 (j) daughter clones. R, purine base; Y, pyrimidine base; N, any base. k,l, Immunoblotting using anti-APOBEC3A (01D05), anti-APOBEC3B and anti-actin antibodies in the indicated cell lines. m, Quantification of DDOST 558C>U levels in the indicated MDA-MB-453 cells. Data are mean ± s.d. Statistical analysis was performed using two-tailed Student’s t-tests; *P < 0.05. n = 9 experiments. Clones marked in red font were excluded from statistical tests (Methods). Data from additional cell lines are shown in Extended Data Figs. 6 and 7.
Fig. 4
Fig. 4. APOBEC3 deaminases drive the acquisition of clustered mutations in human cancer cells.
a, Rainfall plots of the mutations acquired during in vitro propagation with each dot representing the distance between two SBSs. Dots are colour-coded on the basis of cluster type. log10-transformed intermutation distances are plotted on the y axes. The red lines represent sample-dependent intermutation distance cut-offs for detecting clustered mutations (Methods). b,d, Mutation spectra of clustered mutations in APOBEC3-associated (b) and non-APOBEC3-associated (d) contexts acquired in daughter clones from the indicated cell lines and genotypes. Mutational profiles plotted as the numbers of clustered genome-wide substitutions (subs) (y axis) at cytosine or thymine bases classified into 96 possible trinucleotide sequence contexts (x axis; Extended Data Fig. 4a). c,e, Clustered tumour mutational burdens (TMB), defined as numbers of total, kataegis and omikli APOBEC3-associated (c) (purple; cytosine mutations at TCN contexts) and non-APOBEC3-associated (e) (black; all other mutations) clustered SBSs per megabase in the indicated daughter clones. The red bars indicate the median tumour mutational burden. q values were calculated using two-tailed Mann–Whitney U-tests and were FDR-corrected using the Benjamini–Hochberg procedure; **q < 0.01, *q < 0.05; ns, not significant. Daughter clones with high proportions of shared mutations (Methods) were excluded from representation and statistical tests in c and e. Only mutations unique to individual daughter clones were considered in the representations in b and d.
Fig. 5
Fig. 5. UNG and REV1 have critical roles in the generation of APOBEC3 mutations in cancer.
ac, Mutational profiles of the indicated BT-474 (a), MDA-MB-453 (b) and BC-1 (c) clones plotted as the numbers of genome-wide substitutions (y axis) at cytosine bases classified into 48 possible trinucleotide sequence contexts (x axis; Extended Data Fig. 4a). The arrows represent the number of days spanning the cloning events of parents (left from the arrow) and daughters (right) during which mutation acquisition was tracked. df, The numbers of SBSs attributed to colour-coded mutational signatures discovered in daughter clones from the indicated BT-474 (d), MDA-MB-453 (e) and BC-1 (f) cell lines and genotypes. SBSs from wild-type daughters were duplicated from Fig. 3c,d,f to facilitate the comparison. gj, The proportions of the indicated mutation types in TCN contexts in the indicated BT-474 (g,h), MDA-MB-453 (i) and BC-1 (j) clones. q values indicate the differences between the indicated experiments in the proportions of C>A and C>G mutations (g,i,j) or C>G mutations (h). Only clones that were otherwise considered in statistical analyses are shown (Methods). q values (dj) were calculated using one-tailed Mann-Whitney U-tests and FDR-corrected using the Benjamini–Hochberg procedure. k,n, Confluency measurements of the indicated cell lines. Data are mean ± s.d. of three technical replicates. Each experiment is representative of n = 3 biological replicates. l,o, Clonogenic survival of the indicated BT-474 (l) and MDA-MB-453 (o) cell lines. m,p, Quantification of clonogenic survival as in l and o. Data are mean ± s.d. Statistical analysis was performed using one-way ANOVA with Tukey multiple-comparison test; ****P < 0.0001. n = 3 experiments.
Extended Data Fig. 1
Extended Data Fig. 1. Generation of APOBEC3A and APOBEC3B knockout cell line clones.
a) Schematic of APOBEC3A locus. Position of exon 3, targeting sgRNAs (sgA3A #1 and sgA3A #2) and primers for PCR screening (JM669 and JM670) are indicated. b) PCR amplicons generated using primers JM669 and JM670 and genomic DNA templates prepared from the indicated cell lines. n = 2 experiments. c) Plots depict a percentage of sequenced amplicons generated as in b that contain deletions (purple) or insertions (red) at the indicated positions. d) Schematic of the APOBEC3B locus. Position of exons 2–4, targeting sgRNAs (sgA3B #1 and sgA3B #2) and primers for PCR screening (JM663 and JM636) are indicated. e) PCR amplicons generated using primers JM663 and JM636 and genomic DNA templates prepared from the indicated cell lines. n = 2 experiments. f) Plots depict a percentage of sequenced amplicons generated as in e that contain deletions (purple) and inversions (green). g) Immunoblotting with anti-APOBEC3A (01D05), anti-APOBEC3A/B/G (04A04), and anti-GFP antibodies in extracts prepared from HEK293FT cells transfected with the indicated GFP-APOBEC3 constructs. n = 3 experiments. h-m) Immunoblotting with anti-APOBEC3A (01D05), anti-APOBEC3 (04A04), anti-UNG, and anti-actin antibodies in the indicated cell lines (h-j,l,m, 3 experiments; k, n = 2 experiments).
Extended Data Fig. 2
Extended Data Fig. 2. APOBEC3 expression and deaminase activity in cancer cell lines.
a) Normalized APOBEC3 mRNA levels in the indicated cell lines based on qPCR. The mean ± S.D. of n = 3 independent biological replicates are shown. b,d,f) Cytosine deaminase activity in the indicated cell lines measured against linear or hairpin probes ± RNase treatment to degrade RNA in extracts. c,e,g) Quantification of APOBEC3 deaminase activity as a percentage of processed DNA as in b,d,f) (Mean, ****p < 0.0001; **p < 0.01 ns, not significant, one-way ANOVA with Tukey’s multiple-comparisons test, c,e) n = 3, g) n = 4).
Extended Data Fig. 3
Extended Data Fig. 3. Generation of REV1 and UNG knockout cell line clones.
a) Schematic of UNG locus. Position of exon 1, targeting sgRNAs (sgUNG #1, sgUNG #2 and sgUNG#3) and primers for PCR screening (JM1093 and JM1094) are indicated. b) PCR amplicons generated using primers JM1093 and JM1094 and genomic DNA templates prepared from the indicated cell lines. n = 2 experiments. c) Plots depict a percentage of sequenced amplicons generated as in b that contain deletions (purple). d) Schematic of REV1 locus. Position of exon 4, targeting sgRNAs (sgREV1 #1, sgREV1 #2 and sgREV1 #3), and primers for PCR screening (KC35 and KC36) are indicated. e) PCR amplicons generated using primers KC35 and KC36 and genomic DNA templates prepared from the indicated cell lines. n = 2 experiments. f) Plots depict a percentage of sequenced amplicons generated as in e that contain deletions (purple). g) Schematic of SMUG1 locus. Position of exon 2, targeting sgRNAs (sgSMUG1 #1, sgSMUG #2 and sgSMUG #3), and primers for PCR screening (KC23 and KC21) are indicated. h) PCR amplicons generated using primers KC23 and KC21 and genomic DNA templates prepared from the indicated cell lines. n = 2 experiments. i) Plots depict a percentage of sequenced amplicons generated as in h that contain deletions (purple). j) Immunoblotting with anti-APOBEC3A (01D05), anti-APOBEC3 (04A04), anti-UNG, anti-REV1, anti-SMUG1, and anti-actin antibodies in the indicated cell lines. n = 3 experiments.
Extended Data Fig. 4
Extended Data Fig. 4. Mutational signature extraction and cancer cell line characterization.
a) Profiles of mutational signatures de novo extracted from SBS identified in mutational catalogues from 5 stock cell lines and 251 parent and daughter clones. Each signature is displayed as the percentage of mutations (y-axis) attributed to 96 SBS classes (x-axis), which are defined by the colour-coded substitution class and sequence context immediately 3′ and 5′ to the mutated base. b) Distributions of variant allele fractions (VAFs) of mutations identified in daughter clones from the parental lineages indicated on top. c) Population doubling measures over successive passages or confluency measurements from the indicated cell lines. Mean ± SD from n = 3 independent biological replicates are shown. d) Plots showing percentages of apoptotic, necrotic, or living cells as indicated by propidium iodide and annexin V staining (Mean ± SD, ns, not significant, one-way ANOVA with Tukey’s multiple-comparisons test, n = 3).
Extended Data Fig. 5
Extended Data Fig. 5. Analysis of indels and chromosome rearrangements across cell line clones.
a) Plots showing numbers of indels and b) chromosome rearrangements detected genome-wide in the indicated cell line clones. Clones marked in red were excluded from statistical tests on mutational burdens across the study (Methods).
Extended Data Fig. 6
Extended Data Fig. 6. APOBEC3 deaminases drive acquisition of SBS2 and SBS13 in human cancer cells.
a,f,j) Mutational profiles of indicated clones plotted as numbers of genome-wide substitutions (y-axis) at cytosine bases classified into 48 possible trinucleotide sequence contexts (x-axis; detailed in Extended Data Fig. 4a). Arrows indicate the number of days spanning the cloning events of parents (left of arrow) and daughters (right), during which mutation acquisition was tracked. b) Numbers of SBS attributed to colour-coded mutational signatures discovered in indicated daughter clones. Q-values were calculated using one-tailed Mann-Whitney U-tests and FDR corrected using the Benjamini-Hochberg procedure.c,d,g,i,k) Focused plots showing indicated SBS2, SBS13a/b burdens in indicated daughter clones. e,h,l,m) Enrichment of cytosine mutations at APOBEC3B-preferred RTCA and APOBEC3A-preferred YTCA sequence contexts (R = purine base, Y = pyrimidine base, N = any base) in daughter clones from indicated cell lines and genotypes. m) Quantification of DDOST 558C>U levels in the indicated HT-1376 cells. Bars represent the mean of 3 technical replicates and n = 2 experiments. Clones marked in red across panels were excluded from statistical tests (Methods).
Extended Data Fig. 7
Extended Data Fig. 7. Characterization of APOBEC3A and APOBEC3B expression levels.
a) Quantification of APOBEC3A protein levels relative to corresponding actin signals in the indicated daughter clones as shown in Fig. 3k (Mean, ***p = 0.0003, Student’s t-test, n = 2 experiments). b-h) Immunoblotting with anti-APOBEC3A (01D05), anti-APOBEC3B, and anti-actin antibodies in the indicated cell lines. i) Quantification of DDOST 558C>U levels in the indicated MDA-MB-453 cells. Bars represent the mean ± SD of DDOST 558C>U RNA editing activity across daughter clones. Data are derived from 3 shCTRL and 7 shA3B daughters across 3 technical replicates and n = 1 experiment. P-values were calculated using two-tailed Student’s t-test with Welch’s correction (*p < 0.05).
Extended Data Fig. 8
Extended Data Fig. 8. APOBEC3 deaminases drive acquisition of kataegis and omikli in human cancer cells.
Clustered tumour mutational burdens (TMB), defined as numbers of total, kataegis and omikli a) APOBEC3-associated (purple; cytosine mutations at TCN contexts) and c) non-APOBEC3-associated (black; all other mutations) clustered SBS per megabase, in indicated daughter clones. Red bars indicate median TMB. b) Clustered TMB, defined as numbers of total, kataegis and omikli clustered genome-wide events, in indicated daughter clones. q-values (panels a-c) were calculated using two-tailed Mann-Whitney U-tests and FDR corrected using the Benjamini-Hochberg procedure (**q < 0.01; *q < 0.05; ns, not significant). d) Enrichment of clustered cytosine mutations at APOBEC3B-preferred RTCA and APOBEC3A-preferred YTCA sequence contexts (R = purine base, Y = pyrimidine base, N = any base) in daughters from indicated cell lines and genotypes. e) Mutational spectra of clustered mutations in non-APOBEC3-associated contexts acquired de novo in designated clones. Clones with high proportions of shared mutations (Methods) were excluded from representation and statistical tests in panels a-c. Only mutations unique to individual daughter clones were considered in representations in panel e.
Extended Data Fig. 9
Extended Data Fig. 9. REV1 does not exhibit synthetic lethal interaction with APOBEC3.
a) Immunoblotting with anti-APOBEC3A (04A04) and anti-actin antibodies in the indicated cell lines (n = 3 experiments). b) Quantification of DDOST 558C>U levels in the indicated MDA-MB-453 cells (Mean ± SD, ns, not significant, one-way ANOVA with Tukey’s multiple-comparisons test, n = 3 experiments). c,e) Cytosine deaminase activity in the indicated cell lines measured against linear probes ± RNase treatment to degrade RNA in extracts. d,f) Quantification of APOBEC3 deaminase activity as a percentage of processed DNA as in c,e) (Mean, ns, not significant, one-way ANOVA with Tukey’s multiple-comparisons test, n = 2 experiments). g,h) Plots showing cell cycle distribution of the indicated cell lines (mean ± SD, n = 3 experiments). i) γH2AX, EdU, and DAPI levels were quantified and plotted across the indicated axes. Dots represent individual cells that were coloured according to the intensity of γH2AX staining. j) DepMap CRISPR dependency data of 27 BRCA cell lines, classified as ‘SBS2/13 negative’ and ‘SBS2/13’ positive (Methods), on REV1. The dots represent cell lines plotted alongside the y-axis denoting the Chronos Dependency Score (Methods). The box represents the 25th-75th percentile of the data, centre line represents the median, the upper and lower whiskers indicate the maximum and minimum data points without considering boxplot outliers (larger dots, respectively, any values 1.5 times the interquartile range over the 75th or under the 25th percentile). P-value was calculated using a one-tailed Mann-Whitney U test. k) Focused plots showing indicated SBS5 and ‘SBS other’ burdens in the indicated cell lines in analyses where signatures were identified with lower or higher stringency discovery penalties (Methods). q-values were calculated using one-tailed Mann-Whitney U-tests and FDR corrected using the Benjamini-Hochberg procedure. Clones marked in red were excluded from statistical tests (Methods).

Similar articles

Cited by

References

    1. Nik-Zainal S, et al. Mutational processes molding the genomes of 21 breast cancers. Cell. 2012;149:979–993. doi: 10.1016/j.cell.2012.04.024. - DOI - PMC - PubMed
    1. Roberts SA, et al. Clustered mutations in yeast and in human cancers can arise from damaged long single-strand DNA regions. Mol. Cell. 2012;46:424–435. doi: 10.1016/j.molcel.2012.03.030. - DOI - PMC - PubMed
    1. Petljak M, Maciejowski J. Molecular origins of APOBEC-associated mutations in cancer. DNA Rep. 2020;94:102905. doi: 10.1016/j.dnarep.2020.102905. - DOI - PMC - PubMed
    1. Petljak M, et al. Characterizing mutational signatures in human cancer cell lines reveals episodic APOBEC mutagenesis. Cell. 2019;176:1282–1294. doi: 10.1016/j.cell.2019.02.012. - DOI - PMC - PubMed
    1. Stephens P, et al. A screen of the complete protein kinase gene family identifies diverse patterns of somatic mutations in human breast cancer. Nat. Genet. 2005;37:590–592. doi: 10.1038/ng1571. - DOI - PubMed