. 2022 Aug;608(7923):586-592.
doi: 10.1038/s41586-022-04964-y. Epub 2022 Jul 20.

Neurotensin orchestrates valence assignment in the amygdala

Affiliations

Neurotensin orchestrates valence assignment in the amygdala

Hao Li et al. Nature. 2022 Aug.

Abstract

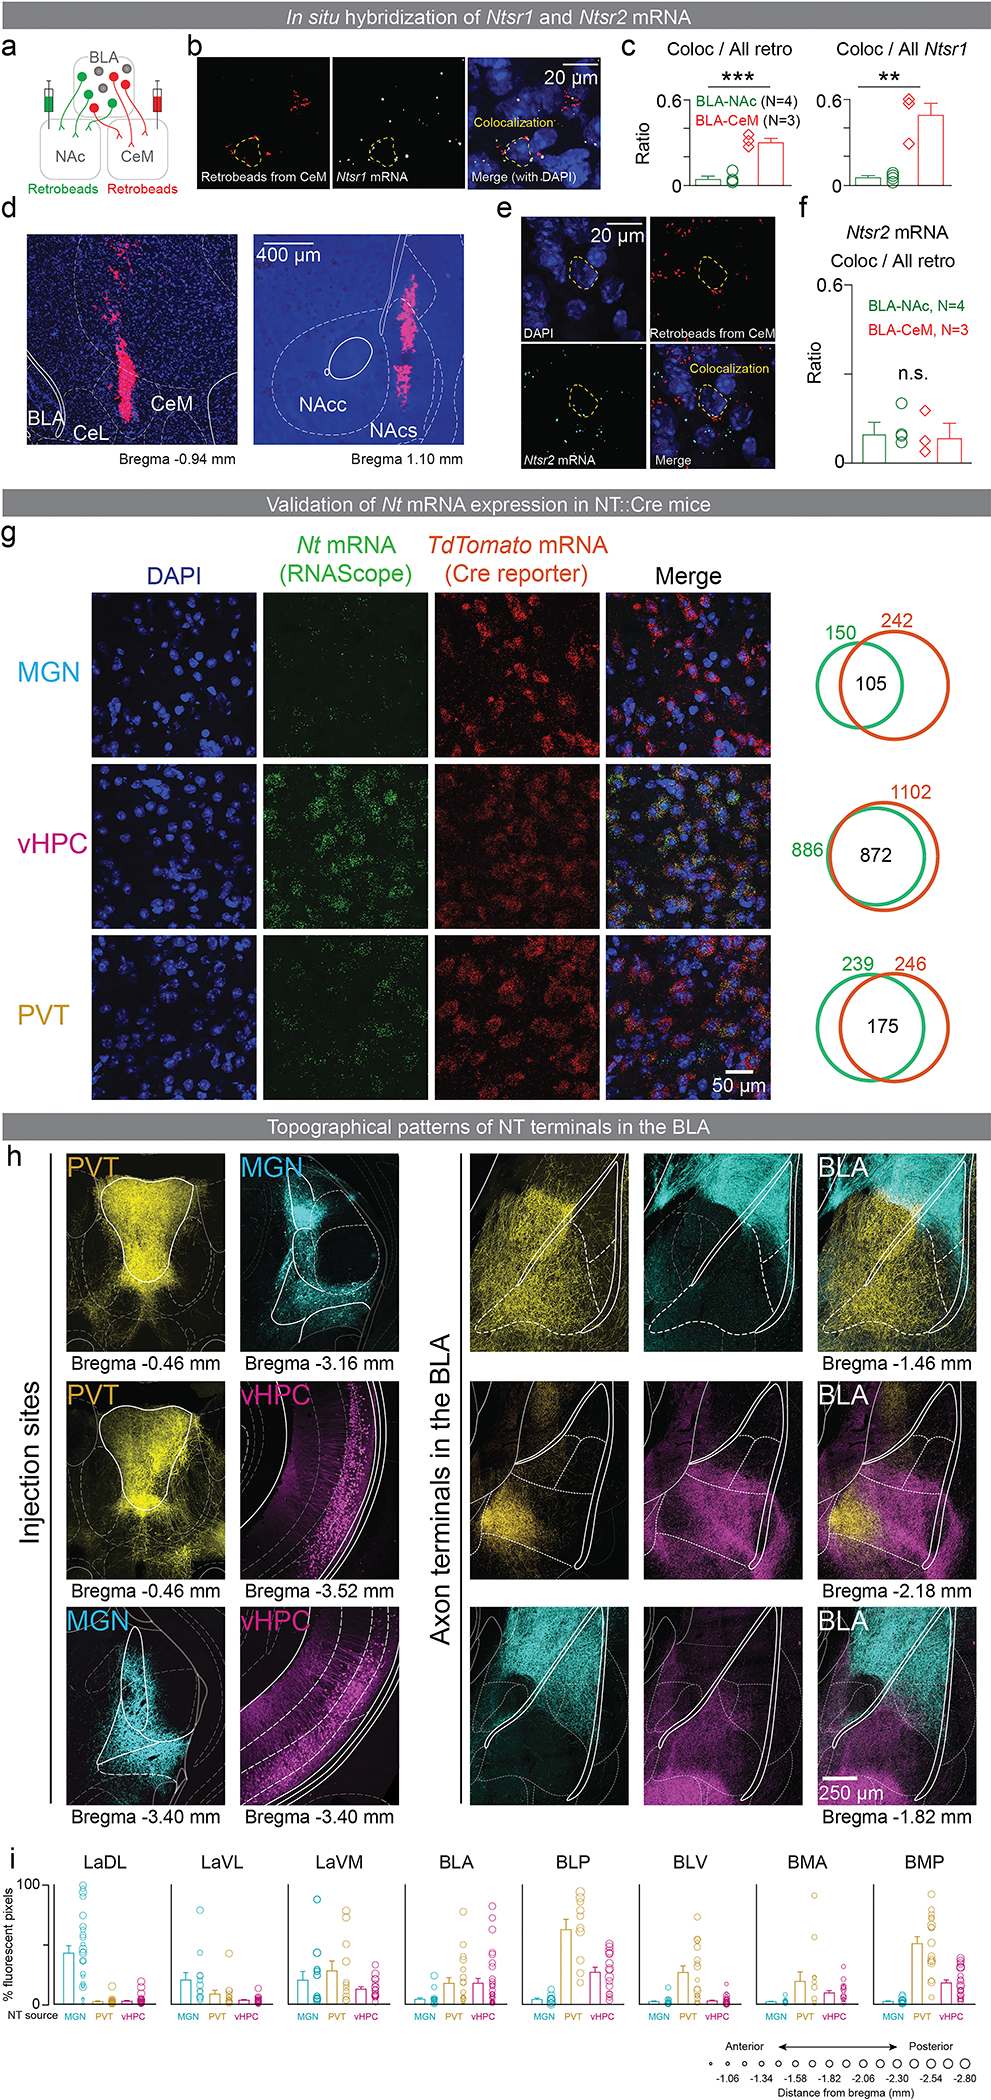
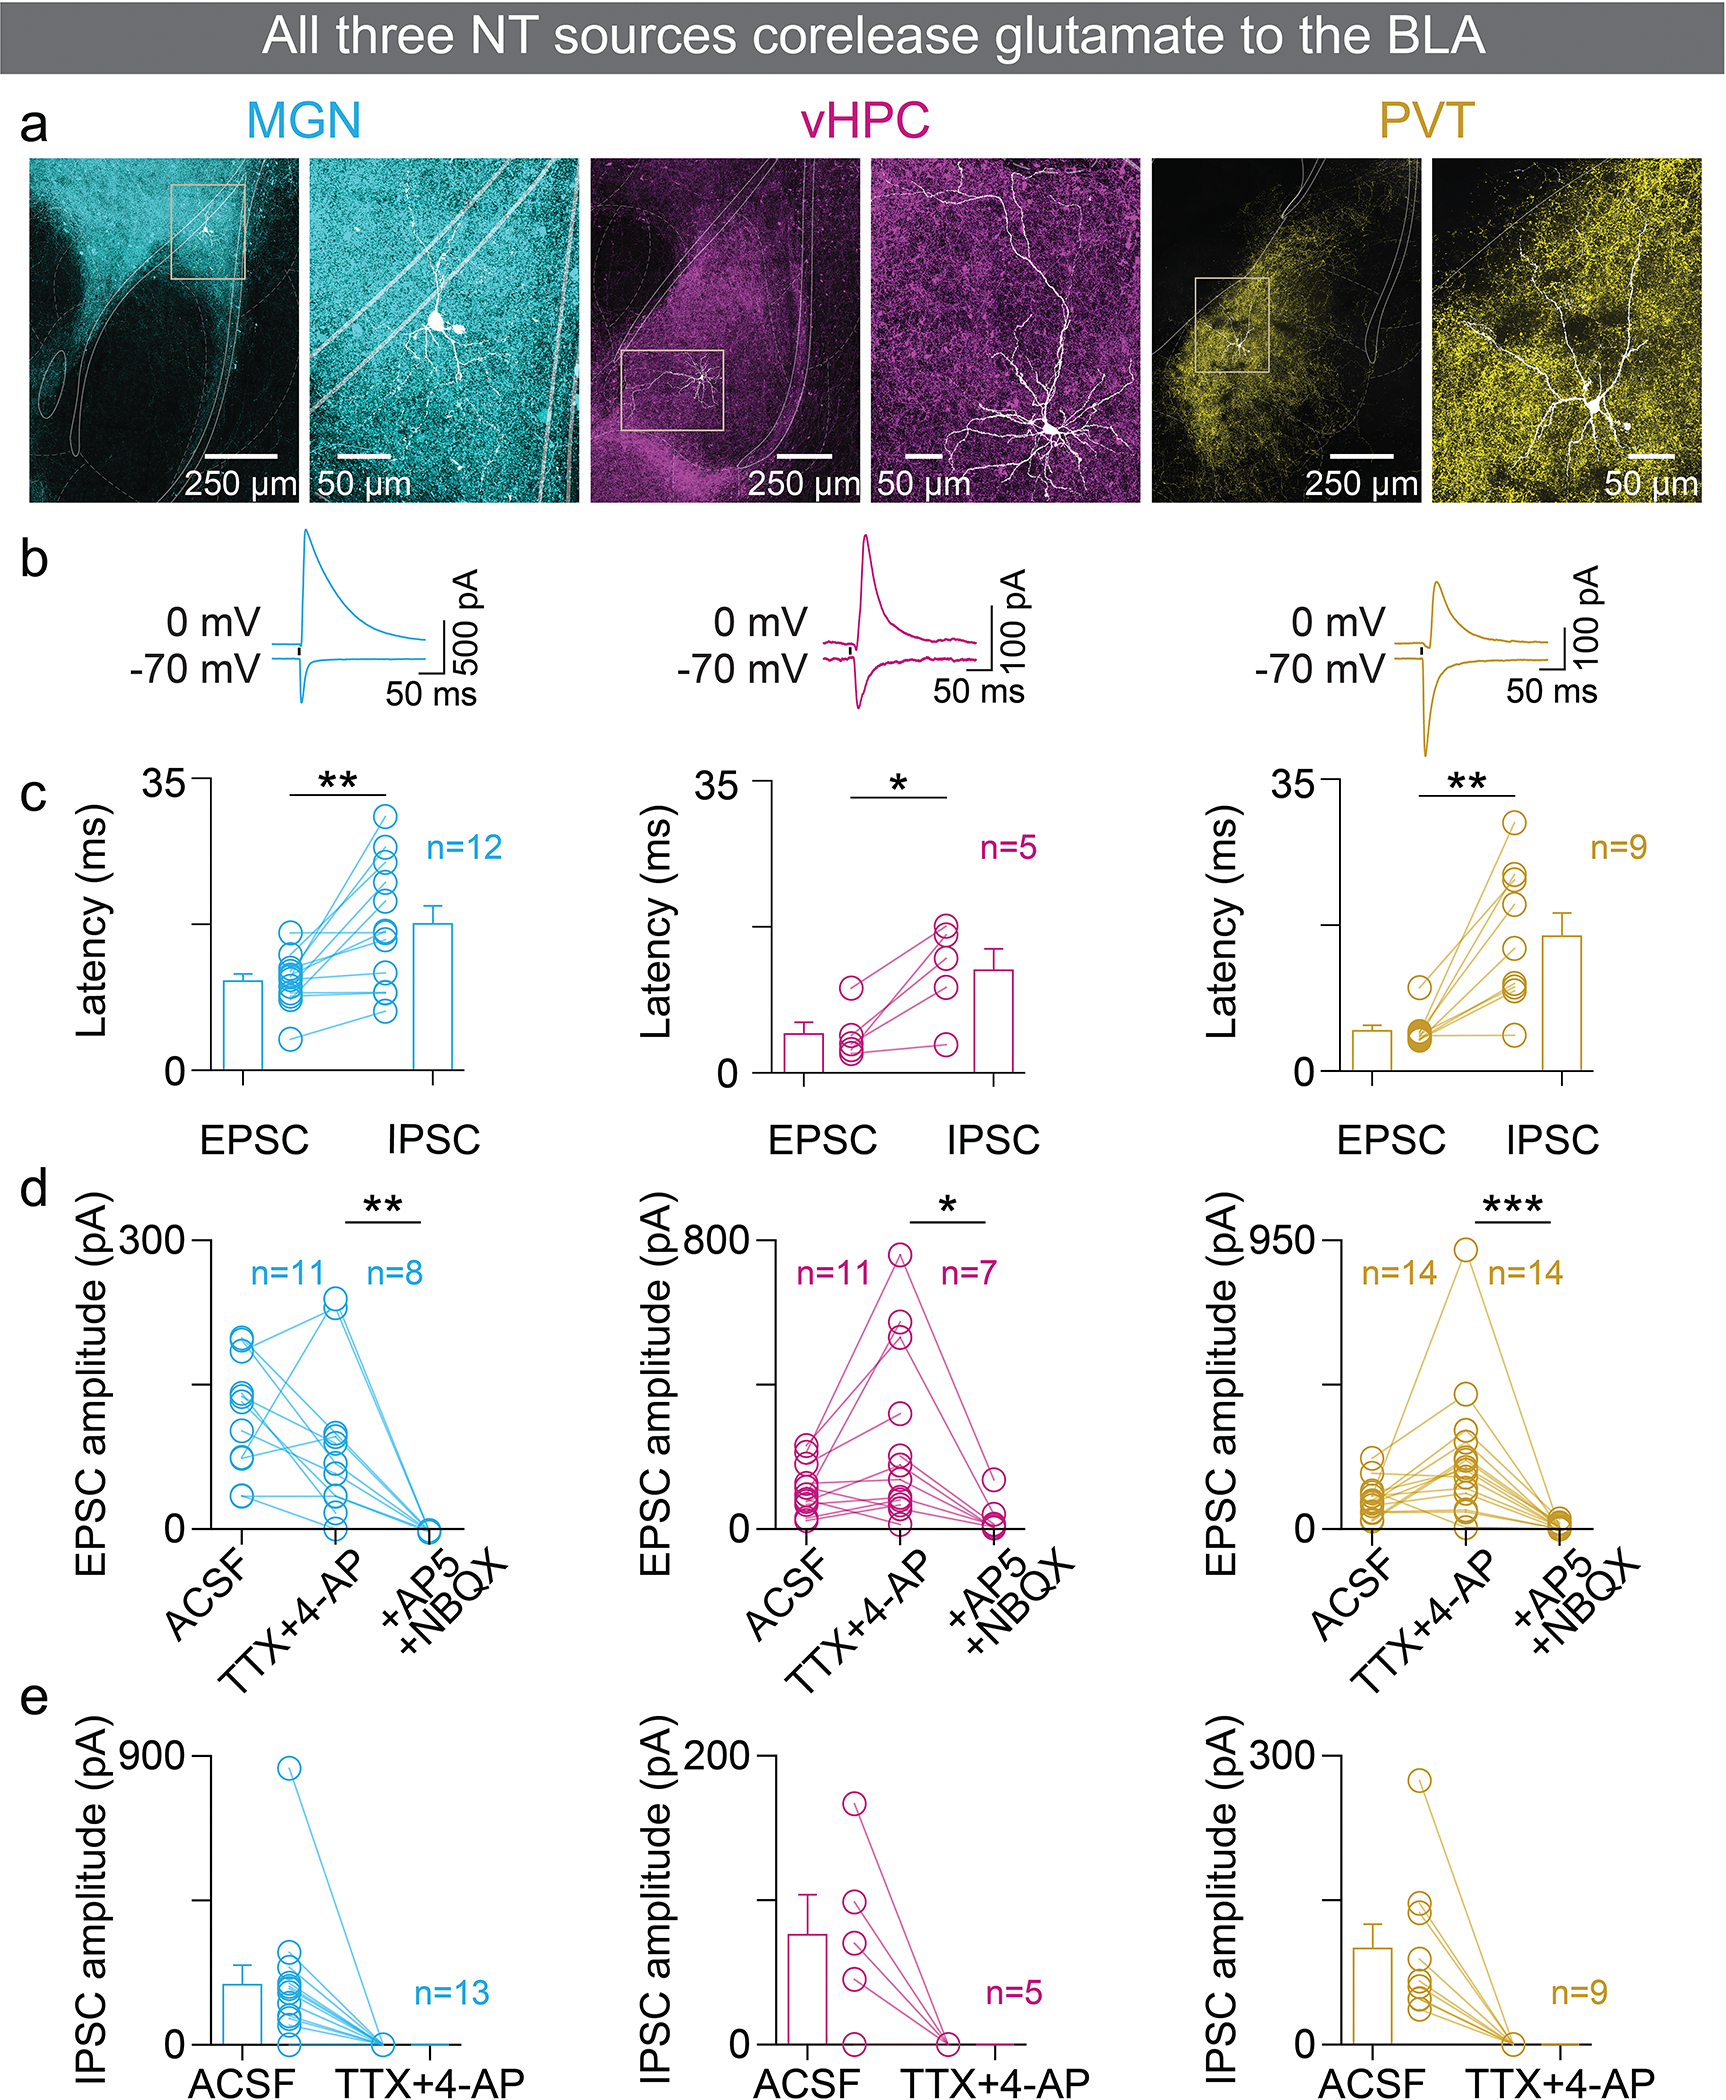
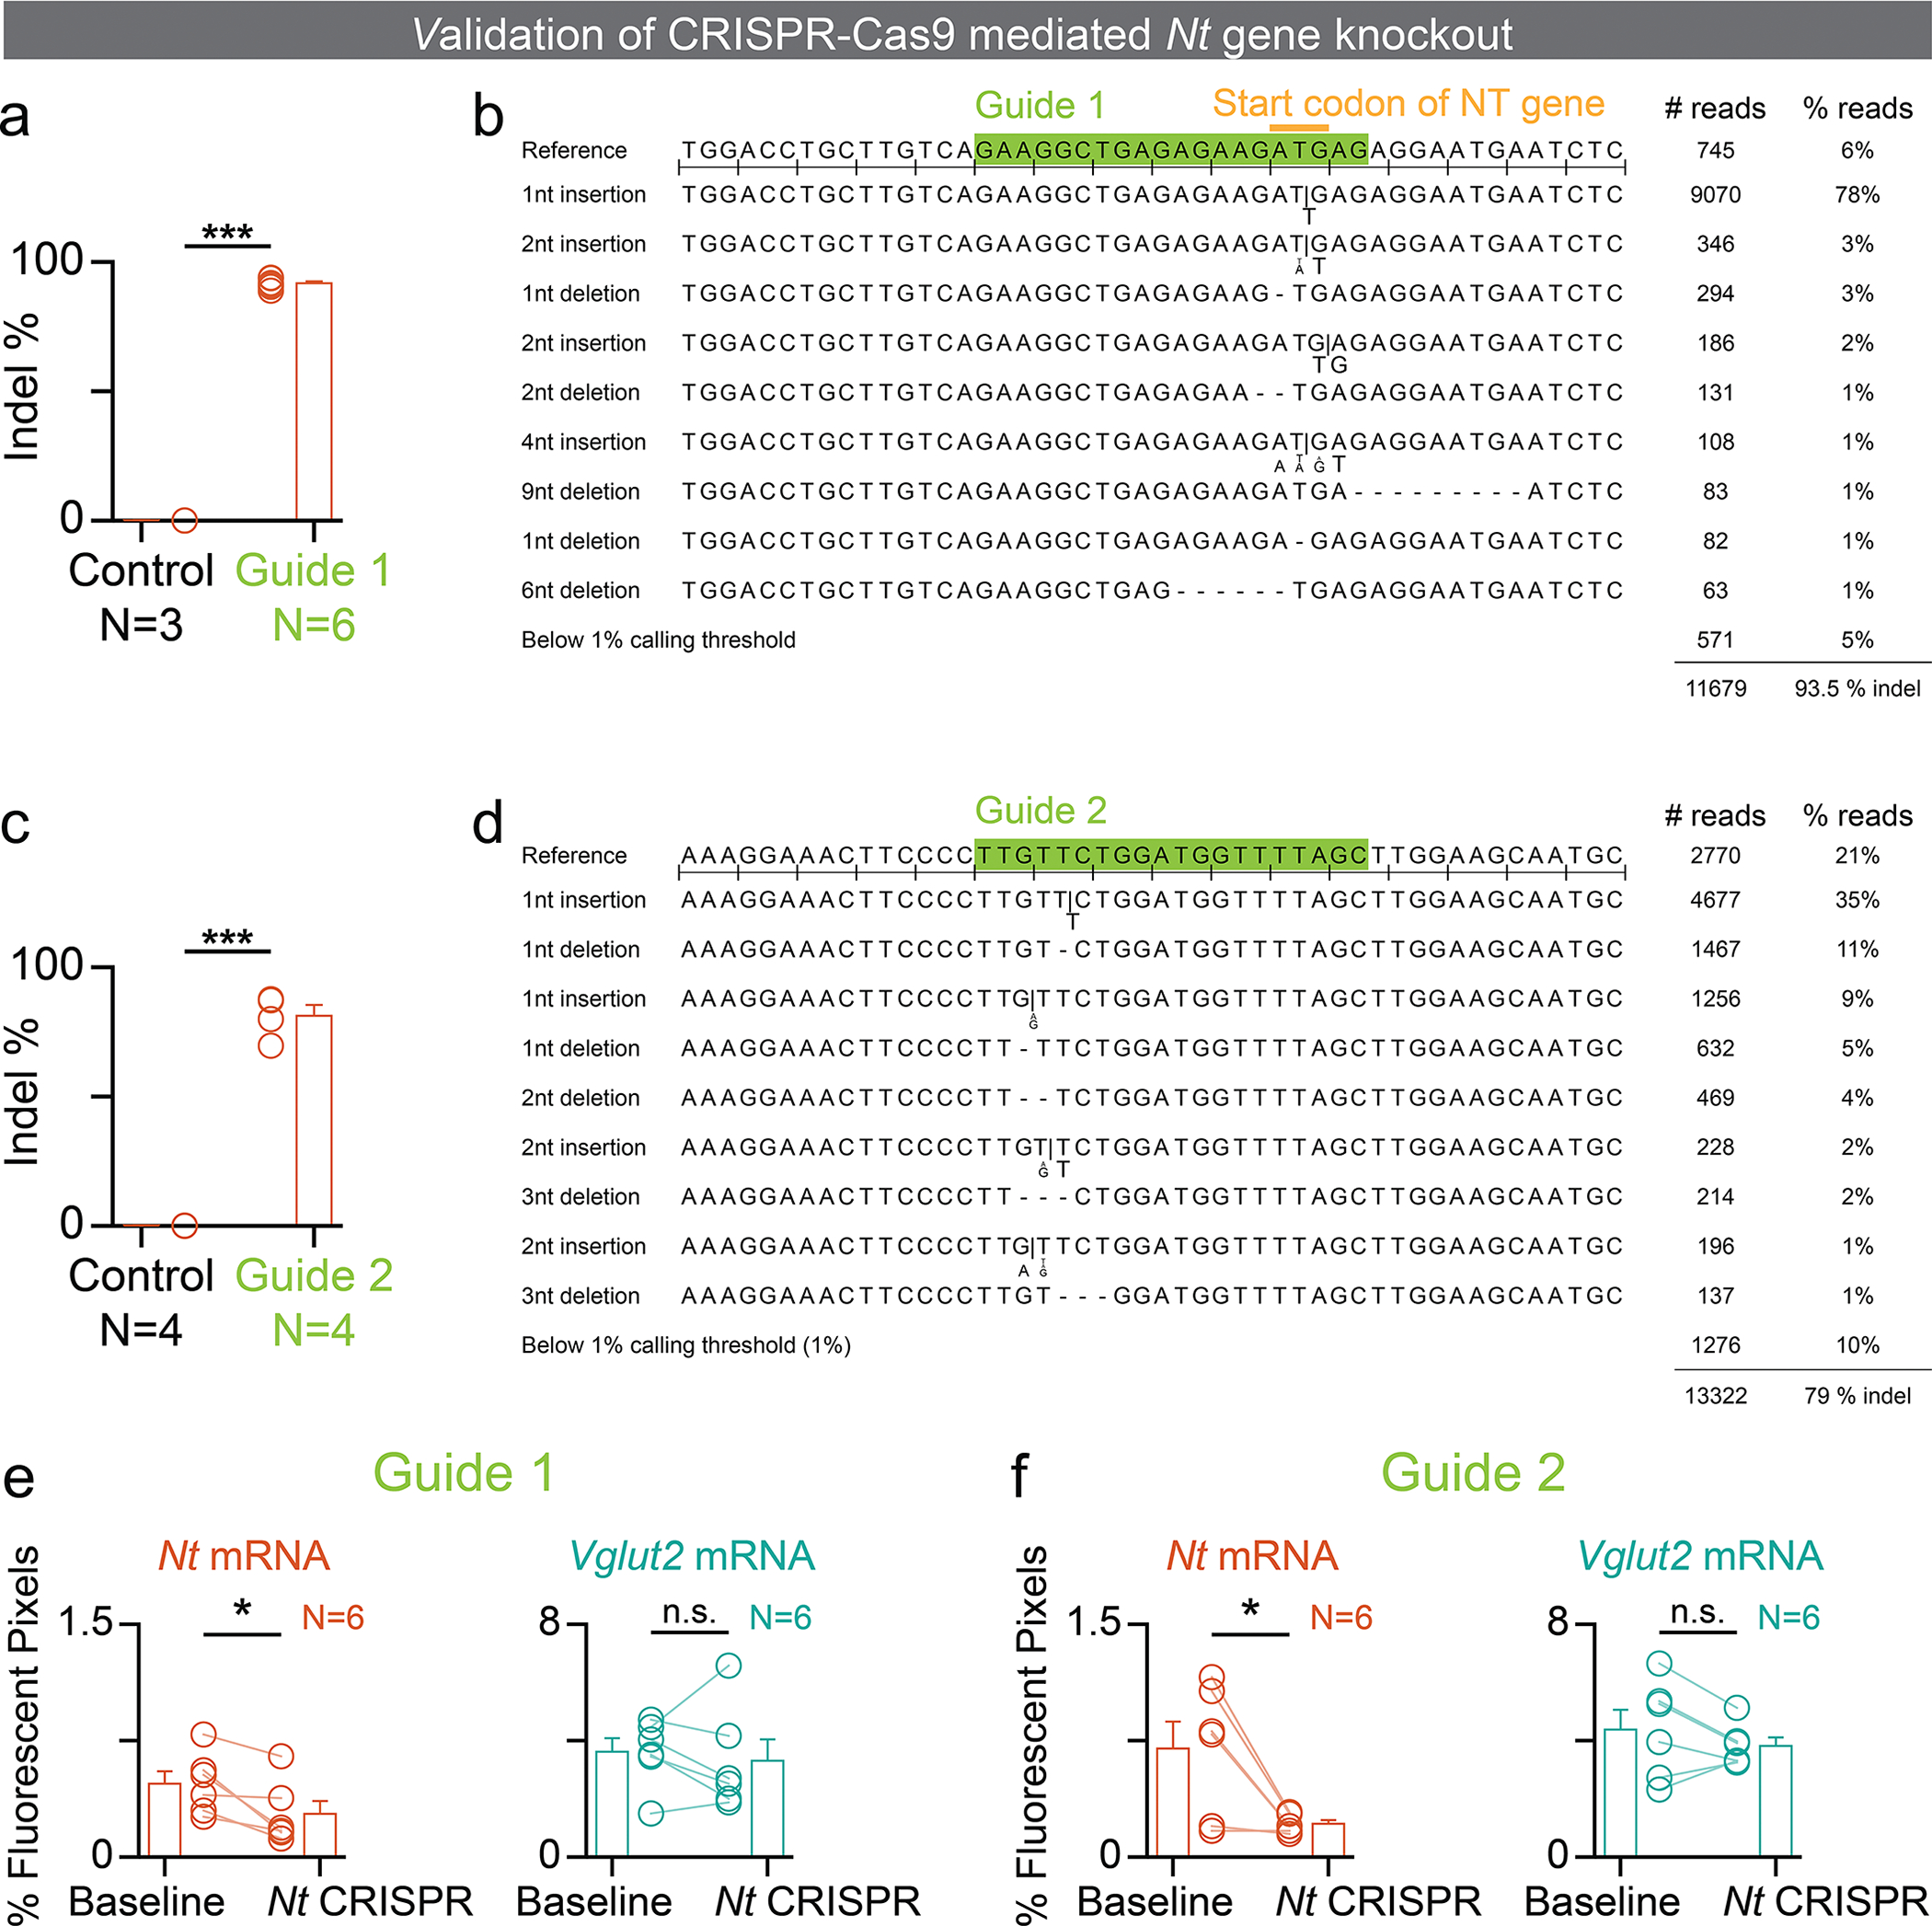
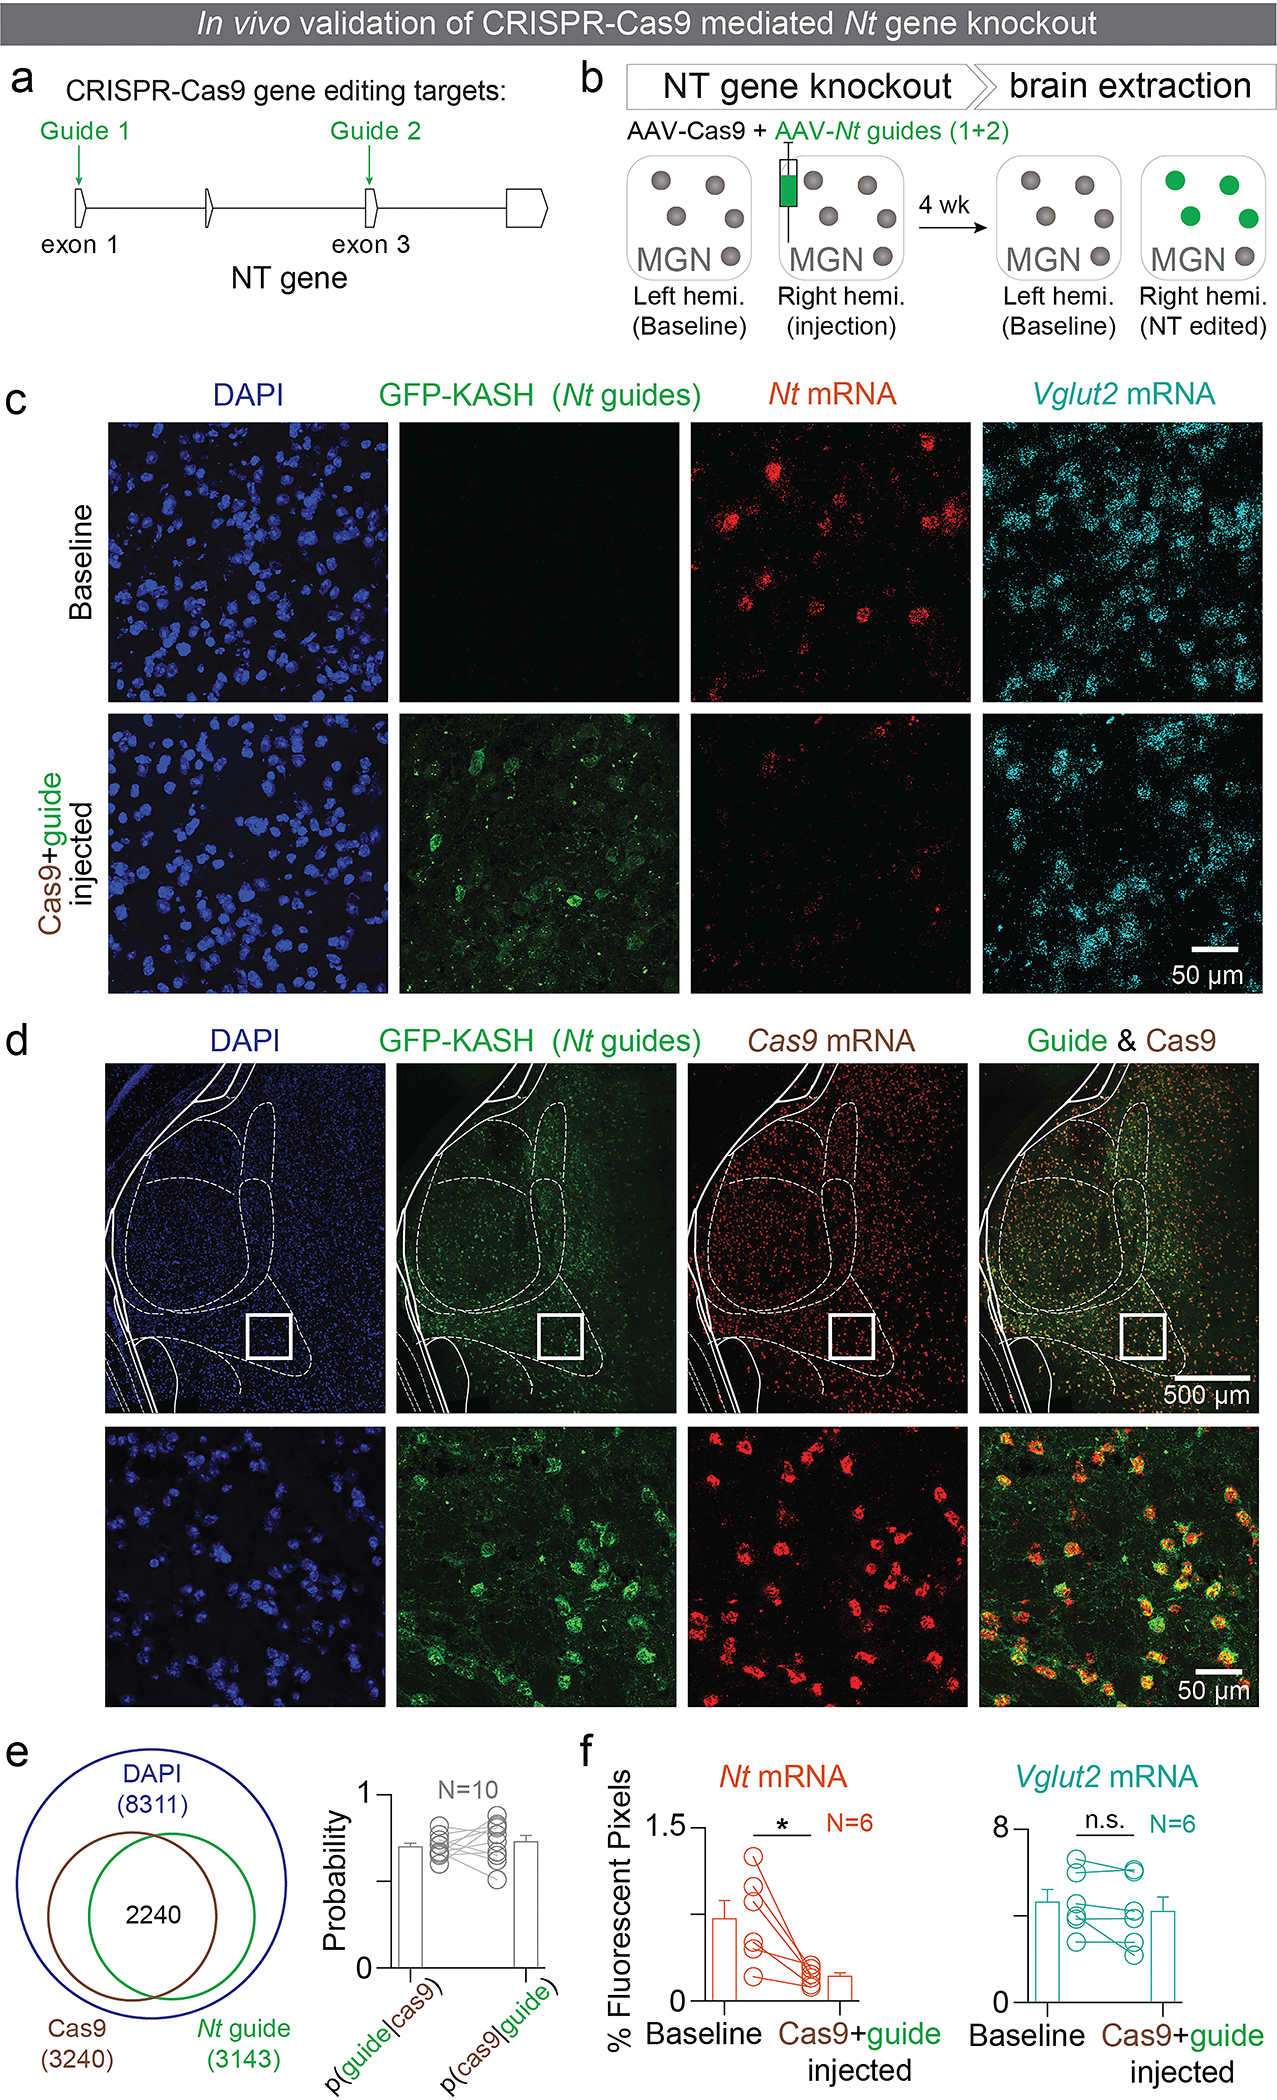
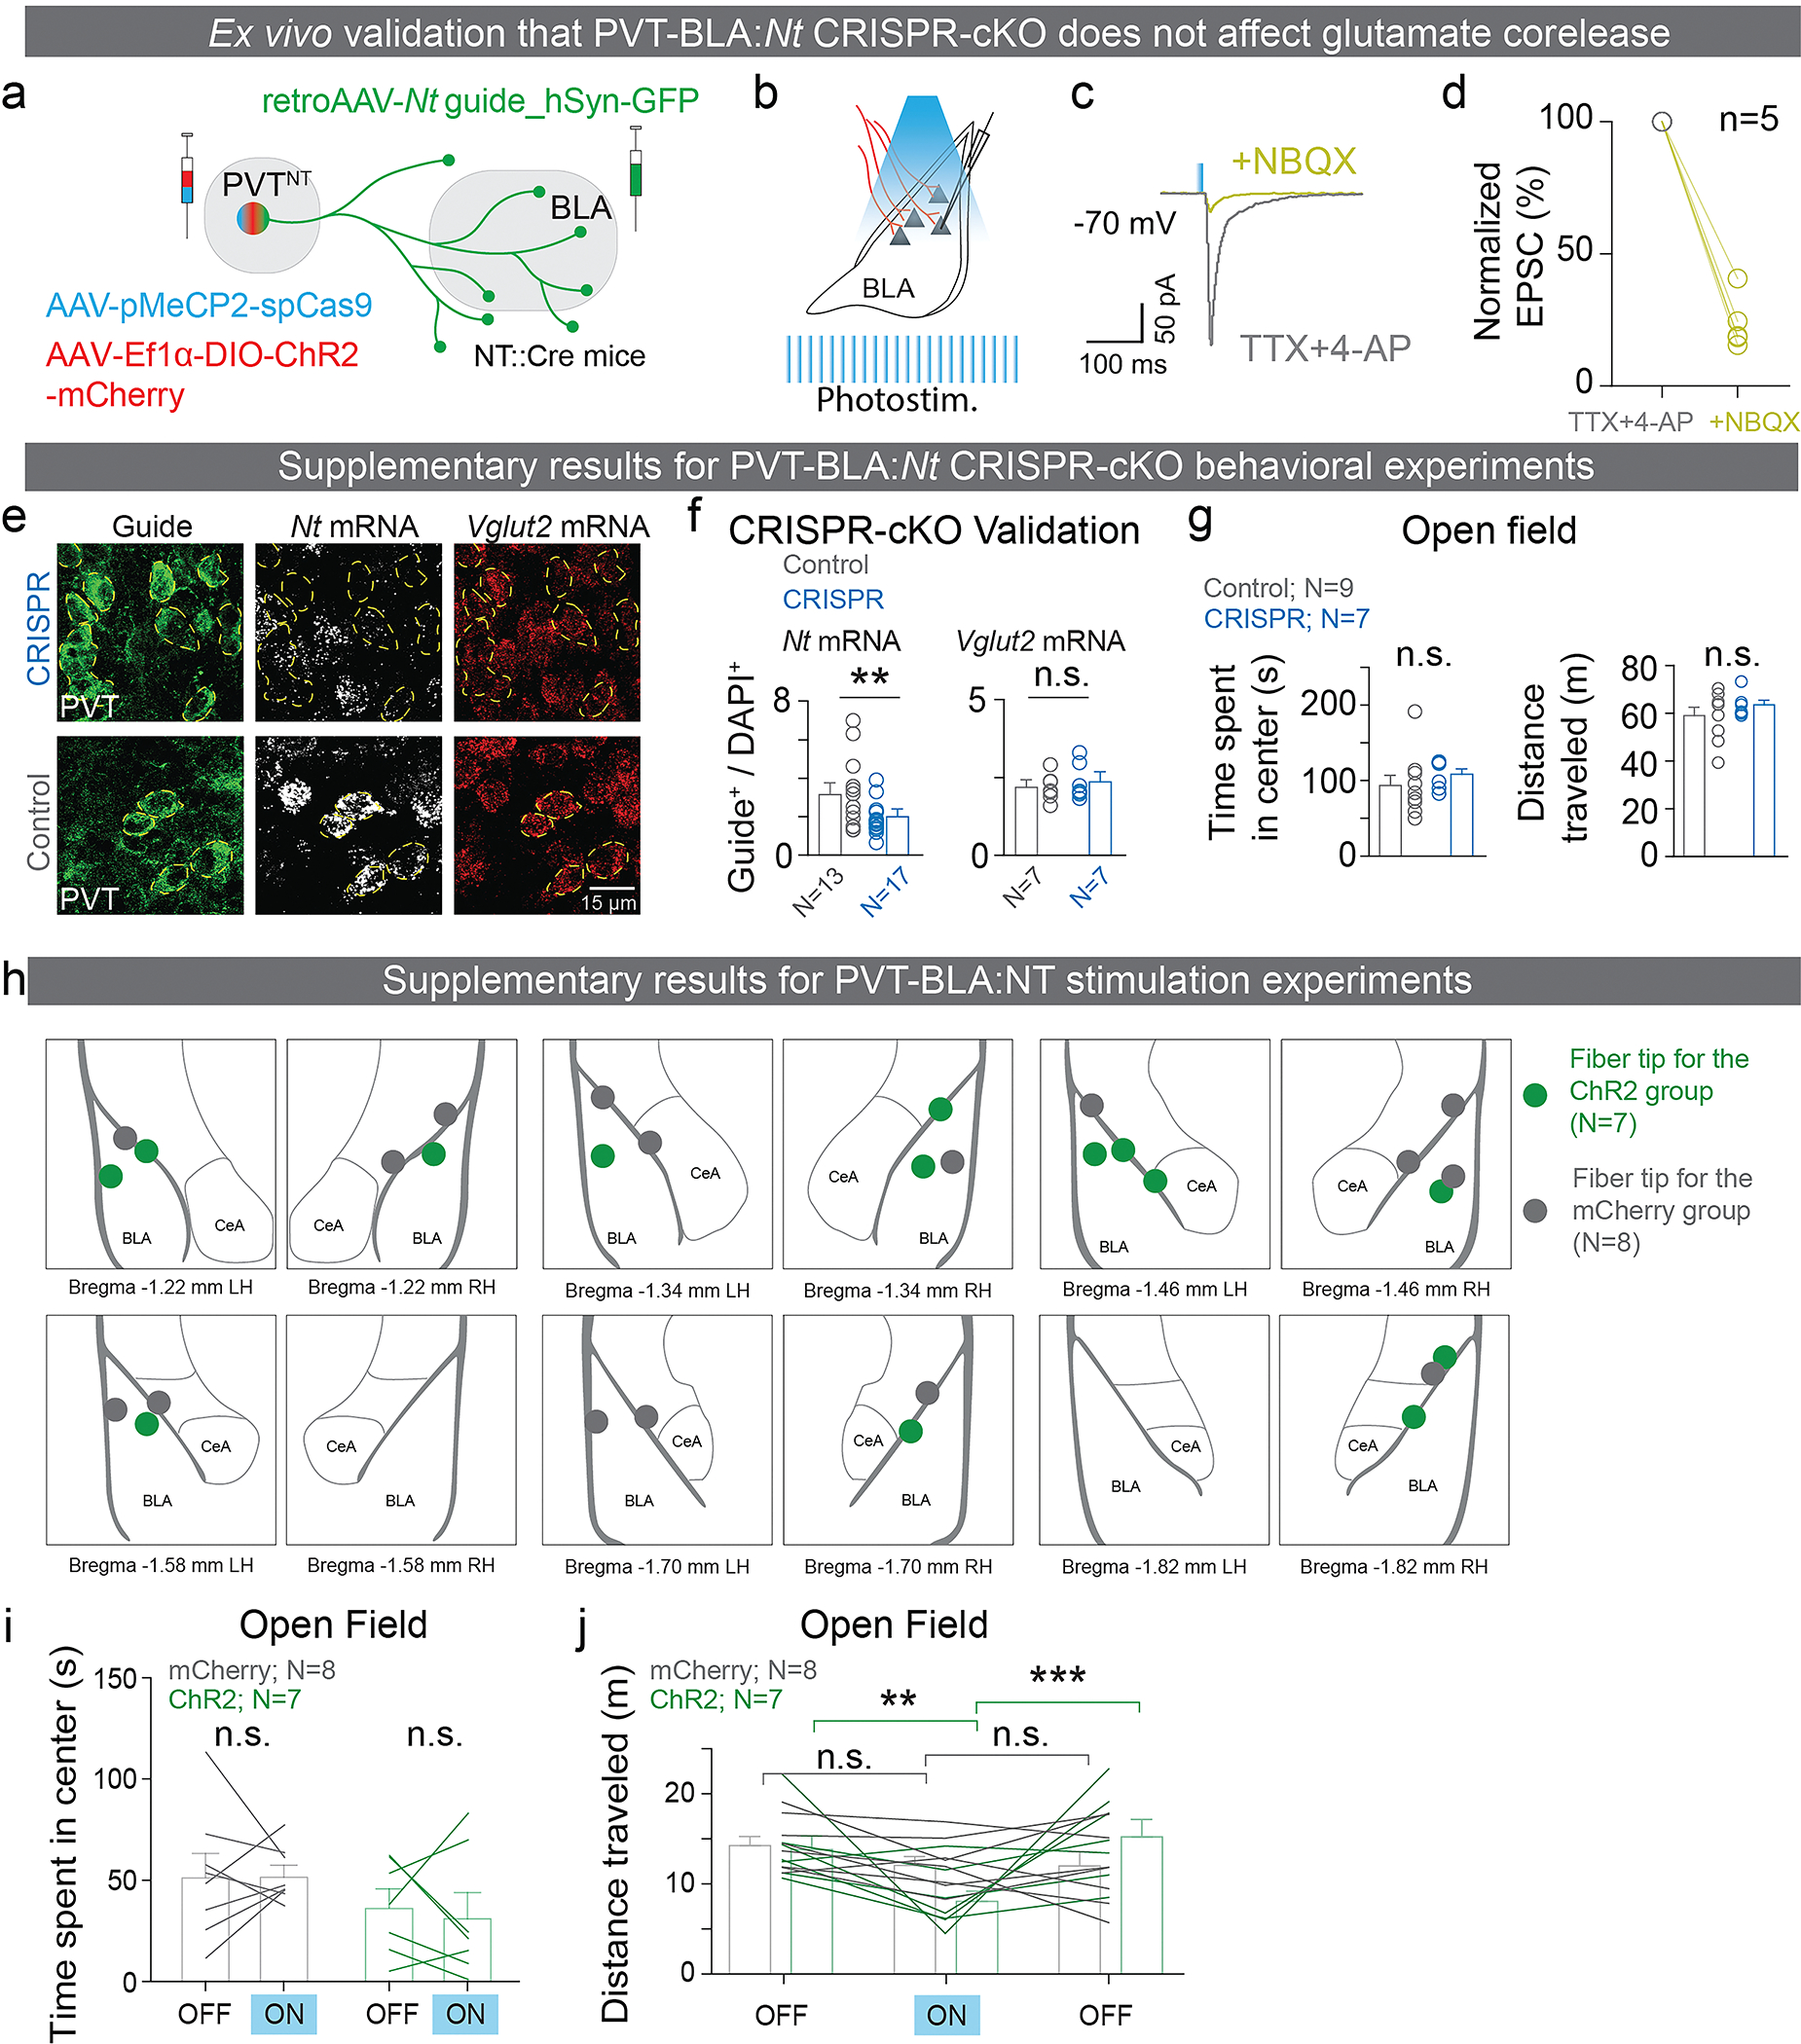
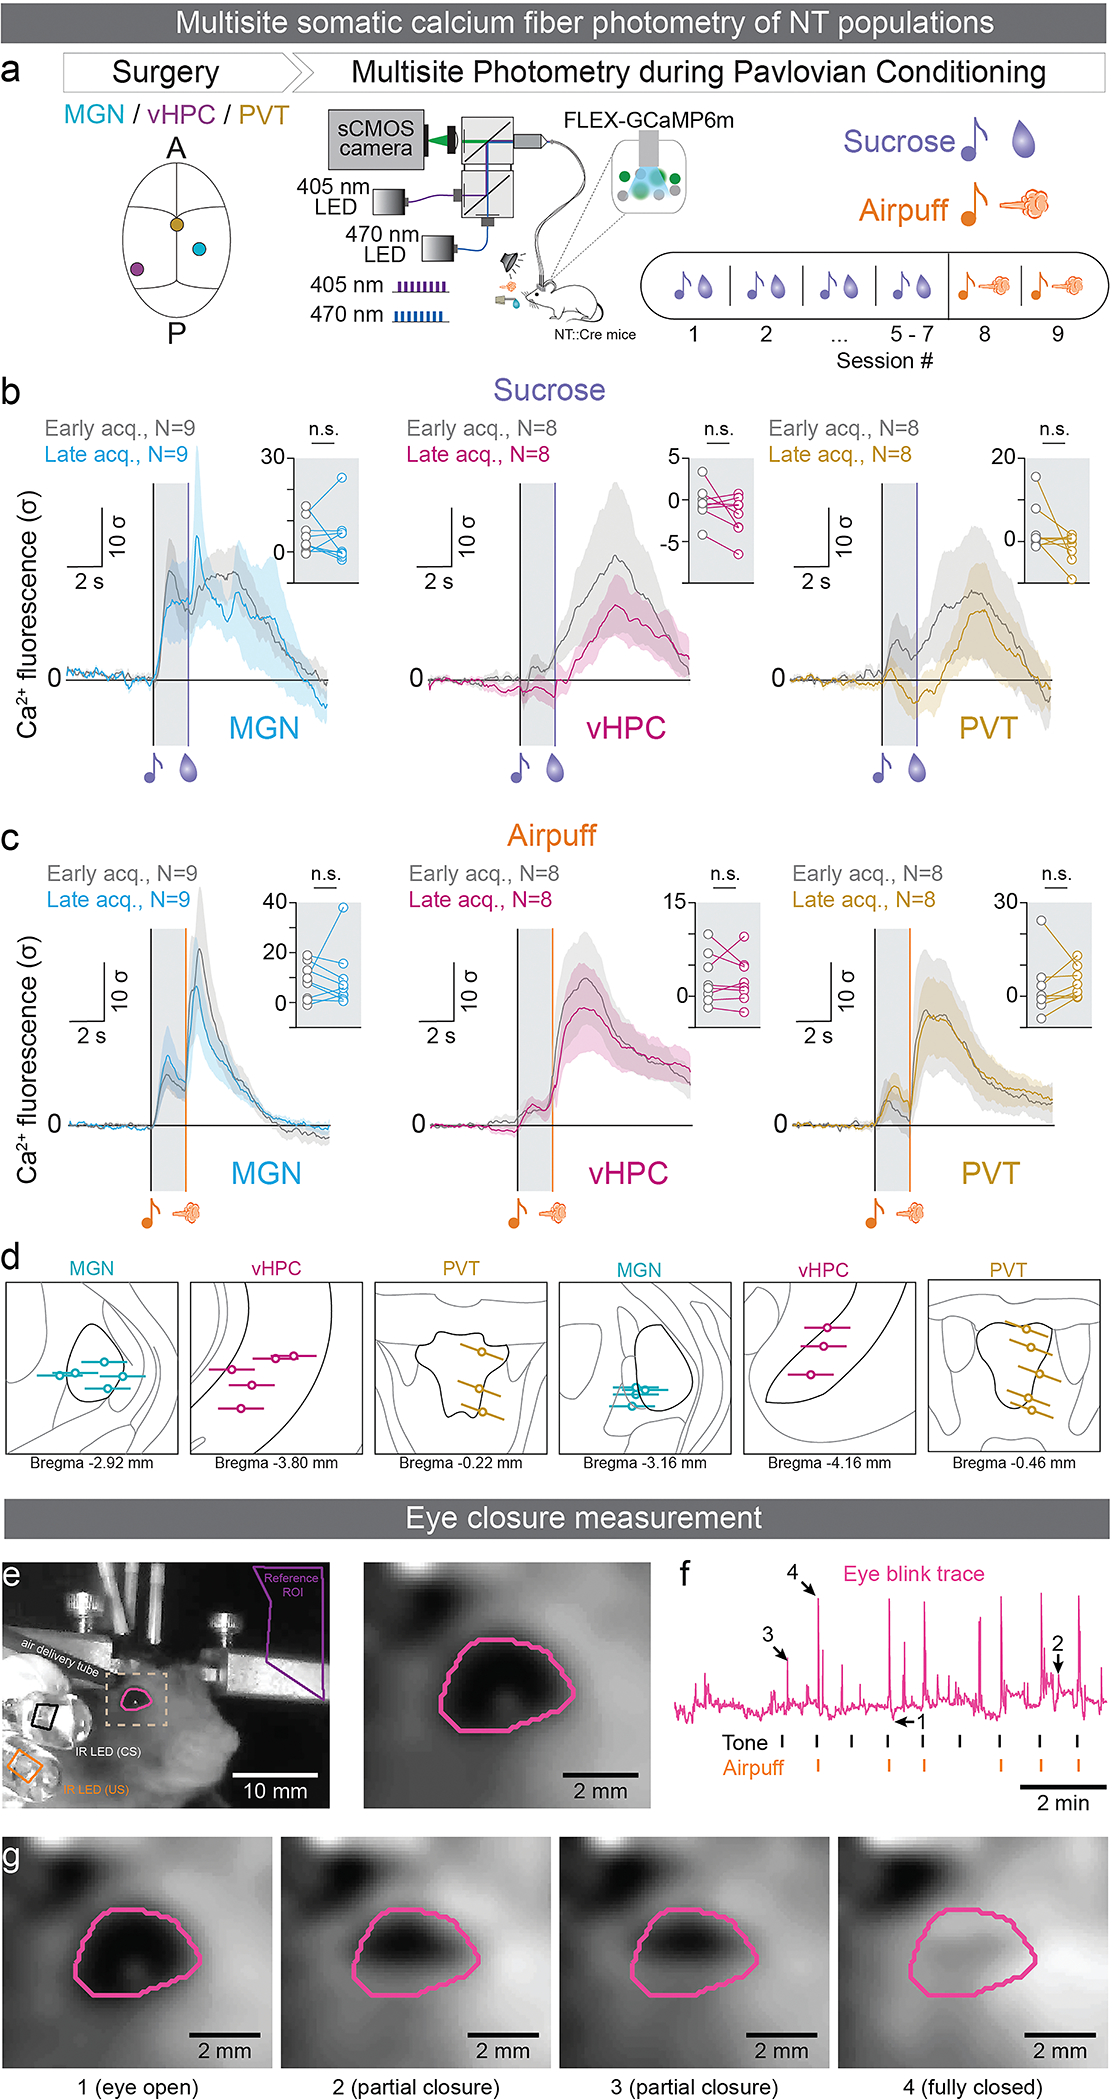
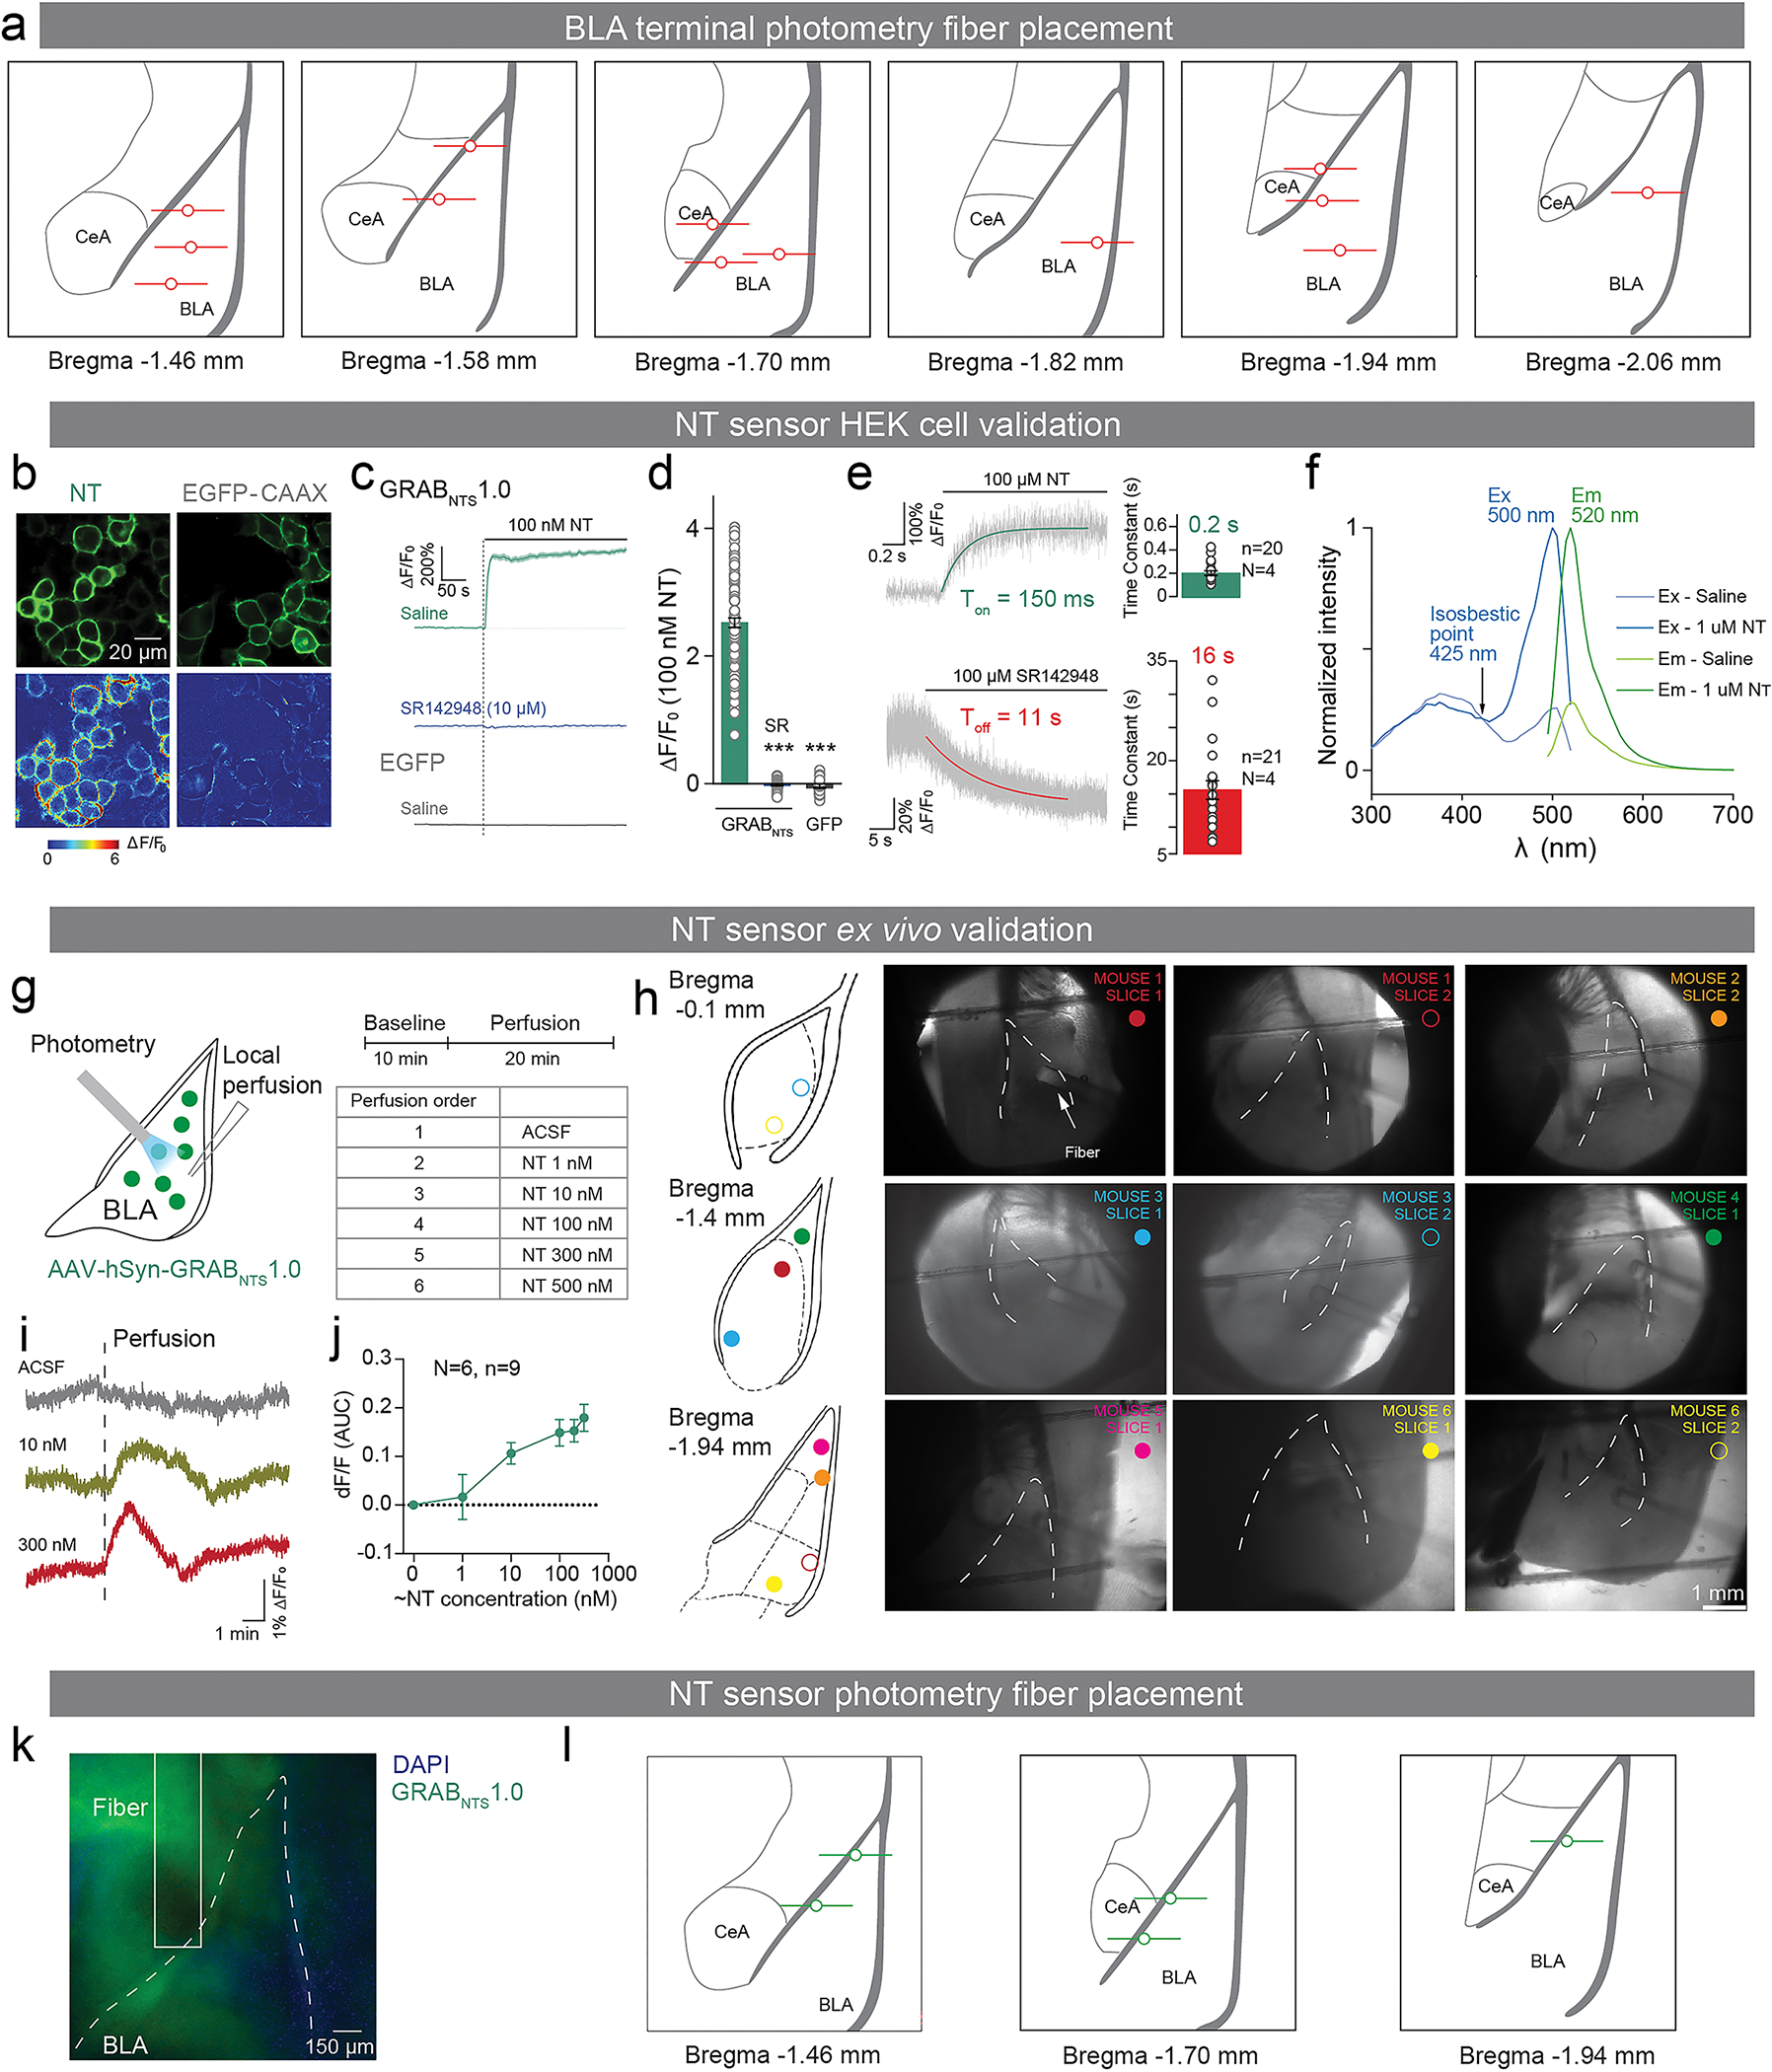
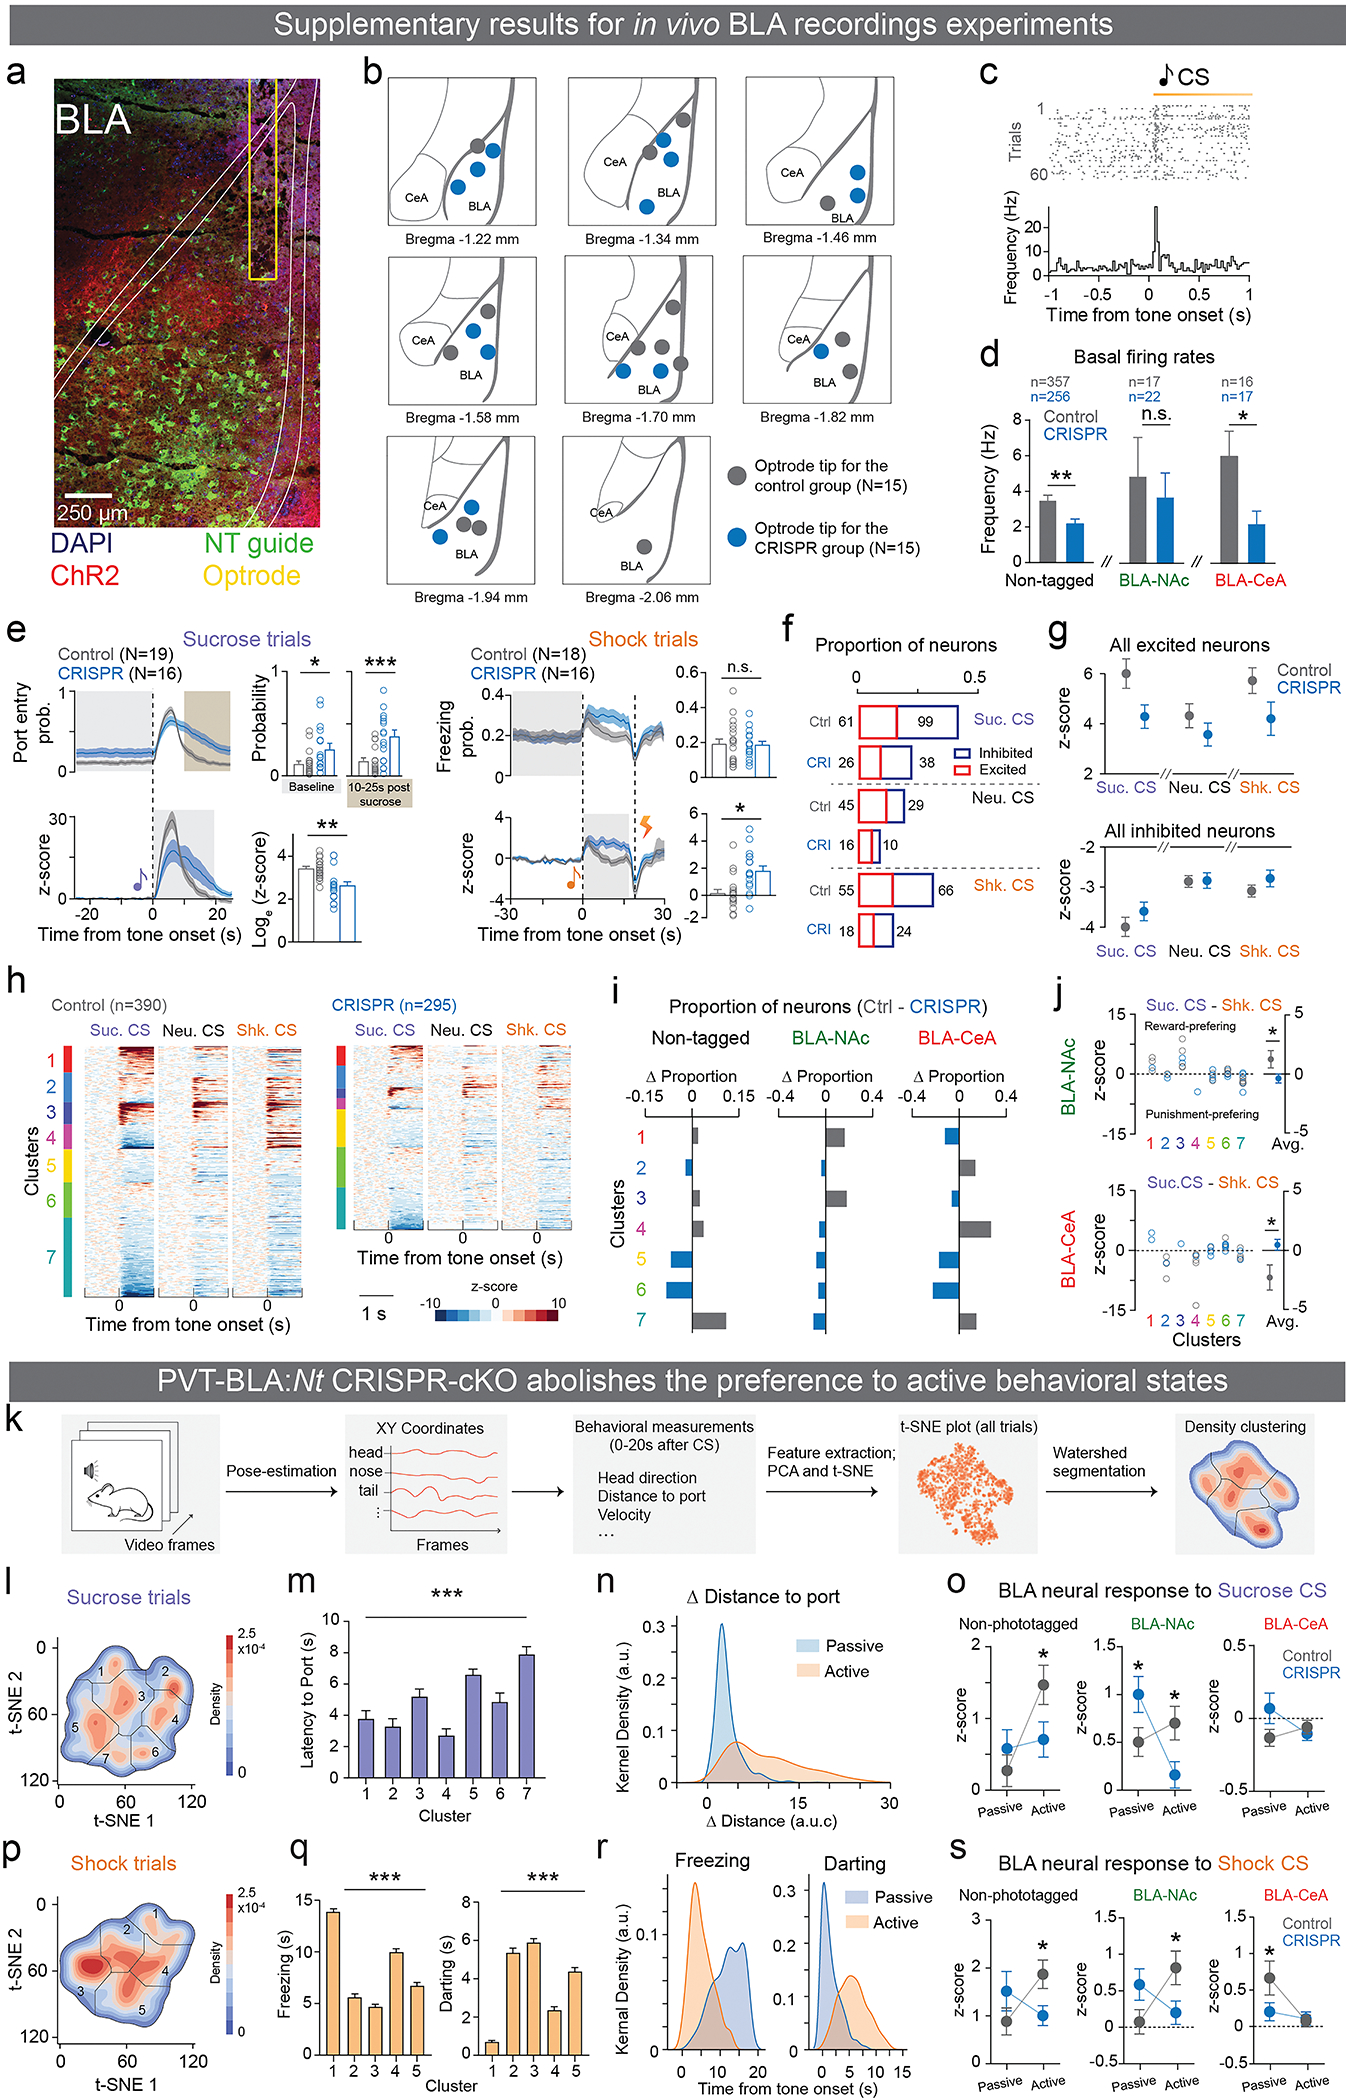
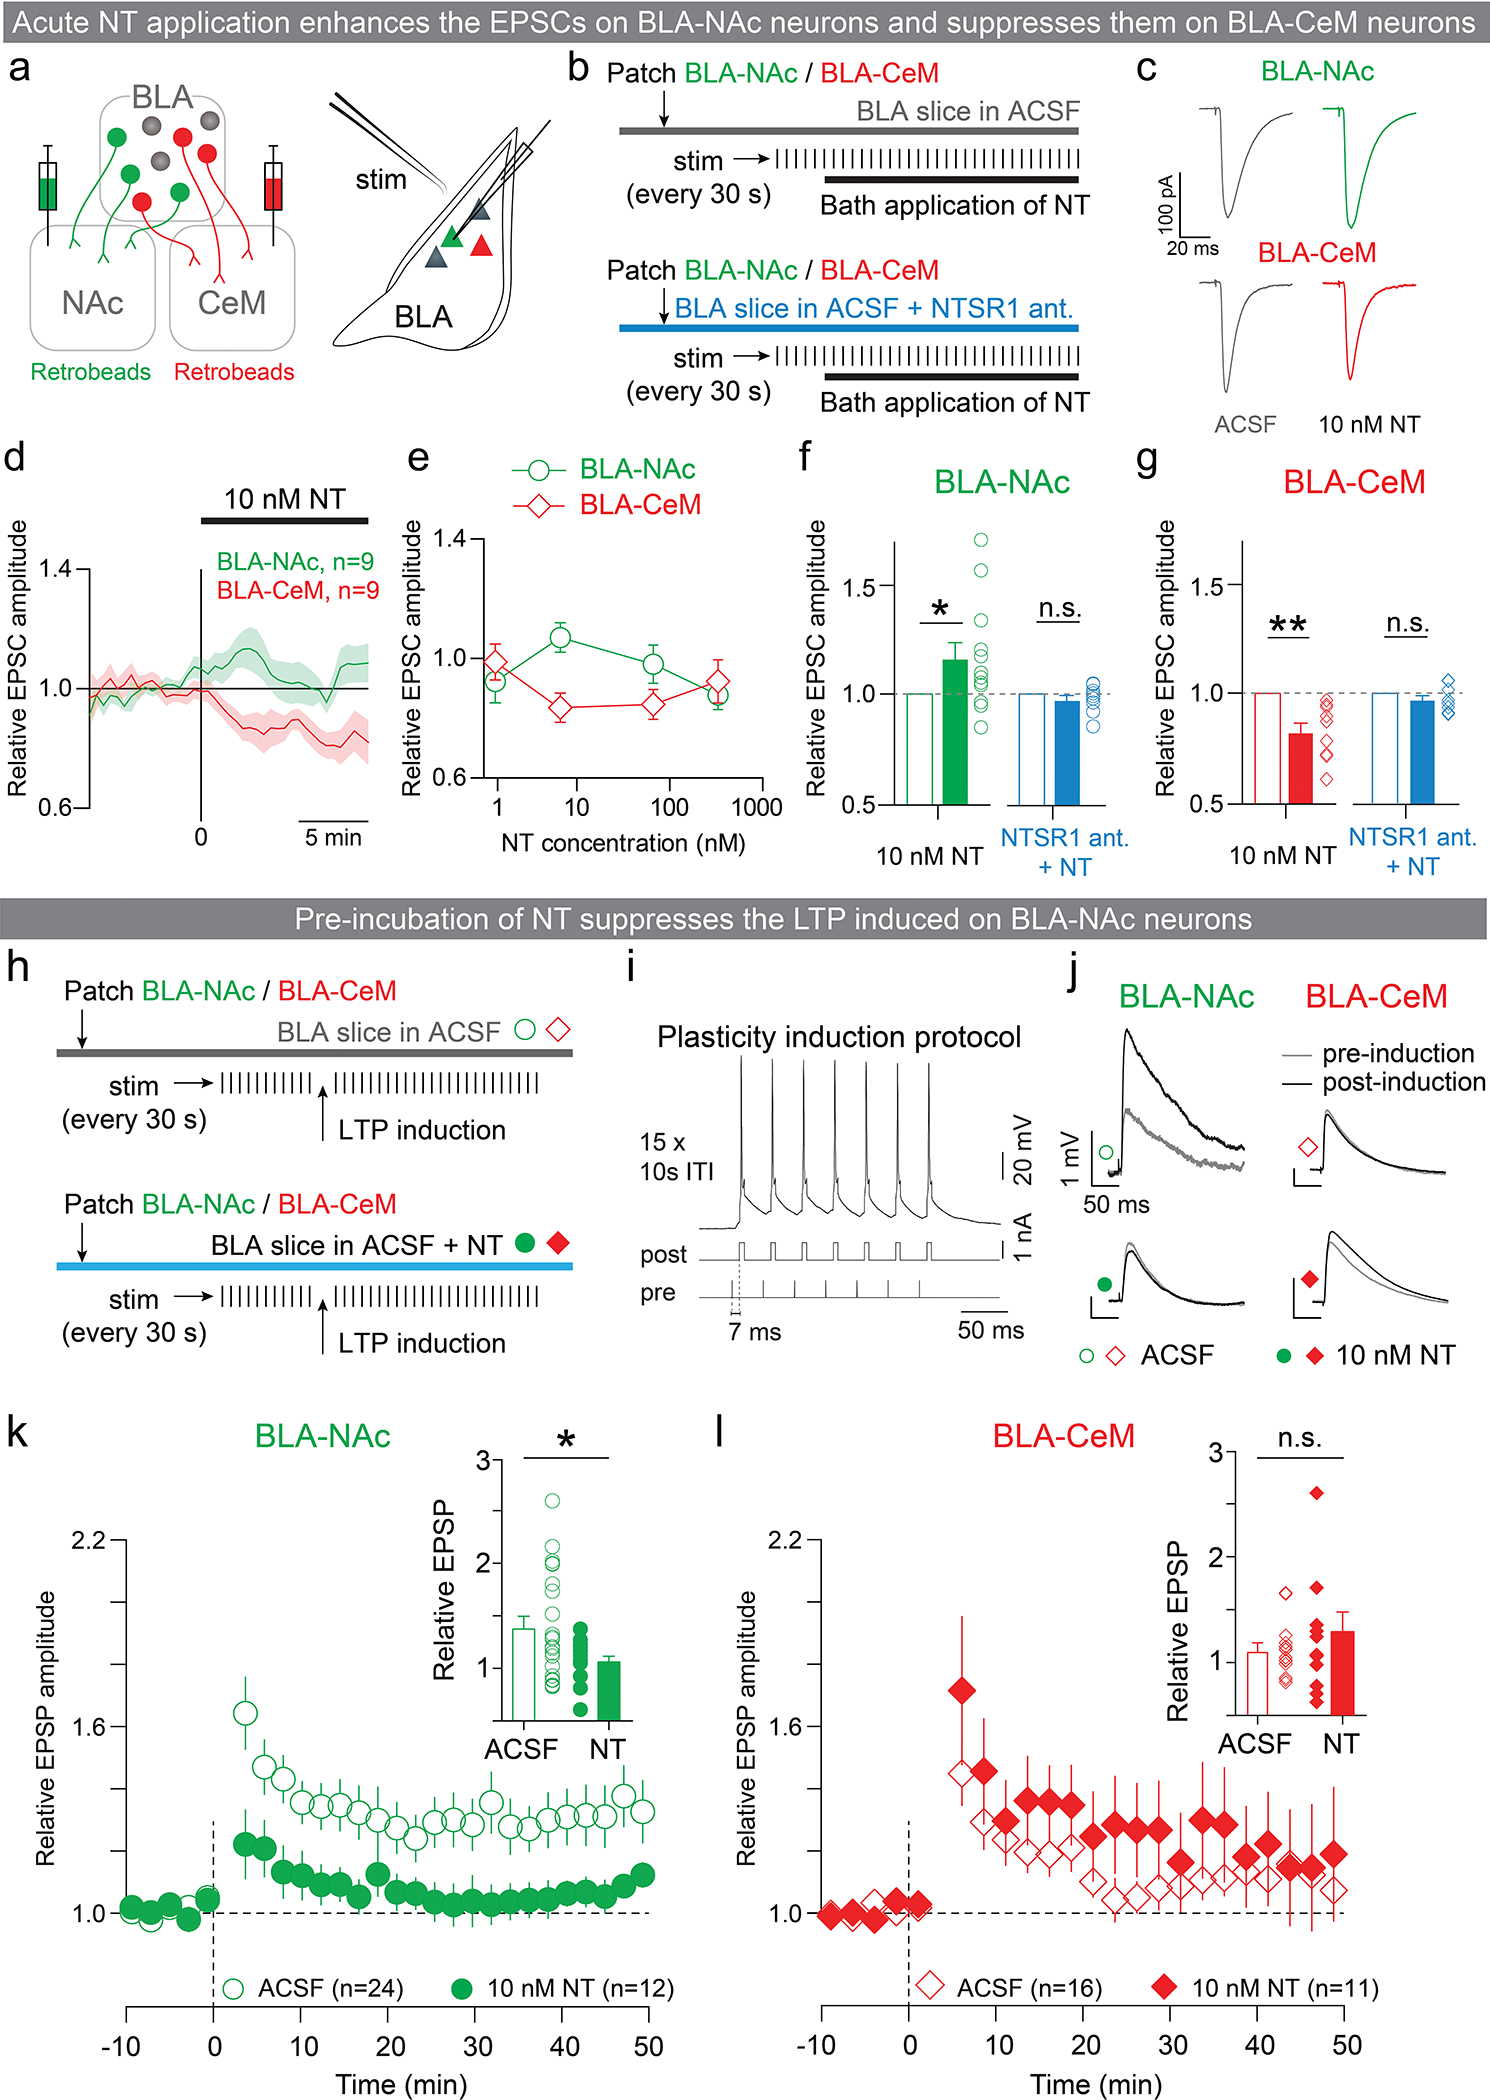
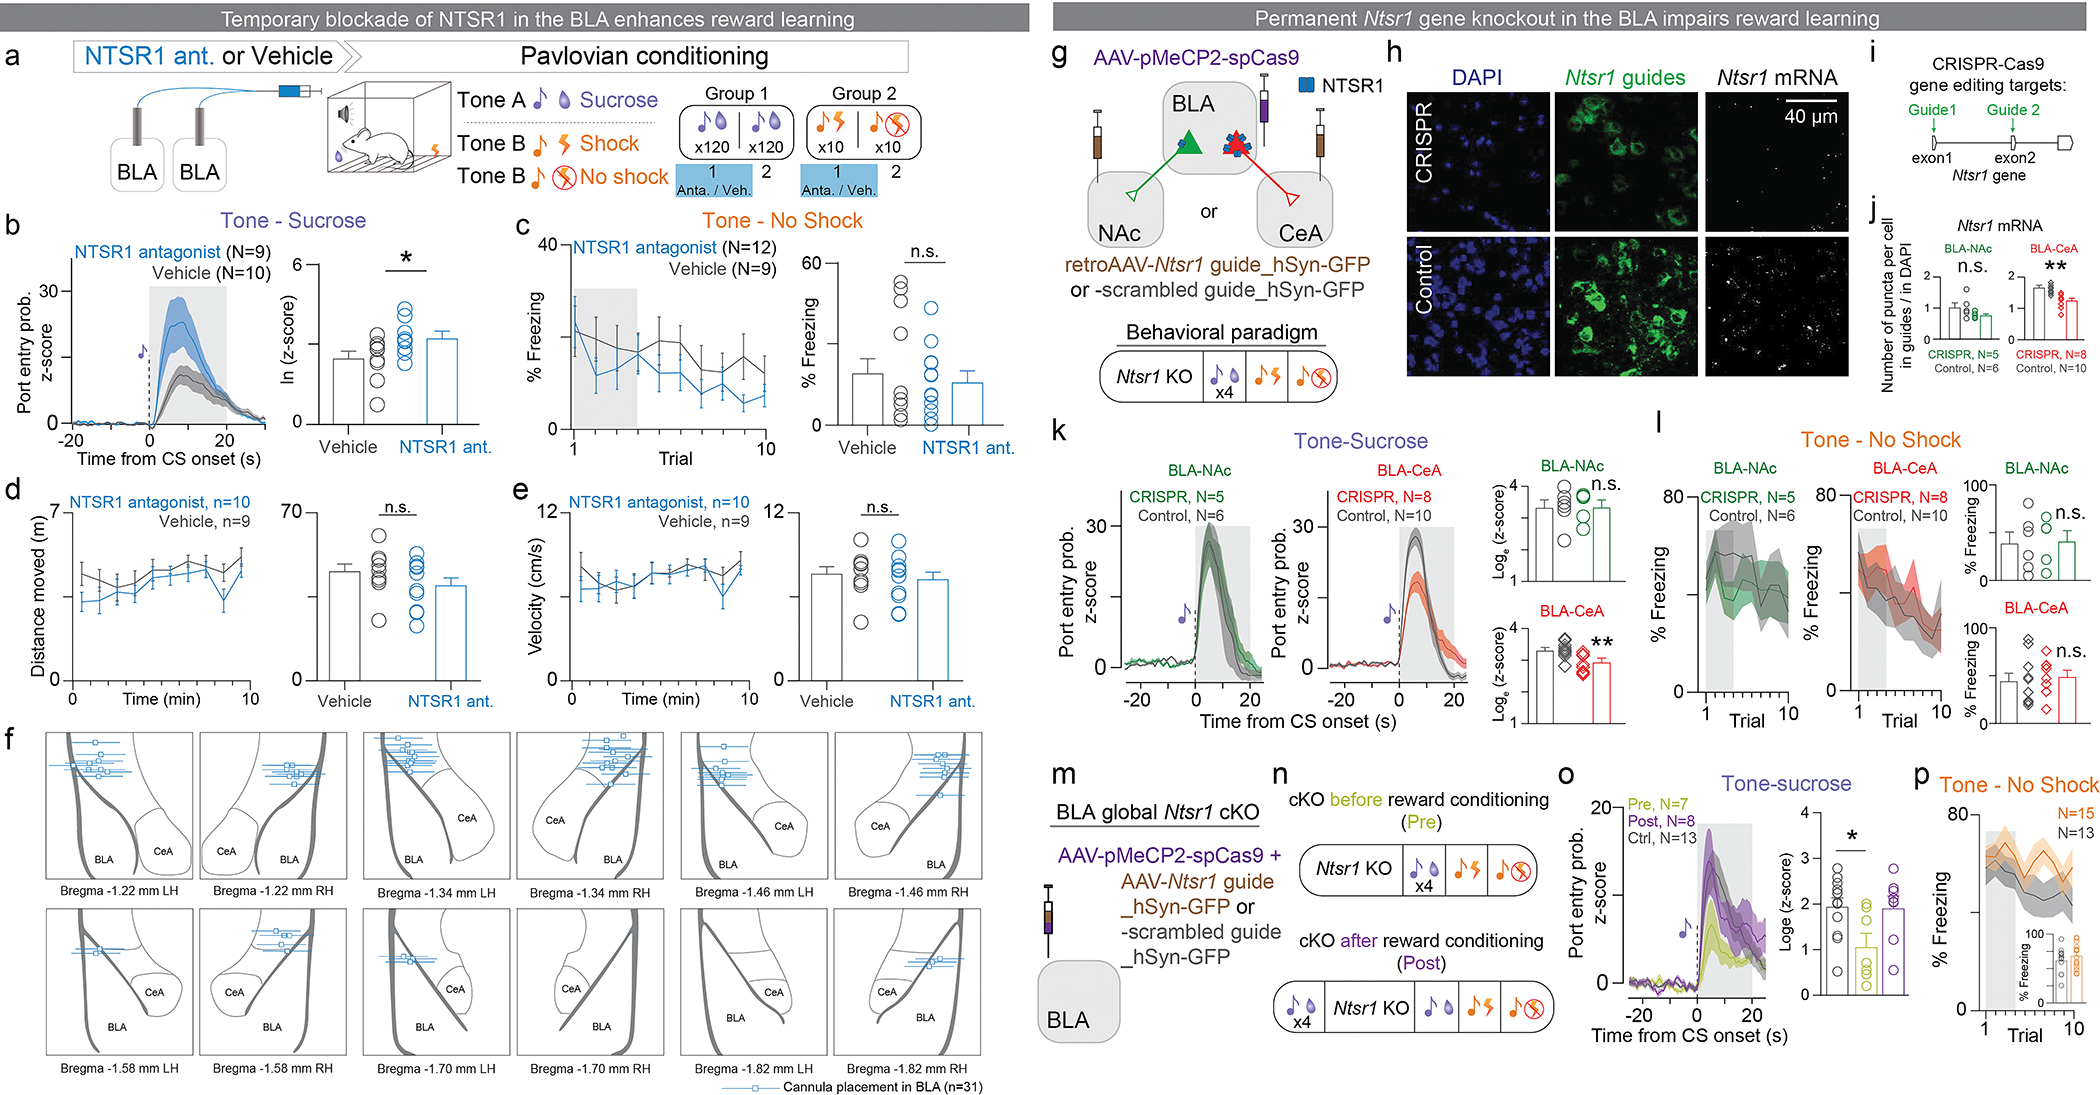
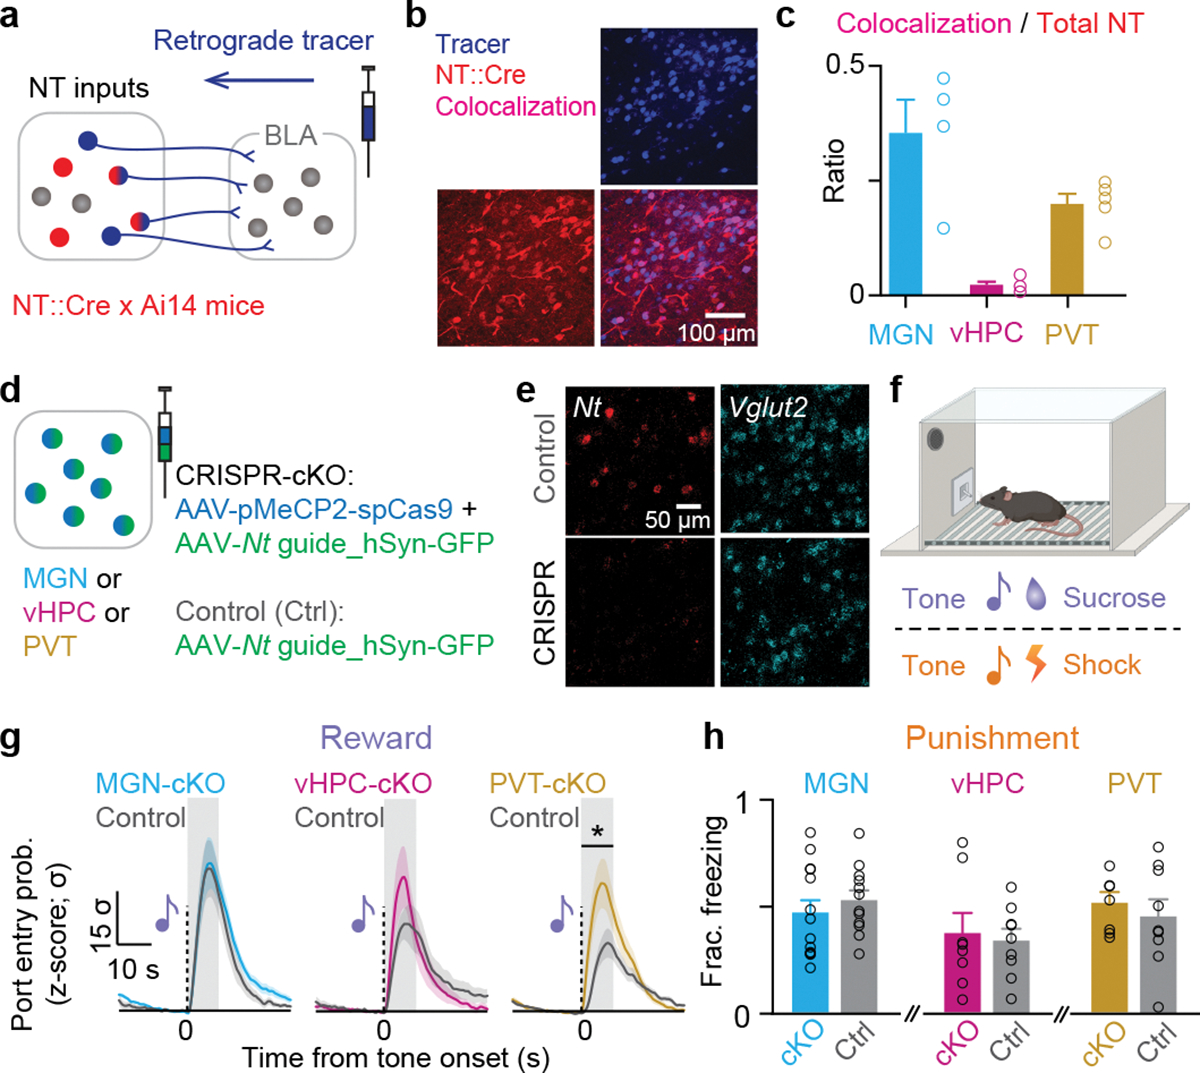
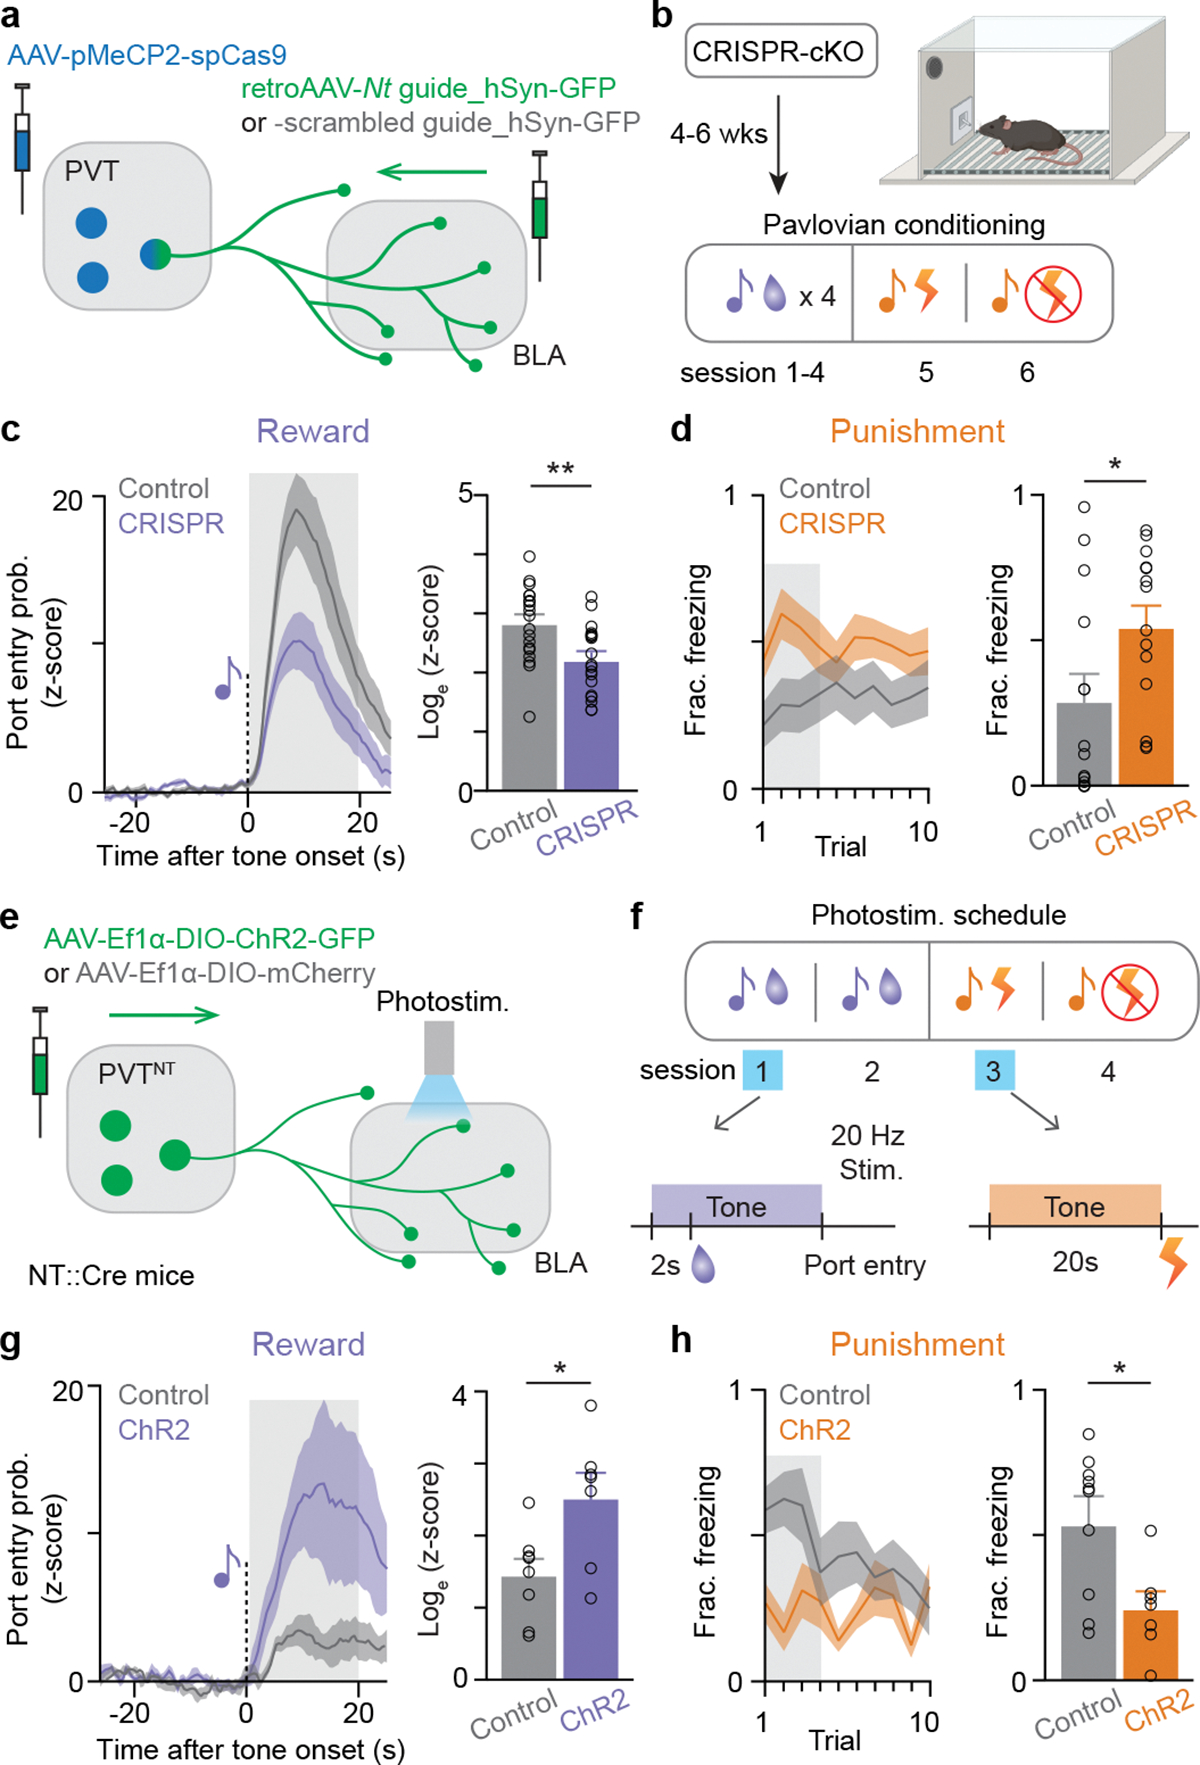
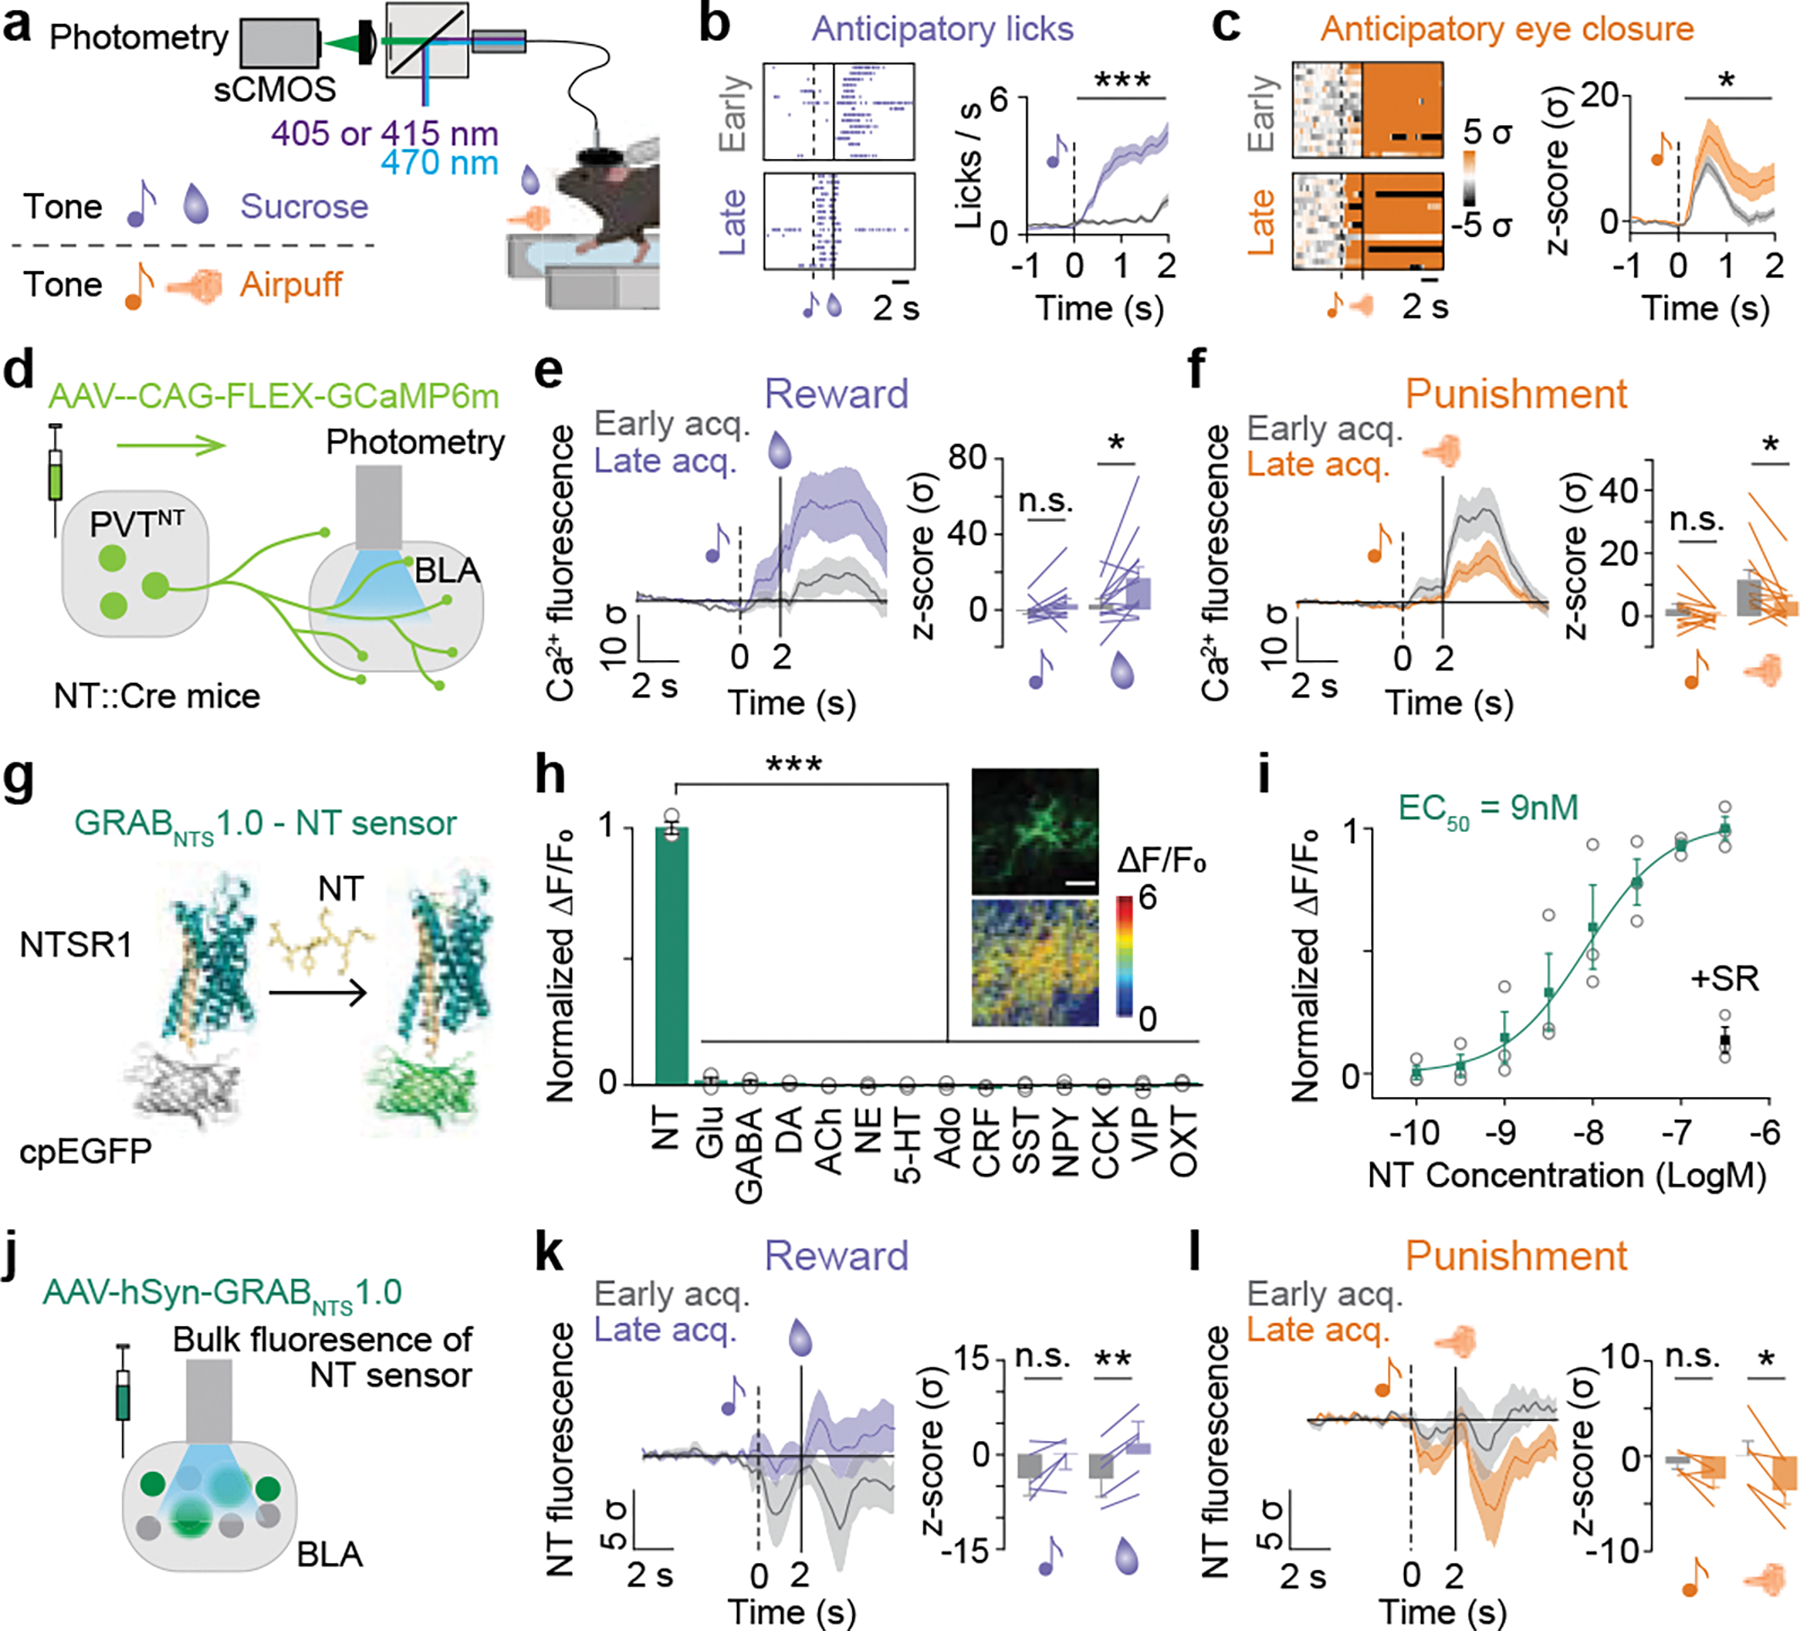
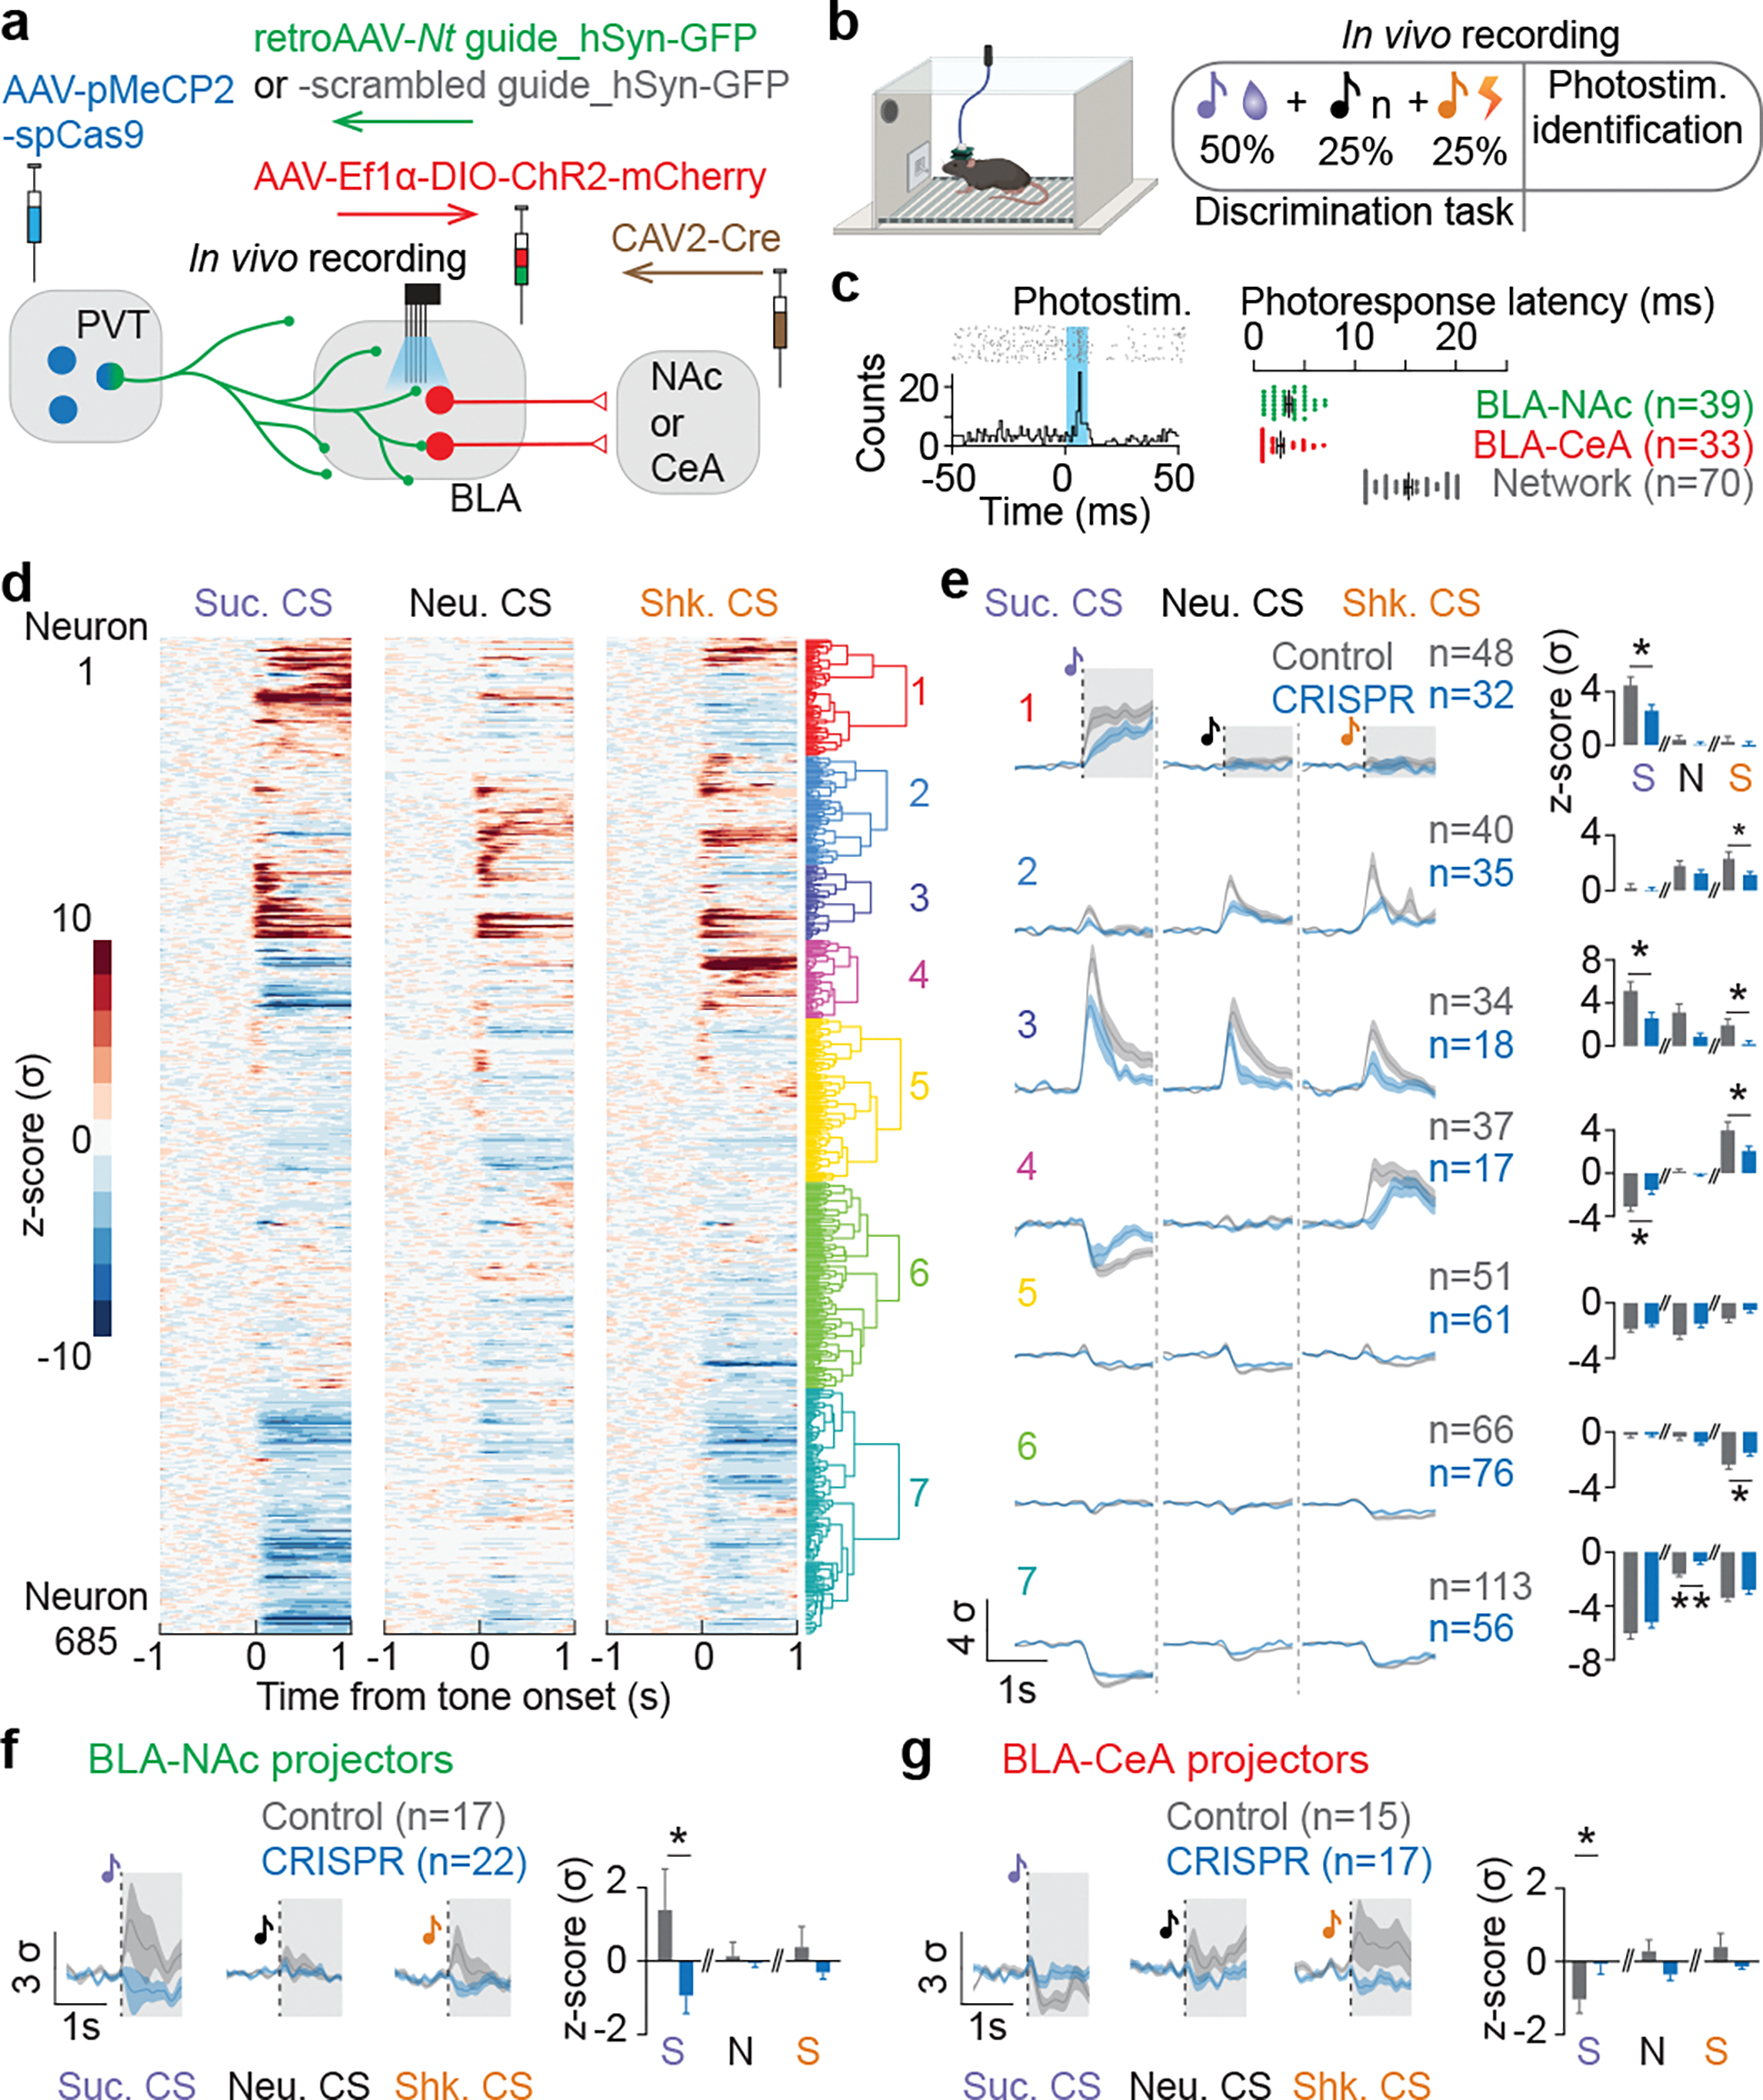
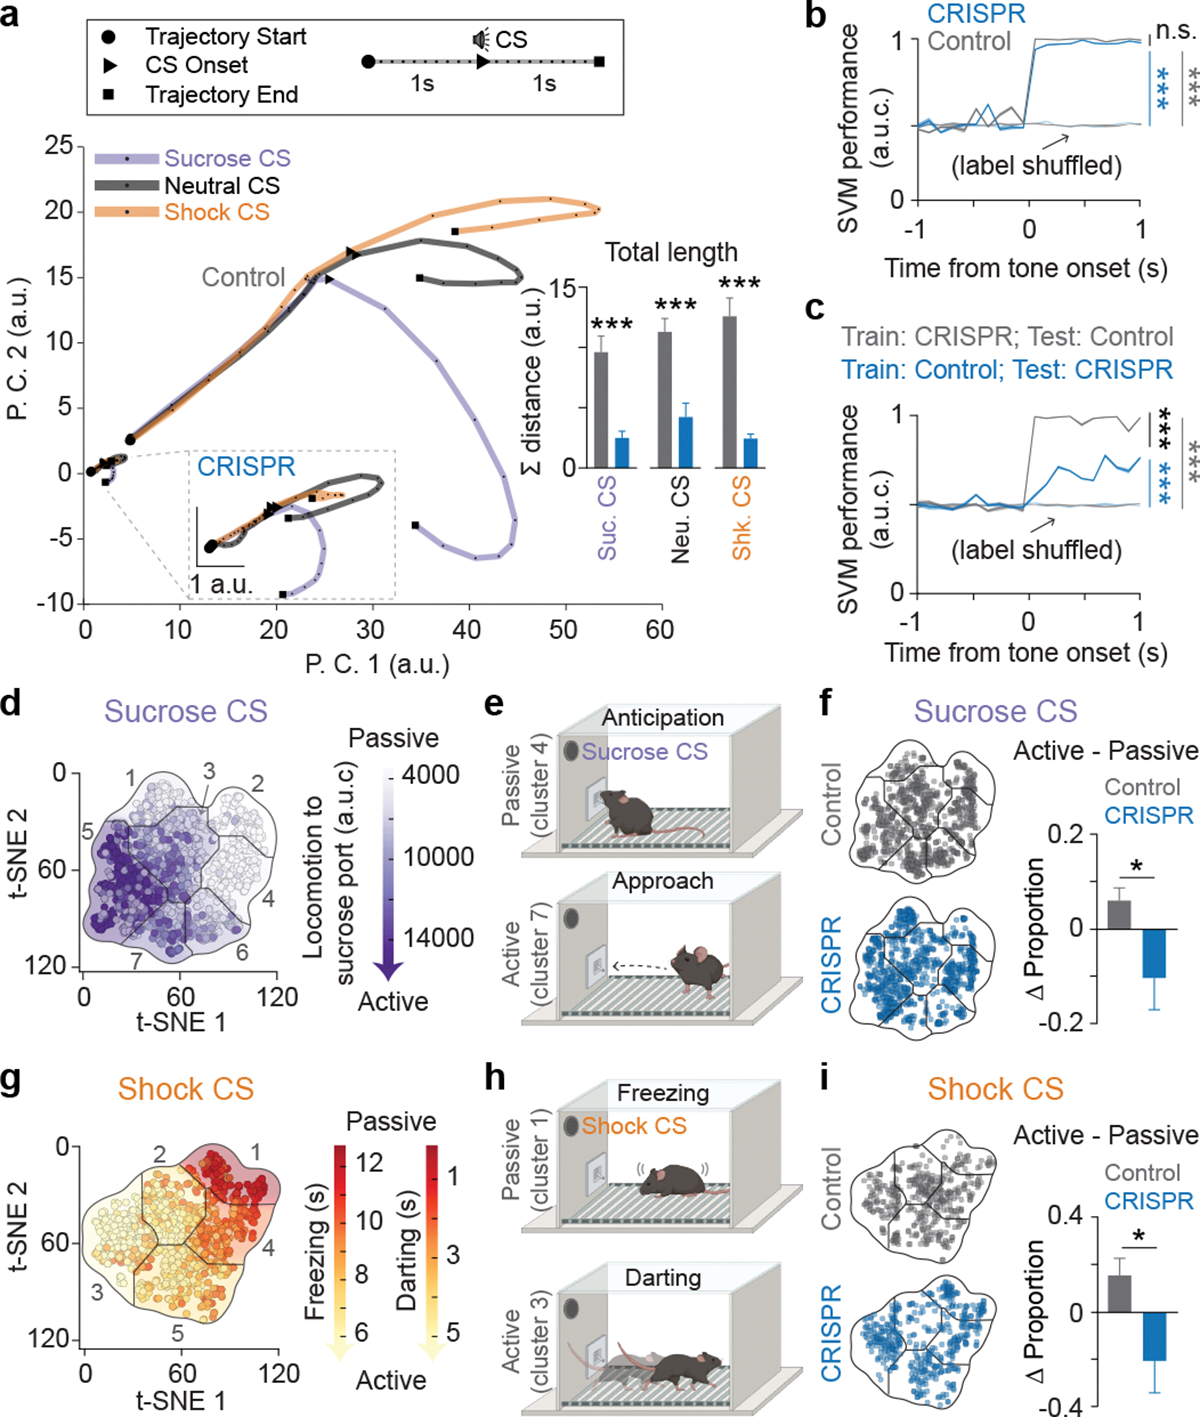
The ability to associate temporally segregated information and assign positive or negative valence to environmental cues is paramount for survival. Studies have shown that different projections from the basolateral amygdala (BLA) are potentiated following reward or punishment learning1-7. However, we do not yet understand how valence-specific information is routed to the BLA neurons with the appropriate downstream projections, nor do we understand how to reconcile the sub-second timescales of synaptic plasticity8-11 with the longer timescales separating the predictive cues from their outcomes. Here we demonstrate that neurotensin (NT)-expressing neurons in the paraventricular nucleus of the thalamus (PVT) projecting to the BLA (PVT-BLA:NT) mediate valence assignment by exerting NT concentration-dependent modulation in BLA during associative learning. We found that optogenetic activation of the PVT-BLA:NT projection promotes reward learning, whereas PVT-BLA projection-specific knockout of the NT gene (Nts) augments punishment learning. Using genetically encoded calcium and NT sensors, we further revealed that both calcium dynamics within the PVT-BLA:NT projection and NT concentrations in the BLA are enhanced after reward learning and reduced after punishment learning. Finally, we showed that CRISPR-mediated knockout of the Nts gene in the PVT-BLA pathway blunts BLA neural dynamics and attenuates the preference for active behavioural strategies to reward and punishment predictive cues. In sum, we have identified NT as a neuropeptide that signals valence in the BLA, and showed that NT is a critical neuromodulator that orchestrates positive and negative valence assignment in amygdala neurons by extending valence-specific plasticity to behaviourally relevant timescales.


Conflict of interest statement

COMPETING INTEREST STATEMENT

No competing Interests.

Figures

Extended Data Figure 1:
Extended Data Figure 1:. In situ hybridization of Ntsr1 and Ntsr2 mRNA, validation of the NT::Cre x Ai14 mouse line, identification of NT source to the BLA, and their terminal fields of NT axons in the BLA.
a-c: Ntsr1 mRNA was predominantly expressed in BLA-CeM neurons compared to BLA-NAc neurons. (a) Schematics of labeling BLA-NAc and BLA-CeM neurons with retrobeads. (b) Representative confocal images of retrobeads from the CeM (left panel), fluorescence in situ hybridization of Ntsr1 mRNA (middle panel) in the BLA, and the merged image (right panel). The white arrow indicates a retrobead-positive neuron that is colocalized with Ntsr1 mRNA staining. The dotted yellow line delineates a cell co-expressing retrobeads and Ntsr1 mRNA. (c) BLA-CeM neurons showed significant higher proportions of colocalization with Ntsr1 mRNA staining-positive neurons compared to the BLA-NAc neurons (Unpaired t-test, for coloc to tracer: t5=7.901, ***P=0.0005, effect size=0.2574 ± 0.0325, CI95=0.1737 to 0.3412, for coloc to Ntsr1, t5=6.383, **P=0.0014, effect size=0.4375 ± 0.06854, CI95=0.2613 to 0.6137). d-f: Ntsr2 mRNA is equally distributed among the BLA-NAc and the BLA-CeM neurons. (d) Representative images of injection sites of retrobeads in the CeM (left panel) and the NAc shell (right panel). (e) Pseudocolored confocal images of DAPI, retrobeads from the CeM, and RNAscope staining of Ntsr2 mRNA. The dotted yellow line delineates a cell co-expressing retrobeads and Ntsr2 mRNA. (f) The proportions of colocalized neurons (retrobeads and Ntsr2 mRNA puncta) do not show significant difference between the BLA-CeA and the BLA-NAc neurons (unpaired t-test, two-tailed, t5=0.3729, P=0.7245, effect size= −0.01523 ± 0.04803, CI95= −0.1202 to 0.08974). g: To confirm the tdTomato expressing neurons in the Ai14 reporter line when crossed with the NT::Cre line we used in-situ hybridization (RNAScope) to co-label Nt mRNA and tdTomato mRNA. We found a large amount of overlap between cells co-expressing Nt mRNA and tdTomato mRNA. Numbers in the Venn diagrams indicate the total number of cells counted in each category. h-i: MGN:NT, vHPC:NT and PVT:NT populations send axons to largely topographically segregated sub-regions of the BLA. (h) Pseudocolored confocal images showing cell bodies expressing fluorophores under the control of Cre in two of the three NT populations containing BLA projectors (left two columns), and their corresponding axon terminals in the BLA (right three columns). The anterior-posterior direction from bregma is indicated below (in mm). (i) Fluorescence from the PVT:NT, vHPC:NT and MGN:NT axon terminals was quantified in the following sub-divisions of the amygdala (as defined in the mouse brain atlas) – lateral amygdaloid nucleus, dorsolateral part (LaDL), lateral amygdaloid nucleus, ventrolateral part (LaVL), lateral amygdaloid nucleus, ventromedial part (LaVM), basolateral amygdaloid nucleus, anterior part (BLA), basolateral amygdaloid nucleus, posterior part (BLP), basolateral amygdaloid nucleus, ventral part (BLV), basomedial amygdaloid nucleus, anterior part (BMA), basomedial amygdaloid nucleus, posterior part (BMP). These regions are labeled across 6 coronal sections in (h). Each circle in (j) shows data from an image obtained from one coronal section from a single mouse. The size of the circle represents the anterior-posterior coordinate relative to bregma, and the mapping is shown in the legend at the bottom. N denotes number of mice in each group. Error bars and solid shaded regions around the mean indicate s.e.m.
Extended Data Figure 2:
Extended Data Figure 2:. MGN:NT, vHPC:NT and PVT:NT populations evokes both EPSCs and IPSCs in BLA neurons, but IPSCs are not monosynaptic.
a: Representative images of BLA neurons at lower (left) and higher (right) magnifications used to assay synaptic currents from axon terminals coming from the MGN, the vHPC or the PVT. b: Representative traces of excitatory and inhibitory post-synaptic currents (EPSCs and IPSCs) recorded from putative principal neurons in the BLA upon stimulating ChR2-expressing axon terminals from NT populations in the MGN (left), the vHPC (middle) and the PVT (right). c: The EPSCs had faster onset times than the IPSCs upon stimulation of NT population axon terminals from the MGN (Two-tailed paired t-test, t11=3.587, **P=0.0043), the vHPC (Two-tailed paired t-test, t4=3.730, *P=0.0203) and the PVT (Two-tailed paired t-test, t8=4.354, **P=0.0024). d: Light-evoked EPSCs were monosynaptic as they were still evoked upon stimulation of axon terminals from NT populations of all three regions after the application of TTX+4-AP. Monosynaptic EPSCs were significantly reduced by the application of glutamate blockers for AMPA and NMDA receptors, AP5 and NBQX respectively (One-way ANOVA with Holm-Sidak’s multiple comparisons test. The MGN: F(2, 27)=9.613, TTX+4-AP vs. ACSF: t27=1.209, P=0.2372, effect size=−31.28 ± 28.87; TTX+4-AP vs. AP5+NBQX: t27=3.19, **P=0.0072, effect size=89.95 ± 28.2; The PVT: F(2,39)=10.67, TTX+4-AP vs. ACSF: t39=2.786, **P=0.008, effect size=141.9 ± 50.93; TTX+4-AP vs. AP5+NBQX: t39=4.585, ***P<0.0001, effect size=233.5 ± 50.93; The vHPC: F(2, 26)=4.304; TTX+4-AP vs. ACSF: t26=2.013, P=0.0545, effect size=141.9 ± 70.48; TTX+4-AP vs. AP5+NBQX: t26=28.03, *P=0.0188, effect size=224 ± 79.91. e: IPSCs were abolished upon application of TTX+4-AP confirming that they are not monosynaptic. There was no detectable positive deflection in the current after application of TTX+4-AP from any cell. n denotes number of neurons in each group. Error bars around the mean indicate s.e.m.
Extended Data Figure 3:
Extended Data Figure 3:. Detection of insertion-deletion mutations introduced by the CRISPR-Cas9 system, and Nt mRNA depletion.
a-d: To compute the percentage of insertion-deletion (indel) mutations introduced into the Nt gene by the CRISPR-Cas9 system in vivo, we harvested tissue from viral-injection sites (AAV-Cas9 + AAV-Nt guide 1 or AAV-Cas9 + AAV-Nt guide 2 in the MGN), sorted the nuclei using fluorescence, extracted the genomic DNA, used PCR to amplify the parts of the DNA targeted by each guide and used next-generation sequencing (NGS) to sequence the DNA. For the control group, tissue was harvested from the same brain region, but from either the hemisphere contralateral to the viral injection, or the same brain region in an un-injected mouse. The percentage of indel mutations were quantified using the website outknocker.org (a, c). For the Guide 1 and Guide 2 groups in (a) and (c) respectively, only one tissue sample was derived from each injected mouse. For the control groups, the 4 and 5 samples in (a) and (c) were derived from 2 and 3 mice, respectively. There were significantly higher number of indel mutations in the Cas9+Guide 1 (a; unpaired t-test, two-tailed, t8=85.99, ***P<0.0001, effect size= 90.82 ± 1.056, CI95= 88.38 to 93.25) and Cas9+Guide 2 (c; unpaired t-test, two-tailed, t7=21.20, ***P<0.0001, effect size= 80.27 ± 3.787, CI95= 71.32 to 89.23) injected tissue, compared with mutations in the control tissue. (b,d)The percentage of reads from a representative mouse in each of the Guide 1-injected (b) and Guide 2-injected (d) groups are shown. N denotes number of tissue samples in each group. Error bars around the mean indicate s.e.m. e-f: Quantification of Nt mRNA and Vglut2 mRNA using fluorescence in-situ hybridization (RNAScope), where both guides were co-introduced into the brain. Data shown here are from separate sets of mice that received an AAV-Cas9 injection along with an injection of either AAV-Nt guide 1 (e) or AAV-Nt guide 2 (f). Using Cas9 in combination with guide 1 depleted Nt mRNA levels (e, left; paired t-test, t5=3.251, *P=0.0227, effect size= 0.1950, CI95= 0.04078 to 0.3492), while Vglut2 mRNA levels were not affected (e, right; paired t-test, t5=0.5491, P=0.6065, effect size=0.3050, CI95= −1.123 to 1.733). Using Cas9 in combination with guide 2 depleted Nt mRNA levels (f, left; paired t-test, t5=3.193, *P=0.0242, effect size= 0.4850, CI95= 0.09443 to 0.8756), while Vglut2 mRNA levels were not affected (f, right; paired t-test, t5=1.280, P=0.2568, effect size=0.5617, CI95= −0.5666 to 1.690). N denotes number of mice in each group. Error bars around the mean indicate s.e.m.
Extended Data Figure 4:
Extended Data Figure 4:. In vivo validation of CRISPR-Cas9 mediated Nt gene cKO.
a: The CRISPR-associated endonuclease Cas9 was used to generate indels in the Nt gene for depleting NT levels in specific NT populations. NT-specific single guide RNAs were designed to target exon 1 and 3 of the NT coding region. b: Experimental design to validate the efficacy of the CRISPR-Cas9 system in depleting Nt mRNA levels. Four weeks after steretotaxic injection of AAV9 viral vectors encoding Cas9 and both the guides into the right MGN, brains were extracted and mRNA levels of Nt and Vglut2 transcripts were assessed using fluorescence in-situ hybridization (ISH; RNAScope). c: Confocal images from a representative brain slice showing fluorescence from the nuclear stain DAPI, GFP in the Nt guides, ISH of Nt mRNA and Vglut2 mRNA from the control (top) and Cas9+guide injected hemispheres (bottom). d: Representative images showing overlap between the GFP-KASH and Cas9 mRNA expressing neurons. We used a multi-AAV viral system to deliver the different components of the CRISPR-Cas9 gene editing system (Cas9 and guides) to neurons in vivo. Since gene editing requires the Cas9 protein and one or more guides to be present in the same cell, we quantified the amount of overlap between cells expressing the Cas9 and the guide components. The images shown here are from a representative mouse. The bottom row is a magnified version of the area indicated by the solid white square in the top row. e: Quantification of penetrance of the AAV vectors carrying Cas9 and the guides. Both the Cas9 protein and guide RNAs targeting the Nt gene need to be present in a cell for the Cas9 protein to edit the Nt gene. f: Percentage of fluorescent pixels was used as a metric to quantify Nt and Vglut2 mRNA levels. Nt mRNA levels were significantly reduced in the Cas9+guide injected hemisphere, compared to the non-injected hemisphere (paired t-test, t5=3.315, *P=0.0211, effect size=0.4983, CI95= 0.1118 to 0.8849; left panel), while there was no detectable difference in the levels of Vglut2 mRNA between the two hemispheres (paired t-test, t5=1.442, P=0.2089, effect size=0.4283, CI95= −0.3355 to 1.192; right panel). N denotes number of mice in each group. Error bars around the mean indicate s.e.m.
Extended Data Figure 5:
Extended Data Figure 5:. Validations of the PVT-BLA projection-specific CRISPR-Cas9 mediated Nt gene cKO and supplementary data for PVT-BLA:NT photostimulation.
a-d: PVT-BLA:Nt CRISPR-cKO does not affect glutamate release onto BLA neurons. (a) Schematics of the experiment. (b-d) In mice with CRISPR-cKO of Nt in the PVT-BLA projection, glutamatergic transmission was still observed (5 cells recorded from 4 separate mice; Wilcoxon test, *P = 0.0156). e, f: PVT-BLA:Nt CRISPR-cKO in situ validation. (e) Representative confocal images of fluorescent in situ hybridization in the PVT of control and CRISPR mice. Dotted lines outline the guide positive cells. (f) Mice receiving Nt guides injections (CRISPR group) showed significantly reduced Nt mRNA levels in the guide-positive cells compared to mice receiving control guide injections, while Vglut2 mRNA levels were unaffected (Unpaired t-test, Nt mRNA: t28=2.788, **P=0.009, effect size=−1.257 ± 0.4508, CI95=−2.18 to −0.3335. Vglut2 mRNA: t12=0.724, P=0.483, effect size=0.1755 ± 0.2425, CI95=−0.3528 to 0.7039). The mRNA level was calculated as the ratio of average number of mRNA puncta in guide-positive neurons to DAPI-positive neurons. g: In the PVT-BLA:Nt CRISPR-cKO experiments, a subset of control and CRISPR mice were further tested with the open field test (OFT). There were no significant differences between the control and CRISPR groups in time spent in the center and distance traveled during open field test (unpaired t-test, two-tailed, OFT: t14=0.9669, P=0.35, effect size= 16.57 ± 17.14, CI95= −20.19 to 53.33, distance traveled: t14=1.048, P=0.3123, effect size= 446.1 ± 425.6, CI95= −466.7 to 1359). h: Diagrams of fiber placements for PVT-BLA:NT photostimulation experiments. Placements are indicated on outlines in the coronal plane, and the numbers below indicate the anterior-posterior distance from bregma. i: Photostimulation of the PVT-BLA:NT pathway does not affect time spent freezing in response to the shock-predictive CS during tone-shock acquisition (unpaired t-test, two-tailed, t13=0.6903, P=0.5022, effect size= 0.05650 ± 0.08184, CI95= −0.1203 to 0.2333). j, k: After mice were tested in sucrose and shock association tasks, they received a single session of the OFT, consisting of three 5-minute blocks in a laser OFF-ON-OFF manner. (j) Photostimulation of the PVT-BLA:NT pathway did not affect the amount of time mice spent in the center (paired t-test, two-tailed, mCherry group, t7=0.032, P=0.9753, effect size=0.3253 ± 10.14, CI95=−23.66 to 24.31; ChR2 group, t6=0.4472, P=0.6704, effect size=−5191 ± 11.61, CI95=−33.59 to 23.21). (k) The ChR2 group showed a significant reduction in distance traveled during the OFT when the laser was ON (Two-way ANOVA repeated measurement, stimulation OFF vs ON: F(2,26)=7.1, **P=0.0035, ChR2 vs. mCherry: F(1,13)=0.0786, P=0.786, and interaction: F(2,26)=4.769, *P=0.0172, Holm-Sidak’s multiple comparisons test, mCherry: 1st OFF vs. ON, P=0.4207, 2nd OFF vs. ON, P=0.9779, 1st OFF vs. 2nd OFF, P=0.4207; ChR2:1st OFF vs. ON, **P=0.0043, 2nd OFF vs. ON, ***P=0.0008, 1st OFF vs. 2nd ON, P=0.4335). n and N denote number of neurons and mice in each group, respectively. Error bars and solid shaded regions around the mean indicate s.e.m.
Extended Data Figure 6:
Extended Data Figure 6:. Multisite photometry recordings of NT populations in the MGN, the PVT, and the vHPC.
a: Experimental design for assaying neural activity from the MGN, the vHPC and the PVT:NT populations during reward and punishment associations. A virus expressing the genetically encoded calcium indicator GCaMP6m under the control of Cre was injected into the MGN, the vHPC and the PVT of NT::Cre mice. A sketch of the top-down view of the mouse skull depicting placement positions for viral injections and optic fibers is shown on the left. Upon viral incubation for at least 8 weeks, mice learned to associate a tone with sucrose reward over 5–7 sessions, and a different tone with airpuff over two sessions (right) in a head-fixed preparation while calcium activity from NT populations was being recorded using a multi-site photometry system depicted in the middle. b-c: Population averages of z-scored Ca2+ fluorescence responses during early and late acquisition of anticipatory lick behavior (b) or anticipatory eye blink behavior (c) from the NT populations in the MGN (left), the vHPC (middle) and the PVT (right). Insets compare area under the curve during early and late acquisition from the onset of the CS to the onset of the US (light gray shaded region) during tone-sucrose association (b; paired t-tests, two-tailed, t8=0.3214, P=0.7561, effect size= −0.7986 ± 2.484, CI95= −6.528 to 4.931 for MGN, t7=1.615, P=0.1504, effect size= −1.444 ± 0.894, CI95= −3.558 to 0.6703 for vHPC, t7=1.76, P=0.1218, effect size= −4.543 ± 2.581, CI95= −10.65 to 1.56 for PVT), or tone-airpuff association (c; paired t-tests, two-tailed, t8=0.2102, P=0.8388, effect size=0.7795 ± 3.709, CI95= −7.774 to 9.333 for MGN; t7=0.1973, P=0.8492, effect size= −0.1977 ± 1.002, CI95= −2.567 to 2.172 for vHPC; and t7=0.5676, P=0.588, effect size= 1.456 ± 2.564, CI95= −4.608 to 7.519 for PVT). d: Representation of fiber placements in all mice. Placements are indicated on outlines in the coronal plane, and the numbers below indicate distance from bregma. e-g: Mice were head-fixed and pressurized air (20 psi) was delivered through a tube directly onto their eye for 0.1 s. The video frames were synchronized to the behavior data using two infra-red (IR) light emitting diodes (LEDs), one to indicate the CS tone, and the other to indicate the open state of the solenoid valve gating the air delivery. (e) Regions of interest (ROI) were drawn around the CS and US LEDs, and the average pixel intensities in the ROI were thresholded to identify the CS and US onset frames. An ROI encompassing the eye of the mouse was drawn (pink), and each frame was smoothed using a Gaussian filter. (f) The average intensity of all the pixels within the eye ROI was used as a metric for the size of the eye. (g) To control for background changes in intensity, the reference ROI time course was regressed from the eye ROI time course. A post-Gaussian smoothed frame of the region around the eye (dotted line) is shown on the right. Distances were calibrated using the size of the right screw that holds the head bar. N denotes number of mice in each group. Solid shaded regions around the mean indicate s.e.m.
Extended Data Figure 7:
Extended Data Figure 7:. Validations of NT fluorescent sensor.
a: Illustrations of fiber placements for the PVT-BLA NT calcium photometry experiment. b-f: NT sensor validation in HEK cells. (b) Representative images of sensor expression (top) and response to 100 nM NT (bottom) of the GRABNTS1.0 sensor and EGFP-CAAX in HEK293T cells. (Scale, 20 μm). (c, d) Time courses (left) and group summary of peak response ΔF/F0 (right) of GRABNTS1.0 sensor and EGFP-CAAX towards 100 nM NT; SR: SR142948 NTSR1 antagonist; n = 101, 102 and 115 cells from 3 cultures for Saline, SR and GFP respectively. (Unpaired t-test with Welch’s correction was performed. Saline vs. SR: t101.2=34.18, ***P<0.0001, effect size= −2.550 ± 0.07461, CI95= −2.698 to −2.402. Saline vs. GFP: t102=34.56, ***P<0.0001, effect size= −2.583 ± 0.07474, CI95= −2.731 to −2.435.) (e) Representative traces showing the response to NT (top) and subsequent addition of SR (bottom). The traces were the average of 3 different regions of interest (ROIs) on the scanning line. Each trace was fitted with a single-exponential function to determine ton and toff, and their group summary. n = 20 and 21 cells from 4 cultures for ton and toff. (f) Excitation and emission spectra for the GRABNTS1.0 sensor in the absence and the presence of NT. g-j: NT sensor validation ex vivo on BLA slices. (g) After mice performed reward and punishment learning task, we sliced the BLA and recorded fluorescent responses to different concentrations of NT perfusions using fiber photometry by placing the fiber on the top of the BLA. (h) Illustrations and microphotographs of fiber placements and BLA slices. (i) Example traces of NT fluorescence in responses to single perfusions of ACSF, 10 nM NT, and 300 nM NT. (j) Normalized dose-response curve for GRABNTS1.0 in response to different concentration of NT perfusions (9 slices from 5 separate mice). k-l: Representative images and illustrations of fiber placements for the NT sensor photometry experiment. n and N denote number of neurons or slices and mice in each group, respectively. Error bars and shaded regions around the mean indicate s.e.m.
Extended Data Figure 8:
Extended Data Figure 8:. supplementary analysis for in vivo electrophysiology.
a-c: (a) A representative confocal image of a recording site in the BLA. (b) A summary of recording sites in the BLA from all mice. (c) A raster plot and histogram of a representative BLA neuron in response to sucrose-predictive cues. d: Both non-tagged BLA neurons and the BLA-CeA neurons showed significantly lower basal firing rates (in Hz) in the CRISPR group compared to the control group (Two-tailed unpaired t-test, non-projectors: **P=0.0018; BLA-NAc: P=0.6436; BLA-CeA: *P=0.021). e: The CRISPR group showed significantly reduced port entry probability in sucrose trials, while enhanced freezing to CS during shock trials (Two-tailed unpaired t-test, sucrose trials: raw probability baseline, *P=0.012; raw probability 10–25s post sucrose, ***P=0.0006, shock trials: raw probability, P=0.8894, z-score, *P=0.0178). f, g: CRISPR mice showed overall reduced proportions, but not responsive amplitudes of excited and inhibited neurons to all three cues relative to the control group. Numbers in f indicate the total number of neurons that were excited and inhibited included in g. h: Functional clustering plotted separately for neurons in the control and CRISPR groups. i: Differences in proportions in neurons clustered in each functional cluster between the control and CRISPR groups. The proportion of BLA-NAc neurons in cluster 1 and 3 which preferentially encode positive valence was less in the CRISPR group compared to the control group. The proportion of BLA-CeA neurons in clusters 2 and 4 which preferentially encode negative valence was less in the CRISPR group compared to the control group. j: The positive valence encoding pattern observed in BLA-NAc neurons was abolished in the CRISPR group. The negative valence encoding pattern observed in BLA-CeA neurons was abolished in the CRISPR group (Two-tailed unpaired t-test, BLA-NAc: *P=0.0483; BLA-CeA: *P=0.0199). k-s: Unsupervised clustering of behavioral states. (k) First-order features were extracted from pose coordinates obtained from the videos. For each of these features, second-order features were extracted which were decomposed using PCA. Following PCA, t-distributed stochastic neighbor embedding (t-SNE) was performed on the top 30 principal components. A probability density function was computed over the 2-D t-SNE output and finally a watershed algorithm was used to form clusters. Each point in the t-SNE output plot represents a single trial. (l, p) Images depict the probability density function (PDF) estimate computed separately on t-SNE output for sucrose and shock trials, respectively. (m, q) The average latency to port in each sucrose trial cluster (m; One-way ANOVA, F6=20.924, ***P<0.0001), and the average time spent freezing to CS (q, left) and average darting time (q, right) in each shock trial cluster (One-way ANOVA, freezing: F4=212.917, ***P<0.0001, darting: F4=150.806, ***P<0.0001). (n, r) Kernel density of changes of difference in distance to port in sucrose trials (n), and kernel density of time spent freezing (r, left panel) and time spent darting (r, right panel) in shock trials. (o, s) Control and CRISPR group showed vastly different neural responses to both sucrose and shock CSs in passive and active trials. In responses to sucrose CS, non-phototagged BLA neurons in the CRISRP group showed significantly smaller response in active trials, while the BLA-NAc neurons showed bigger response in passive trials and smaller response in active trials compared to the control group. In response to shock CS, non-phototagged BLA neurons in the CRISRP group also showed significantly smaller response in active trials, while the BLA-NAc neurons showed smaller response in active trials and the BLA-CeA neurons showed smaller response during passive trials compared to the control group (Two-way ANOVA with Holm-Sidak’s multiple comparisons test. Sucrose CS: non-phototagged: P=0.4523 for passive, *P=0.0462 for active, BLA-NAc: *P=0.0334 for both passive and active, BLA-CeA: P=0.2969 for passive, P=0.5054 for active. Shock CS: non-phototagged: P=0.1716 for passive, *P=0.0495 for active, BLA-NAc: P=0.1145 for passive, *P=0.0354 for active, BLA-CeA: *P=0.0458 for passive, P=0.8467 for active). See Methods for detailed statistical values. n and N denote number of neurons and mice in each group, respectively. Error bars and shaded regions around the mean indicate s.e.m.
Extended Data Figure 9:
Extended Data Figure 9:. Acute and pre-incubation of NT applications produce distinct synaptic effects on BLA neurons.
a-g: Phasic NT application enhanced EPSCs on BLA-NAc neurons and suppressed it on BLA-CeM neurons. (a) Experimental design for recording from BLA-NAc or BLA-CeM neurons ex vivo. About two weeks after injecting retrobeads into the NAc and CeM, BLA-NAc or BLA-CeM neurons were targeted in acute slices using fluorescence from the retrobeads. EPSCs evoked by internal capsule stimulation were assayed from these neurons. (b) EPSCs were assayed every 30 s during voltage clamp recordings. Once the EPSC amplitude stabilized, NT was applied to the bath. EPSC modulation of NT was assessed by the ratio of amplitudes of EPSCs after and before the bath application of NT. (c) Average EPSCs from representative BLA-NAc and BLA-CeM neurons before (gray; left column) and after (right column) the bath application of NT. (d) Average relative EPSC amplitude time course for BLA-NAc and BLA-CeM populations for a concentration of 10 nM NT in the bath. (e) Relative EPSC amplitudes of BLA-NAc and BLA-CeM neurons for different concentrations of NT (2, 10, 100 and 500 nM). (f-g) At a concentration of 10 nM, NT significantly enhanced EPSCs in BLA-NAc neurons and suppressed EPSCs in BLA-CeM neurons (Wilcoxon signed-rank test, NT: **P=0.0039, W=−45, n=9, sum of positive and negative ranks=0 and −45. NTSR1: P=0.0781, W=−26, n=8, sum of positive and negative ranks=5 and −31). Differential EPSC modulation by NT was abolished when the slices were bathed in NTSR1 antagonist (Wilcoxon signed-rank test, NT: *P=0.0425, W=52, n=12, sum of positive and negative ranks=65 and −13; NTSR1: P=0.4961, W=−13, n=9, sum of positive and negative ranks=16 and −29). h-l: Pre-incubation of NT suppressed LTP induced on BLA-NAc neurons. (h) Schematics of LTP induction protocol. (i) Spike timing dependent plasticity induction protocol: each pulse in a 10 pulse, 30 Hz stimulus train delivered through a bipolar stimulating electrode to the internal capsule was followed after 7 ms by a 5 ms, 1 nA current pulse delivered directly to the recorded cell in the BLA through the recording electrode. This protocol was repeated 15 times with a 10 second inter-trial interval, and reliably induced spiking in recorded neurons. (j) EPSP traces from representative BLA-NAc and BLA-CeM neurons before (gray traces) and after (black traces) LTP induction. (k-l) STDP-induced LTP in the presence of NT (10 nM) 10–50 minutes after induction was reduced in BLA-NAc neurons, but unchanged in BLA-CeM neurons compared with the ACSF control (unpaired t-test, k, Unpaired t-test, t31=2.177, *P=0.0367, effect size=−0.3355 ± 0.1541, CI95=−0.649 to −0.022. l, Unpaired t-test, t25=1.193, P=0.2442, effect size=0.1795 ± 0.1505, CI95=−0.1305 to 0.4896). n denotes number of neurons in each group. Error bars and shaded regions around the mean indicate s.e.m.
Extended Data Figure 10:
Extended Data Figure 10:. Temporal and permanent blockades of NTSR1 signal in the BLA produces the different behavioral effects.
a-f: Temporal inhibition of NTSR1 in the BLA enhanced tone-sucrose association. (a) Experimental design to test the role of NTSR1 in the BLA during reward and punishment learning. Mice received a bilateral intracranial injection locally into the BLA of either NTSR1 antagonist (SR48692) or vehicle 15–20 minutes before the first session of Pavlovian sucrose or shock conditioning. Mice were reward conditioned by pairing a tone with a sucrose reward 120 times per session over two sessions, and punishment conditioned by pairing a different tone with a footshock 10 times in one session. (b) Normalized population average for the entire 120 pairings of session 2 (Shaded region indicates the time window when the peak was selected; Unpaired t-test, t16=2.128, *P=0.049, effect size = 0.7431 ± 0.3491, CI95=0.0029 to 1.483). (c) Population data quantifying percentage of freezing during the tone (Unpaired t-test, t19=1.061, P=0.3021, effect size=7.785 ± 7.339, CI95=−7.577 to 23.15). (d) Distance moved in a 10-minute OFT by mice receiving NTSR1 antagonist or vehicle bilaterally into the BLA (left). Total distance travelled in 10 minutes did not differ between mice treated with intra-BLA NTSR1 antagonist or vehicle (right; unpaired t-test, two-tailed, t17=1.212, P=0.2420, effect size= 5.569 ± 4.594, CI95= −4.124 to 15.26). (e) Velocity in the open field (left). The average rate of movement in the OFT did not differ between mice treated with intra-BLA NTSR1 antagonist vs. vehicle (right; unpaired t-test, two-tailed, t17=0.5012, P=0.6227, effect size= 0.3852 ± 0.7686, CI95= −1.237 to 2.007). (f) Placement of bilateral cannula tips above the BLA for delivery of NTSR1 antagonist in mice tested in sucrose and shock learning paradigms. g-p: Permanent Ntsr1 gene CRISPR-cKO in the BLA impaired tone-sucrose association. (g) Schematic of viral injections. Retrograde AAV encoding Ntsr1 guide RNAs or the negative control guide were injected bilaterally in the NAc or the CeA and AAV5 or AAV9 encoding Cas9 was injected bilaterally in the BLA. (h) Representative confocal images of DAPI, Ntsr1 guide positive cells, and NRSR1 mRNA in situ hybridization. (i) Ntsr1 guide RNAs were designed to target exon1 and exon2 of the Ntsr1 gene. (j) Ntsr1 mRNA levels in BLA-CeA neurons is significantly reduced in the CRISPR group compared to the control group (Unpaired t-test, two-tailed, t16=4.503, ***P=0.0004, effect size= −0.3844 ± 0.0853, CI95= −0.5654 to −0.2035). There is no difference in Ntsr1 mRNA levels in BLA-NAc neurons, possibly due to the small amount of basal Ntsr1 signal in BLA-NAc neurons (Unpaired t-test, two-tailed, t9=1.629, P=0.1377, effect size= −0.2457 ± 0.1508, CI95= −0.5869 to 0.00945). mRNA levels were calculated as the ratio of the average number of mRNA puncta in guide-positive neurons to DAPI-positive neurons. (k) Ntsr1 CRISPR cKO in BLA-CeA neurons, but not in BLA-NAc neurons reduced port entry probability in response to sucrose-predictive cues (Unpaired t-test, two-tailed, BLA-CeA, t16=3.577, **P=0.0025, effect size= −0.4462 ± 0.1248, CI95= −0.7107 to −0.1818, BLA-NAc, t9=0.03604, P=0.972, effect size= 0.01156 ± 0.3208, CI95= −0.7141 to 0.7373). (l) Ntsr1 cKO in either BLA-CeA or BLA-NAc neurons affected tone-shock recall test (Unpaired t-test, two-tailed, BLA-NAc, t9=0.1234, P= 0.9045, effect size= 0.02031 ± 0.1646, CI95= −0.3520 to 0.3927; BLA-CeA, t16=0.4075, P=0.689, effect size= 0.04435 ± 0.1088, CI95= −0.1864 to 0.2751). (m) Schematic of viral injections of global BLA Ntsr1 CRISPR-cKO. (n) The BLA global Ntsr1 CRISPR-cKO was performed before or after the acquisition of tone-sucrose association in separate groups. (o) The BLA global Ntsr1 CRISPR-cKO prior to the acquisition impaired subsequent tone-sucrose association, while the CRISPR-cKO post the acquisition did not affect the memory recall (One-way ANOVA, F(2,25)= 4.324, *P= 0.024. Holm-Sidak’s multiple comparisons test, Control vs. Pre: *P= 0.019; Control vs. Post: P= 0.99). (q) The CRISPR-cKO globally in BLA neurons did not affect tone-shock association (Unpaired t-test, two-tailed, t26=0.871, P=0.3917, effect size= 0.05526 ± 0.06345, CI95= −0.07516 to 0.1857). N denotes number of mice in each group. Error bars and solid shaded regions around the mean indicate s.e.m.
Figure 1:
Figure 1:. Identification of functional NT sources to the BLA in associative learning.
(a) Schematic of viral injection. (b) Representative confocal image showing the overlap of fluorescence from the retrograde tracer depicting BLA projectors and the fluorophore tdTomato depicting NT populations. (c) Quantification of overlap between NT expressing and BLA projecting neurons as a fraction of the NT population. (d) Schematic of viral-mediated CRISPR-Cas9 Nt gene knockout in each NT source. (e) Confocal images from a representative brain slice showing fluorescence from in situ hybridization of Nt mRNA and Vglut2 mRNA from the control and experimental groups. (f) Experimental design to test the acquisition of reward and punishment learning upon depletion of Nt gene. (g) Mice with PVT:Nt CRISPR-cKO showed a significantly higher port entry probability in last session of tone-sucrose conditioning, while MGN:Nt and vHPC:Nt CRISPR-cKO did not show significant changes compared to their cage-mate controls (P=0.9195, P=0.3976, and *P=0.0148, respectively for MGN, vHPC, and PVT. For CRISPR and control, N=18 and 17, N=11 and 9, and N=15 and 13, respectively for MGN, vHPC, and PVT). (h) CRISPR-cKO in none of the regions affected tone-shock acquisition in second session of tone-shock conditioning (P=0.4122, P=0.7818, and P=0.5751, respectively for MGN, vHPC, and PVT. For CRISPR and control, N=14 and 12, N=8 and 9, and N=8 and 9, respectively for MGN, vHPC, and PVT). Two-tailed unpaired t-test was used for all statistical tests. N denote number of mice in each group. Error bars and solid shaded regions around the mean indicate s.e.m. Shaded regions in panel g indicate the analysis windows used for statistical tests.
Figure 2:
Figure 2:. Causal manipulations show PVT-BLA:NT bidirectionally modulate both reward and punishment learning.
(a) Schematics of viral injection for CRISPR-mediated Nt gene cKO in the PVT-BLA projection. (b) Behavioral procedure of reward and punishment learning. Following the tone-shock conditioning session, an additional session of tone-shock testing was added in the next day, in which shocks were omitted. (c) The CRISPR group showed significantly reduced port entry probability in response to the sucrose-predictive CS (**P=0.0052, N=17 and 19 for CRISPR and control, respectively). (d) The CRISPR group also showed significantly higher proportion of time spent freezing during the duration of shock-predictive CS in the tone-shock testing session (*P=0.0396, N=14 and 14 for CRISPR and control, respectively). (e) Schematics of viral injection for optogenetic activation of PVT:NT terminals in the BLA. (f) Photostimulation protocol took place during the presentation of the tones at the first day of tone-sucrose and tone-shock association. (g) The ChR2 group showed significantly enhanced port entry probability in response to sucrose-predictive CS (*P=0.018, N=7 and 8 for ChR2 and control, respectively). (h) The ChR2 group showed significantly reduced freezing in the tone-shock testing session during the presentation of shock-predictive CS compared to the control group (*P=0.0279, N=7 and 8 for CRISPR and control, respectively). Two-tailed unpaired t-test was used for all statistical tests. Shaded regions indicate the analysis windows used for the sub-panels in c, d, g, and h. N denotes number of mice in each group, respectively. Error bars and solid shaded regions around the mean indicate s.e.m.
Figure 3:
Figure 3:. Genetically-encoded fluorescent sensors reveal enhanced and suppressed NT dynamics in the BLA after reward and punishment learning, respectively.
(a) Schematics of fiber photometry recording and behavioral paradigm of head-fixed associative learning. (b) Representative plots of licks (Left) and averaged anticipatory licks to the sucrose tone for the first 16 trials of first and last tone-sucrose sessions (Right; Two-tailed paired t-test; ***P<0.0001, N=13). (c) Representative plots of normalized eye closure index (Left) and averaged anticipatory eye closure to the airpuff tone for the first 16 trials of first and last tone-airpuff conditioning sessions (Right; Two-tailed paired t-test; *P=0.03, N=12). (d) Schematic of viral injection of a genetically-encoded calcium indicator and fiber implantation. (e) Calcium responses of the PVT-BLA:NT axon terminals to sucrose were significantly enhanced by reward conditioning (Two-tailed paired t-test, CS: P=0.1663; US: *P=0.0125; N=13). (f) Responses to airpuff were significantly suppressed by punishment conditioning. (Two-tailed paired t-test, CS: P=0.169; US: *P=0.0145; N=12). (g) Schematic drawing of the GRABNTS1.0 sensor. The third intracellular loop of the human NTSR1 was replaced with cpEGFP, thus the binding of neurotensin induces a conformational change that increases the intensity of cpEGFP fluorescence. (h) Normalized ΔF/F0 in sensor-expressing neurons following the application of NT alone, glutamate (Glu), gamma-aminobutyric acid (GABA), dopamine (DA), acetylcholine (ACh), norepinephrine (NE), serotonin (5-HT), adenosine (Ado), corticotrophin releasing factor (CRF), somatostatin (SST), neuropeptide Y (NPY), cholecystokinin (CCK), vasoactive intestinal peptide (VIP) and oxytocin (OXT; One-way ANOVA with Dunnett’s multiple comparisons test; ***P<0.0001). Inset: representative images of sensor expression (top) and responses to 100 nM NT (down) in cultured neurons. Scale bar represents to 100 μm. (i) Normalized dose-response curve for GRABNTS1.0 expressing neurons in response to NT, and the black dot indicates subsequent addition of 1 μM NTSR1 (+SR) antagonist at the 300 nM NT condition. (j) Schematic of viral injection of a genetically-encoded NT sensor and fiber implantation. (k) BLA NT sensor response to sucrose was enhanced by reward conditioning (Two-tailed paired t-test, CS: P=0.1483; US: **P=0.001; N=5). (l) BLA NT sensor response to airpuff was reduced by punishment conditioning (Two-tailed paired t-test, CS: P=0.0994; US: *P=0.0162; N=5). Analysis windows for the CSs and the USs were 0–2s and 2–7s from CS onsets, respectively. N denotes number of mice in each group. Error bars and solid shaded regions around the mean indicate s.e.m.
Figure 4:
Figure 4:. The CRISPR-cKO of Nt gene in the PVT to BLA projection attenuates BLA responses to learned valences.
(a) Schematics of in vivo electrophysiological recordings in the BLA with BLA-NAc or BLA-CeA phototagging in mice with or without Nt gene inactivation in BLA-projecting PVT neurons. (b) Behavioral paradigm of in vivo recordings during a discrimination task and a photoidentification session. (c) An example raster histogram of a photo-responsive BLA neuron (left), and photoresponse latencies of identified BLA-NAc, BLA-CeA, and in-network neurons (right). (d) Seven different clusters were identified using hierarchical clustering based on neural responses to sucrose, neutral, and shock CSs. (e) Comparing to the control group, the CRISPR group showed reduced neural responses to sucrose CS and shock CS, while responses to the neutral CS across clusters were largely indifferent between the control and CRISPR group (For sucrose, neutral, and shock CS, cluster 1: *P=0.03, P=0.32, P=0.52; cluster 2: P=0.31, P=0.14, *P=0.02; cluster 3: *P=0.04, P=0.051, *P=0.04; cluster 4: *P=0.03, P=0.43, *P=0.03; cluster 5: P=0.21, P=0.07, P=0.06; cluster 6: P=0.936, P=0.457, *P=0.027; cluster 7: P=0.23, **P=0.004, P=0.16; two-tailed unpaired t-test). (f, g) BLA-NAc and BLA-CeA population in the CRISPR group showed significantly reduced excitation and inhibition to the sucrose CS compared to the control group, respectively (BLA-NAc: *P=0.0465; BLA-CeA: *P=0.0481; two-tailed unpaired t-test). The shaded regions in e indicate the time window used for analysis of each CS in the adjacent panels for all clusters. Black dotted lines on the mean traces in e-g indicate the onset of CSs. n denotes number of neurons in each group. Error bars and solid shaded regions around the mean indicate s.e.m.
Figure 5:
Figure 5:. Computational analysis reveals BLA population dynamics, encoding of valence, and the behavioral preference in action selection.
(a) Principal component analysis (PCA) was applied on the pooled raw firing rates of all neurons to reward, neutral, and shock CS, and the first 2 components were used for plotting the neural trajectories. Inset: neural trajectories of the control and CRISPR group in the same PCA subspace reveals group differences in both trajectory length and distance between CSs (Two-tailed unpaired t-test, N=12 and 14 for control and CRISPR group using a leave-one-out approach, respectively. See Methods for details. ***P<0.0001 for sucrose and shock CSs and ***P=0.0002 for neutral CS). (b) A support vector machine (SVM) was used to decode trial types (sucrose or shock trial) using the first 10 PC scores of the averaged neural activity of each trial. The SVM decoder performed equally well when trained and tested on the same groups (trained and tested on the control data or on the CRISPR data), while the decoder performance remained at the baseline level when the model was trained and tested on the shuffled trial labels (5-fold validations for all groups. Control vs. CRISPR: P=0.2122; Control vs. Control Shuffled: ***P<0.0001; CRISPR vs. CRISPR Shuffled: ***P<0.0001). (c) SVM decoder performance significantly dropped when the model was trained on the control data and tested on the CRISPR data, compared to trained on the CRISPR data and tested on the control data (5-fold validations for all groups. Trained on control vs. trained on CRISPR: ***P<0.0001; trained on control vs. Shuffled: ***P<0.0001; trained on CRISPR vs. Shuffled: ***P<0.0001). One-way ANOVA with Holm-Sidak’s multiple comparisons test for b and c. (d, g) Mice exhibited distinct behavioral strategies that are distributed across the total behavioral space for sucrose and shock trials. Passive or active strategy in sucrose trials were described by the low or high changes in distance moved toward port after the sucrose CS onsets, and in shock trials were described by high freezing and low darting or low freezing and high darting in response to shock CS, respectively. (e, h) Illustrations of behavior in passive and active strategies during both sucrose and shock trials. (f, i) Control mice showed more active trials in responses to both sucrose and shock CSs compared to CRISPR-treated mice (Two-tailed unpaired t-test, *P=0.0325 for sucrose trials and *P=0.0251 for shock trials; N=15). Error bars and solid shaded regions around the mean indicate s.e.m.

Similar articles

Cited by

References

    1. Namburi P et al. A circuit mechanism for differentiating positive and negative associations. Nature 520, 675–678 (2015). - PMC - PubMed
    1. Beyeler A et al. Divergent Routing of Positive and Negative Information from the Amygdala during Memory Retrieval. Neuron (2016) doi:10.1016/j.neuron.2016.03.004. - DOI - PMC - PubMed
    1. Beyeler A et al. Organization of Valence-Encoding and Projection-Defined Neurons in the Basolateral Amygdala. Cell Rep. 22, 905–918 (2018). - PMC - PubMed
    1. Shen C-J et al. Cannabinoid CB1 receptors in the amygdalar cholecystokinin glutamatergic afferents to nucleus accumbens modulate depressive-like behavior. Nat. Med. 25, 337–349 (2019). - PubMed
    1. Kim J, Pignatelli M, Xu S, Itohara S & Tonegawa S Antagonistic negative and positive neurons of the basolateral amygdala. Nat. Neurosci. 19, 1636–1646 (2016). - PMC - PubMed