. 2022 Jul;607(7920):756-761.
doi: 10.1038/s41586-022-04979-5. Epub 2022 Jul 20.

Oocytes maintain ROS-free mitochondrial metabolism by suppressing complex I

Affiliations

Oocytes maintain ROS-free mitochondrial metabolism by suppressing complex I

Aida Rodríguez-Nuevo et al. Nature. 2022 Jul.

Abstract

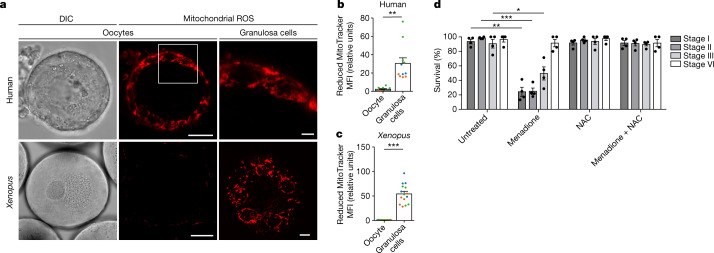
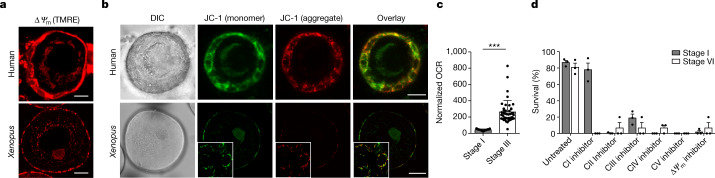
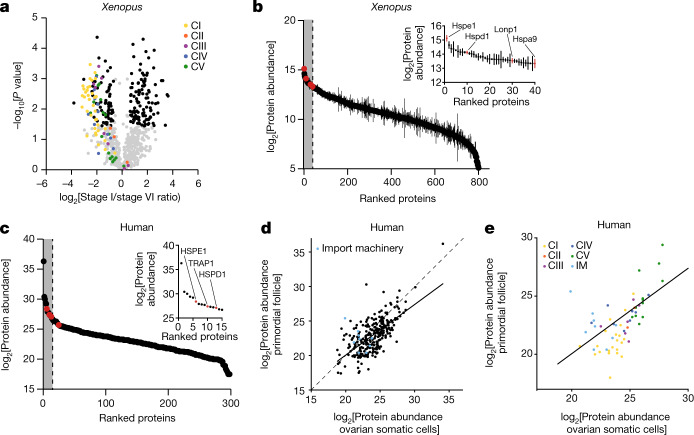
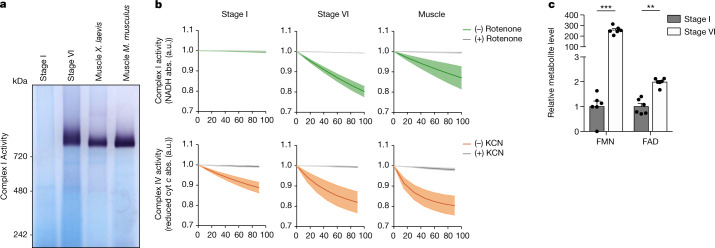
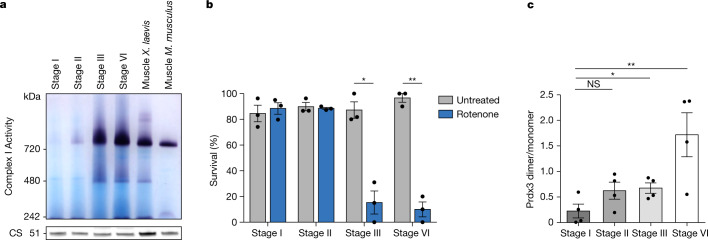
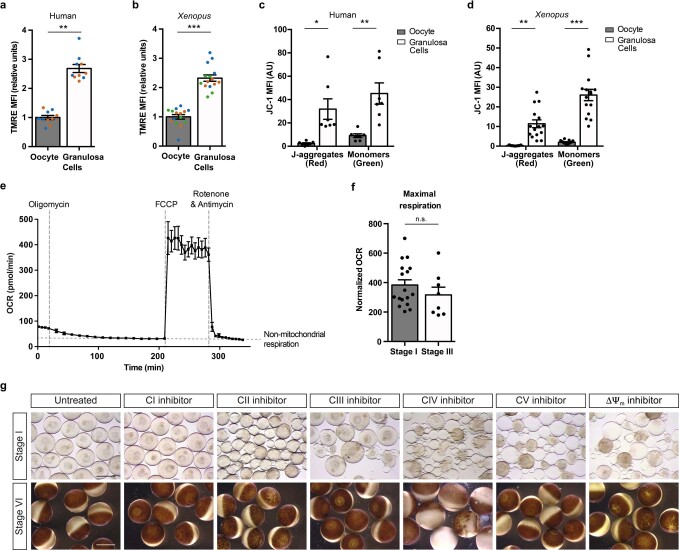
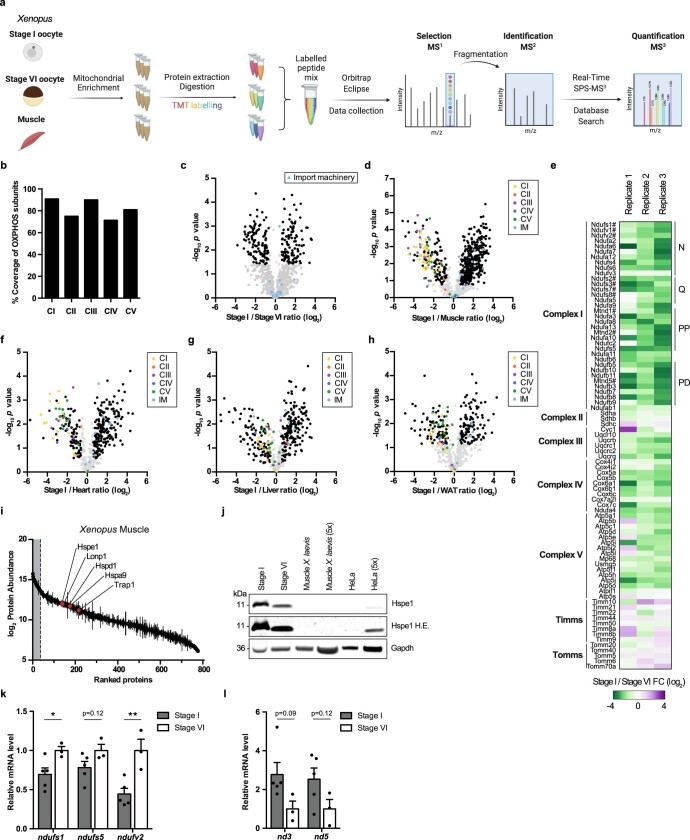
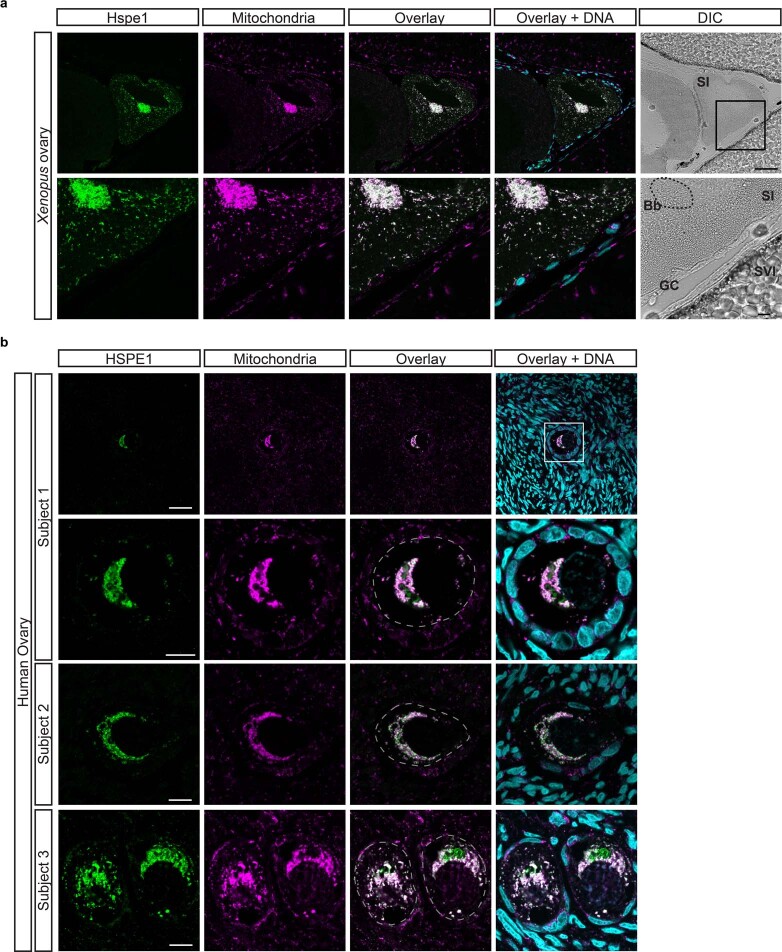
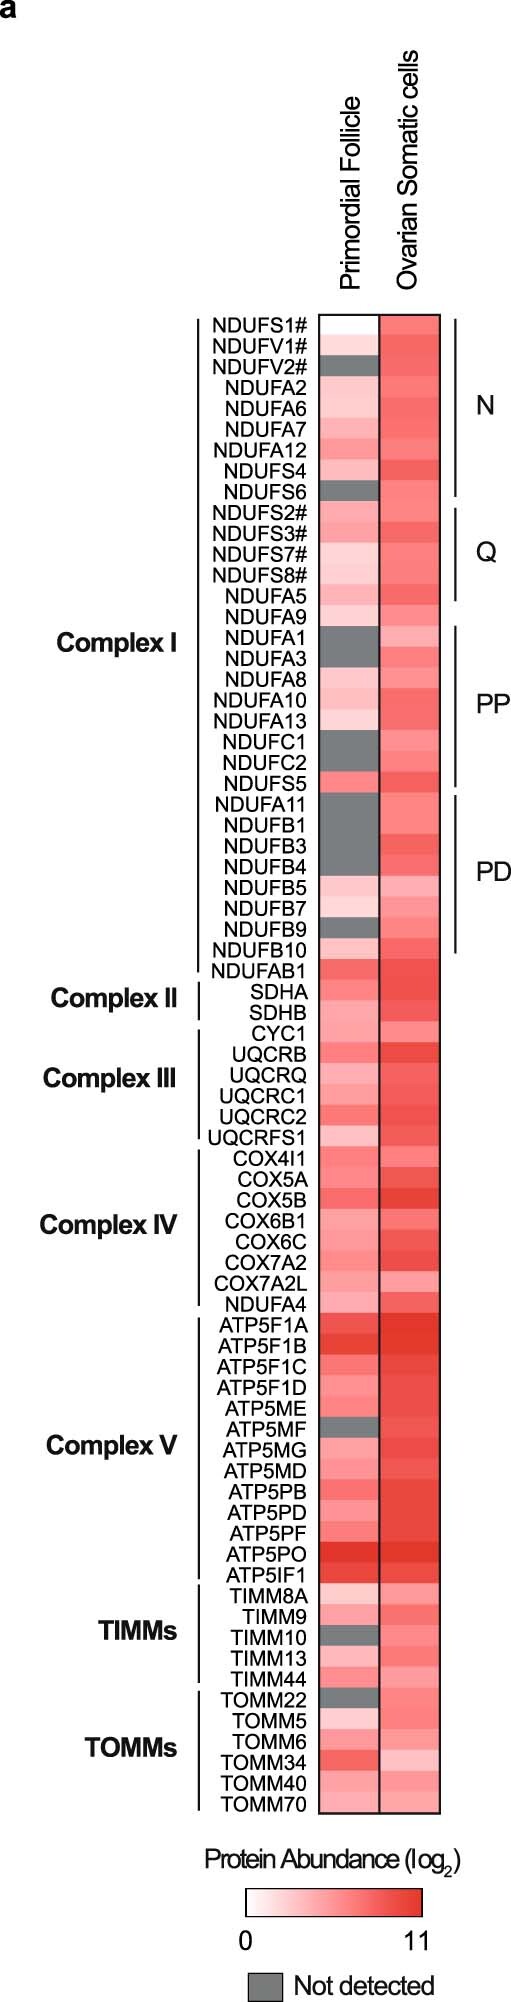
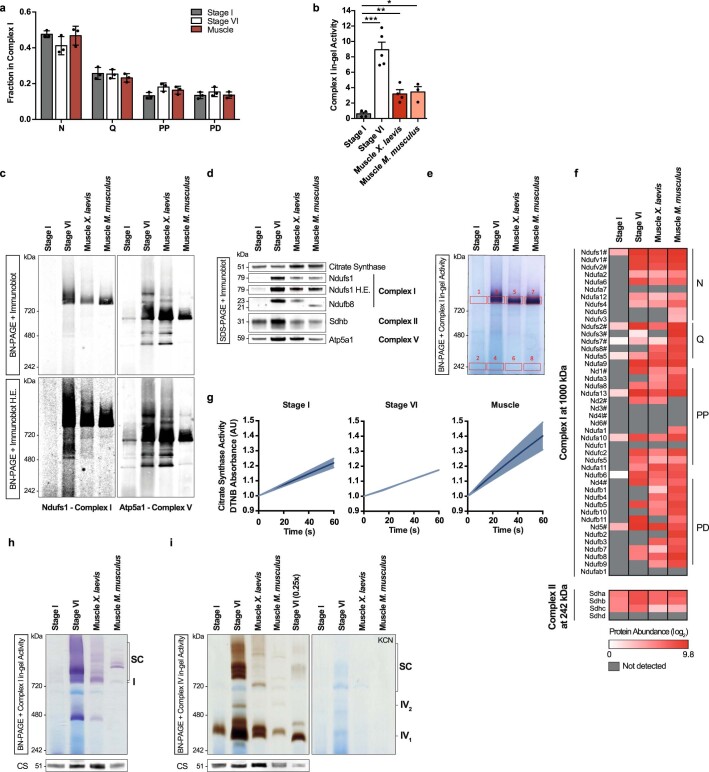
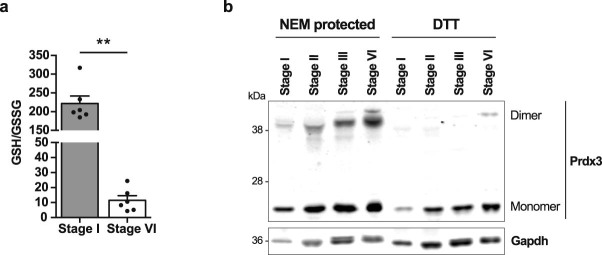
Oocytes form before birth and remain viable for several decades before fertilization1. Although poor oocyte quality accounts for most female fertility problems, little is known about how oocytes maintain cellular fitness, or why their quality eventually declines with age2. Reactive oxygen species (ROS) produced as by-products of mitochondrial activity are associated with lower rates of fertilization and embryo survival3-5. Yet, how healthy oocytes balance essential mitochondrial activity with the production of ROS is unknown. Here we show that oocytes evade ROS by remodelling the mitochondrial electron transport chain through elimination of complex I. Combining live-cell imaging and proteomics in human and Xenopus oocytes, we find that early oocytes exhibit greatly reduced levels of complex I. This is accompanied by a highly active mitochondrial unfolded protein response, which is indicative of an imbalanced electron transport chain. Biochemical and functional assays confirm that complex I is neither assembled nor active in early oocytes. Thus, we report a physiological cell type without complex I in animals. Our findings also clarify why patients with complex-I-related hereditary mitochondrial diseases do not experience subfertility. Complex I suppression represents an evolutionarily conserved strategy that allows longevity while maintaining biological activity in long-lived oocytes.


Conflict of interest statement

The authors declare no competing interests.

Figures

Fig. 1
Fig. 1. Early oocytes have undetectable levels of ROS.
a, Live-cell imaging of human and Xenopus early oocytes, both with attached granulosa cells. The ROS level was measured using MitoTracker Red CM-H2XRos (H2X), a reduced mitochondrial dye that does not fluoresce until it is oxidized by ROS. The boxed area is magnified in the top right image. Xenopus granulosa cells were imaged at the basal plane of the oocyte. DIC, differential interference contrast. Scale bars, 15 µm (human oocytes), 50 µm (Xenopus oocytes), 3 µm (human granulosa cells) and 10 µm (Xenopus granulosa cells). b,c, Quantification of the mean fluorescence intensity (MFI) of H2X in the oocyte and in the population of granulosa cells surrounding the equatorial plane of the oocyte for human (b) and Xenopus (c) oocytes. The data represent the mean ± s.e.m. of three biological replicates, shown in different colours. **P = 0.0001 and ***P = 4.13 × 10−11 using a two-sided Student’s t-test. d, Overnight survival of oocytes at the indicated stages of oogenesis after treatment with menadione, N-acetyl cysteine (NAC) or the combination of both (see Extended Data Fig. 1j for experimental design). At least ten oocytes were incubated per condition. The data represent the mean ± s.e.m. across four biological replicates. *P = 1.94 × 10−9, **P = 3.77 × 10−18 and ***P = 2.37 × 10−19 compared with the untreated condition using a two-sided Student’s t-test with Šidák–Bonferroni-adjusted P values for multiple comparisons. Source data
Fig. 2
Fig. 2. OXPHOS is low, but essential, in early oocytes.
a,b, Live-cell imaging of human and Xenopus early oocytes with attached granulosa cells labelled with tetramethylrhodamine ethyl ester perchlorate (TMRE) to detect mitochondrial membrane potential (ΔΨm; a) and JC-1, a membrane potential sensitive binary dye (b). Green JC-1 fluorescence is a sign of low membrane potential; red fluorescence indicates JC-1 aggregation inside mitochondria, and thus high membrane potential. The insets in the Xenopus images show granulosa cells imaged in the basal plane of the oocyte. DIC, differential interference contrast. Scale bars, 10 µm (human oocytes) and 50 µm (Xenopus oocytes). Representative images are shown (see Extended Data Fig. 2 for quantification of independent experiments). c, The basal oxygen consumption rate in early (stage I) and growing (stage III) Xenopus oocytes, normalized for total protein per sample (n = 17 for stage I and n = 43 for stage III). The data represent mean ± s.e.m. ***P = 2.98 × 10−8 using a two-sided Student’s t-test. d, Overnight survival of early (stage I) and late (stage VI) oocytes after treatments with mitochondrial poisons: complex I (CI) to V (CV) inhibitors and an ionophore (5 µM rotenone, 50 mM malonic acid, 5 µM antimycin A, 50 mM KCN, 200 µM N,N′-dicyclohexylcarbodiimide (DCCD) or 30 µM carbonyl cyanide m-chlorophenyl hydrazone (CCCP), respectively). At least 50 early and 10 late-stage oocytes were incubated per condition. ΔΨm, mitochondrial membrane potential. The data represent the mean ± s.e.m. across three biological replicates. Source data
Fig. 3
Fig. 3. The mitochondrial proteomes of Xenopus and human oocytes.
a, A volcano plot showing P values versus fold changes of mitochondrial proteins between early (stage I) and late (stage VI) oocytes. The subunits of the mitochondrial OXPHOS machinery are indicated in colour, according to the key in the plot. Other mitochondrial proteins significantly changing (q value < 0.05, >1.5-fold change) are depicted in black. n = 3 outbred animals, P values were calculated using two-sided Student’s t-test, and q values were obtained by multiple-comparison adjustment. b, The early Xenopus oocyte proteome ranked by protein abundance. The inset shows data for the top 5% most abundant proteins, corresponding to the grey area of the graph. UPRmt proteins are indicated in red. The data are the mean ± s.e.m. from n = 3 outbred animals. c, The human primordial follicle proteome ranked by protein abundance. The inset shows data for the top 5% most abundant proteins, corresponding to the grey area of the graph. Oocytes were collected from ovaries of two patients and pooled together. UPRmt proteins are indicated in red. d,e, Scatter plots comparing mitochondrial (d) and OXPHOS (e) protein abundance in human primordial follicles and ovarian somatic cells. The dashed line represents the identity line x = y and the solid line shows the linear regression estimate relating protein abundance between mitochondrial proteomes of primordial follicles and ovarian somatic cells. IM, import machinery.
Fig. 4
Fig. 4. Complex I is not assembled in early oocytes.
a, Mitochondrial fractions solubilized in n-dodecyl-β-d-maltoside (DDM) were resolved by BN-PAGE and complex I activity was assayed by reduction of nitro blue tetrazolium chloride (NBT) in the presence of NADH. n ≥ 3 (see Extended Data Fig. 6b for quantifications). b, Spectrophotometric analysis of complex I (green, rotenone-specific activity) and complex IV (orange, KCN-specific activity) activities in mitochondrial extracts from early (stage I) and late (stage VI) oocytes and muscle. cyt c, cytochrome c; abs, absorbance; a.u., arbitrary units. The data represent the mean ± s.e.m.; n = 3 biological replicates. c, Flavin mononucleotide (FMN) and flavin adenine dinucleotide (FAD) levels in early (stage I) and late (stage VI) Xenopus oocytes. The data represent the mean ± s.e.m.; n = 6. ***P = 6.92 × 10−9 and **P = 3.57 × 10−5 using two-sided Student’s t-test with Šidák–Bonferroni-adjusted P values for multiple comparisons. Source data
Fig. 5
Fig. 5. Complex I and ROS levels correlate throughout oogenesis.
a, Mitochondrial fractions from early (stage I), maturing (stage II and stage III) and late-stage (stage VI) Xenopus oocytes and muscle solubilized in n-dodecyl-β-d-maltoside (DDM) were resolved by BN-PAGE and complex I activity was assayed. One representative gel from three independent experiments is shown. CS, citrate synthase. b, Overnight survival of early (stage I), maturing (stage II and III) and late-stage (stage VI) Xenopus oocytes after treatment with the complex I inhibitor rotenone (5 µM). At least 10 oocytes were incubated per condition. The data represent the mean ± s.e.m.; n = 3 biological replicates. *P = 0.0028 and **P = 0.0002 using two-sided Student’s t-test with Šidák–Bonferroni-adjusted P values for multiple comparisons. c, Prdx3 dimer/monomer ratio assessed in oocytes in the indicated stages of oogenesis. The data represent the mean ± s.e.m; n = 4 biological replicates. NS, not significant (P = 0.1128), *P = 0.0376 and **P = 0.0164 using two-sided Student’s t-test with Šidák–Bonferroni-adjusted P values for multiple comparisons. Source data
Extended Data Fig. 1
Extended Data Fig. 1. Undetectable levels of ROS in the early oocytes.
a, A comparison between select reproductive traits of humans and Xenopus laevis, which live on average 76 years and 15 years in captivity, respectively. Xenopus oocytes have long been used in reproduction studies,, in part because they are more accessible and share many conserved features with human oocytes, such as (1) a long dormancy period: Xenopus oocytes arrest at late-stage I for several years. Moreover, a large population of early oocytes is maintained in adult female ovaries throughout most of its life-time, suggesting the presence of an oocyte reserve similar to humans. (2) A similar duration of the maturation period from early oocytes to mature eggs. (3) A measurable decline in fertility with age,,. (4) A cytoplasmic distribution and activity of organelles similar to humans, including a Balbiani body found in the ooplasm of both species,,. On the other hand, humans and Xenopus differ in their modes of fertilization: humans undergo internal fertilization, while Xenopus fertilization takes place externally. This important difference affects several features related to fertilization: Xenopus lay many eggs, each with considerable internal nutrient reserves for survival outside of the body, whereas humans ovulate only 1-2 eggs per cycle with little internal nutrient reserves. b, A schematic of Xenopus laevis oogenesis according to. Oogenesis in Xenopus is divided into six stages based on the morphology of the developing oocytes: oocytes are transparent and measure 50-300 microns in stage I. Oocytes grow and gradually accumulate pigments and yolk to become opaque and measure more than 1 mm in stage VI, when they are ready to be ovulated. c, Schematic representation of human and Xenopus early oocytes with attached granulosa cells. Nuclei (n) are depicted in blue and Balbiani bodies (Bb) in green. Note that Xenopus early oocytes are so large that their granulosa cells are visible only as small puncta on the periphery of the oocyte in the same magnification. d, f, Live-cell imaging of Xenopus early (stage I) oocytes with attached granulosa cells with MitoSOX (d), and CellROX (f) to detect their ROS levels. Granulosa cells were imaged in the basal plane of the oocyte. DIC, differential interference contrast. Scale bars: 50 µm and 10 µm for oocytes and granulosa cells, respectively. e, g, Quantification of MitoSOX (e) and CellROX (g) probes inside oocytes and in granulosa cells (n=3; biological replicates shown in colours). The data represent the mean ± s.e.m. ***P = 4.298 × 10⁻⁸ and **P = 1.86 × 10⁻⁵ using two-sided Student’s t-test. h, Live-cell imaging of ROS in early oocytes untreated or treated with menadione 10 µM for 2h. Untreated oocytes were incubated with Wheat Germ Agglutinin (WGA)488 (green) to mark the plasma membrane, then combined with treated oocytes in the same dish and labelled with MitoSOX. Scale bar: 50 µm. i, Quantification of MitoSOX in oocytes at the 4h timepoint (untreated or treated with 10 µM Menadione for 2h followed by 2h wash). The data represent the mean ± s.e.m, n=3 biological replicates, at least 3 oocytes were quantified per replicate ****P = 2.21 × 10⁻⁹ using two-sided Student’s t-test. j, Experimental design for the assessment of survival upon mild ROS production. Freshly isolated early (stage I), maturing (stage II and III), and late-stage (stage VI) oocytes of were treated with 10 µM menadione in the presence or in the absence of 10 mM N-acetyl cysteine (NAC). After 2h, menadione was removed and NAC was maintained for an overnight, when survival was determined. Source data
Extended Data Fig. 2
Extended Data Fig. 2. Oxidative phosphorylation is essential in early oocytes.
a, b, Quantification of the mean fluorescence intensity (MFI) of TMRE in the oocyte and in the population of granulosa cells surrounding the equatorial plane of the oocyte for human (a) and Xenopus oocytes (b). The data represent the mean ± s.e.m. **P = 2.83 × 10⁻⁹ n=2 biological replicates in human; and ***P = 1.09 × 10⁻¹⁰ n=3 in Xenopus; using two-sided Student’s t-test. Replicates shown in colours. c, d, Quantification of the mean fluorescence intensity (MFI) of JC-1 aggregates (red) and monomers (green) in the oocyte and in the population of granulosa cells surrounding the equatorial plane of the oocyte for human (c) and Xenopus oocytes (d). We could not detect any red fluorescence in oocytes; an additional 2-hour incubation with JC-1 did not lead to detection of red fluorescence inside the oocyte either. The data represent the mean ± s.e.m. *P = 0.005 and **P = 0.002 in human, n=4; and **P = 5.67 × 10⁻⁶ and ***P = 4.42 × 10⁻⁹, n=3 in Xenopus; using two-sided Student’s t-test with Šidák-Bonferroni-adjusted P values for multiple comparisons. e, Oxygen consumption rate (OCR) as assessed by a seahorse analyser (XFe96) in early (stage I) Xenopus oocytes (mean ± SEM, n = 9). f, Maximal oxygen consumption rate in early (stage I) and growing (stage III) Xenopus oocytes, normalized for total protein/sample (n=17 for stage I and n=8 for stage III). The data represent the mean ± s.e.m. n.s. not significant (P = 0.299) using two-sided Student’s t-test. g, Representative images of Xenopus oocytes after an overnight treatment with mitochondrial poisons (5 µM Rotenone, 50 mM malonic acid, 5 µM antimycin A, 50 mM KCN, 200 µM DCCD or 30 µM CCCP). Upper panel shows early (stage I) oocytes and bottom panel displays late (stage VI) oocytes. Cell death can be recognized in early (stage I) oocytes by loss of plasma membrane integrity and/or loss of nucleus; and in late (stage VI) oocytes by development of a mottling pattern in the pigmentation of the animal pole (see main Fig. 2 for quantifications of three independent experiments). Scale bars: 250 µm and 1 mm for stage I and stage VI oocytes, respectively. Source data
Extended Data Fig. 3
Extended Data Fig. 3. OXPHOS machinery is reduced in Xenopus early oocytes.
a, A schematic representation of isobaric-tag-based quantification of the mitochondrial proteomes of early (stage I), late (stage VI) oocytes, and muscle. The image was created with BioRender.com. b, Percentage of proteins identified in the isobaric-tag-based quantification compared to all known subunits of OXPHOS machinery belonging to complexes I to V. c, A volcano plot showing P values versus fold changes of mitochondrial proteins between early (stage I) and late (stage VI) oocytes. Proteins significantly changing (q value <0.05, >1.5-fold change) are depicted in black. Subunits of mitochondrial import machinery (TIMs and TOMs) are highlighted in light blue. n=3 biological replicates. d, A volcano plot showing P values versus fold changes of mitochondrial proteins between early (stage I) oocytes and muscle. Subunits of OXPHOS and mitochondrial import machinery are highlighted in indicated colours. Other proteins significantly changing (q value <0.05, >1.5-fold change) are depicted in black. n=3 biological replicates. e, Heatmap of fold changes (early- vs late-stage oocytes) of all quantified subunits of the OXPHOS and mitochondrial import machinery. # marks core subunits of complex I. f, g, h, Volcano plots displaying P values versus fold changes of mitochondrial proteins between early (stage I) oocytes and heart (f), liver (g) and white adipose tissue (WAT) (h). Subunits of OXPHOS and mitochondrial import machinery are highlighted in indicated colours. Other proteins significantly changing (q value <0.05, >1.5-fold change) are depicted in black. n=2 biological replicates. i, Mitochondrial proteome in Xenopus muscle ranked by abundance. UPRmt proteins are indicated in red. The data represent the mean ± s.e.m. from n=3 animals. j, Immunoblotting of Hspe1 in early (stage I), late (stage VI) oocytes, muscle and HeLa cells. Gapdh is used as a loading marker. H.E: High Exposure. One representative immunoblot from two independent experiments is shown. k, l, mRNA levels of early (stage I) and late (stage VI) oocytes of nuclear (k) and mitochondrial (l) encoded complex I subunits. The data represent the mean ± s.e.m. (n=5 for stage I and n=3 for stage VI). *P = 0.041, **P = 0.0081 using two-sided Student’s t-test with Šidák-Bonferroni-adjusted P values for multiple comparisons. CI - CV: Complex I - Complex V; IM: Import machinery. In (c,d,f,g,h) P values were calculated using two-sided Student’s t-test, an q values were obtained by multiple comparison adjustment. Source data
Extended Data Fig. 4
Extended Data Fig. 4. UPRmt is constitutively active in early oocytes of human and Xenopus.
a, b, Immunofluorescence of paraffin embedded sections of Xenopus (a) and human (b) ovaries with antibodies against HSPE1 (to monitor UPRmt) and ATP5A1 (to mark mitochondria). Hoechst was used to mark DNA. ATP5A1 was detected both in oocytes and somatic cells of the ovary. HSPE1, on the other hand, was so abundant in oocytes compared to surrounding cells that no signal could be detected from somatic cells without oversaturating the HSPE1 signal from early oocytes. Representative images from three independent experiments are shown. SI: early (stage I) oocyte; SVI: late (stage VI) oocyte; GC: Granulosa cells; Bb: Balbiani body. DIC, differential interference contrast. Scale bars: 50 µm (upper panel) and 10 µm (lower panel) for Xenopus, and 30 µm (upper panel) and 10 µm (three lower panels) for human.
Extended Data Fig. 5
Extended Data Fig. 5. OXPHOS machinery is reduced in human early oocytes.
a, Heatmap of normalized mitochondrial protein abundances in human primordial follicles and ovarian somatic cells organized by subunits of OXPHOS and mitochondrial import machinery. # marks core subunits of complex I. Proteins that were not identified are indicated in grey.
Extended Data Fig. 6
Extended Data Fig. 6. Complex I is not assembled in early oocytes.
a, Fraction of the mean abundance of the indicated modules among all complex I modules in Xenopus oocytes and muscle tissue. Note that this analysis inevitably misses undetected subunits. The data represent the mean ± s.e.m. for n=3 animals. b, Quantification of reduced NBT intensity in BN-PAGE gels after complex I in-gel activity assays. The data represent the mean ± s.e.m. (n=5 for stage VI, n=4 for stage I and frog muscle, and n=3 for mouse muscle; biological replicates). *P = 0.0062, **P = 0.00046, and ***P = 1.44 × 10⁻⁴ using two-sided Student’s t-test with Šidák-Bonferroni-adjusted P values for multiple comparisons. c, DDM solubilized mitochondrial fractions were resolved by BN-PAGE followed by immunoblotting using antibodies against Ndufs1 and Atp5a1 to detect complexes I and V, respectively. Lower panels show high exposure (H.E.) blots. One representative immunoblot from three independent experiments is shown. d, SDS-PAGE and immunoblotting of mitochondrial fractions in (Fig. 4a) for complex I (Ndufs1 and Ndufb8), complex II (Sdhb) and complex V (Atp5a1) subunits, and citrate synthase as mitochondrial loading control. H.E. denotes high exposure. One representative immunoblot from three independent experiments is shown. e, Representation of excision sites for mass spectrometric identification of complex I and complex II subunits. f, Heatmap of protein abundances detected in bands excised from regions corresponding to assembled complex I, and complex II. Complex I subunits are organized by module, and # marks core subunits. Proteins that were not quantified are indicated in grey. g, Spectrophotometric analysis of citrate synthase activity in mitochondrial extracts from early (stage I), late (stage VI) oocytes and muscle. The data represent the mean ± s.e.m., n=3 biological replicates. h, i Digitonin solubilized mitochondrial fractions were resolved by BN-PAGE. Complex I (h) and complex IV (i) activities were assayed to detect supercomplexes (SC). Representative gels from three independent experiments are shown. Source data
Extended Data Fig. 7
Extended Data Fig. 7. Complex I and ROS levels throughout oogenesis.
a, GSH/GSSG ratio in early (stage I) and late-stage (stage VI) oocytes. The data represent the mean ± s.e.m., n=6. ** P = 1.24 × 10⁻⁶ using two-sided Student’s t-test. b, Immunoblotting of Prdx3 in early (stage I), maturing (stage II and III), and late-stage (stage VI) oocyte extracts processed in non-reducing (NEM protected) or reducing (DTT) conditions. Monomeric and dimeric Prdx3 are indicated. Gapdh was used as a loading control. One representative immunoblot from four independent experiments is shown. Source data

Comment in

References

    1. Faddy MJ, Gosden RG, Gougeon A, Richardson SJ, Nelson JF. Accelerated disappearance of ovarian follicles in mid-life: implications for forecasting menopause. Hum. Reprod. 1992;7:1342–1346. doi: 10.1093/oxfordjournals.humrep.a137570. - DOI - PubMed
    1. Igarashi H, Takahashi T, Nagase S. Oocyte aging underlies female reproductive aging: biological mechanisms and therapeutic strategies. Reprod. Med. Biol. 2015;14:159–169. doi: 10.1007/s12522-015-0209-5. - DOI - PMC - PubMed
    1. Prasad S, Tiwari M, Pandey AN, Shrivastav TG, Chaube SK. Impact of stress on oocyte quality and reproductive outcome. J. Biomed. Sci. 2016;23:23–36. doi: 10.1186/s12929-016-0253-4. - DOI - PMC - PubMed
    1. Agarwal A, Gupta S, Sharma RK. Role of oxidative stress in female reproduction. Reprod. Biol. Endocrinol. 2005;3:28. doi: 10.1186/1477-7827-3-28. - DOI - PMC - PubMed
    1. Aitken RJ. Impact of oxidative stress on male and female germ cells: implications for fertility. Reproduction. 2020;159:R189–R201. doi: 10.1530/REP-19-0452. - DOI - PubMed

Substances