. 2022 Jul;607(7920):776-783.
doi: 10.1038/s41586-022-04878-9. Epub 2022 Jul 20.

ADAR1 averts fatal type I interferon induction by ZBP1

Affiliations

ADAR1 averts fatal type I interferon induction by ZBP1

Huipeng Jiao et al. Nature. 2022 Jul.

Abstract

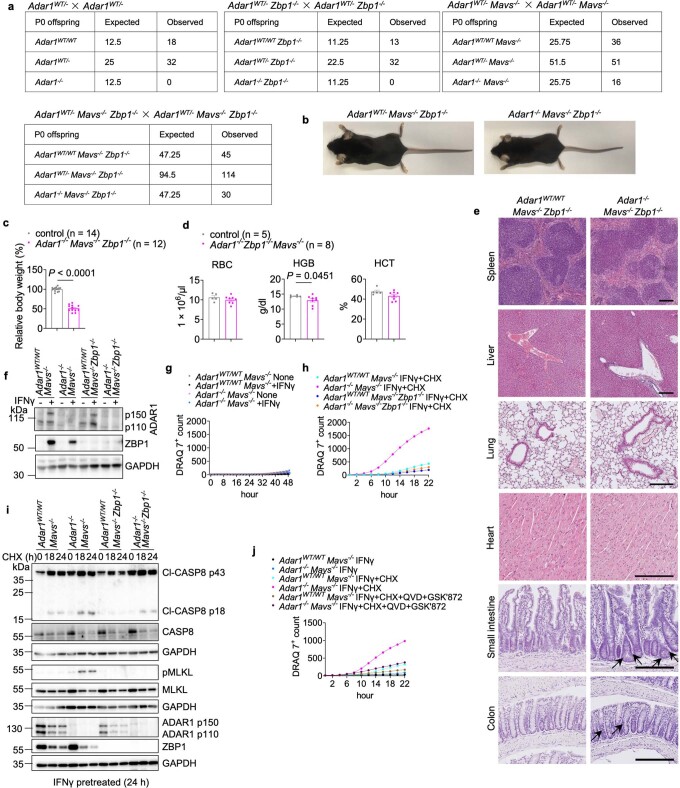
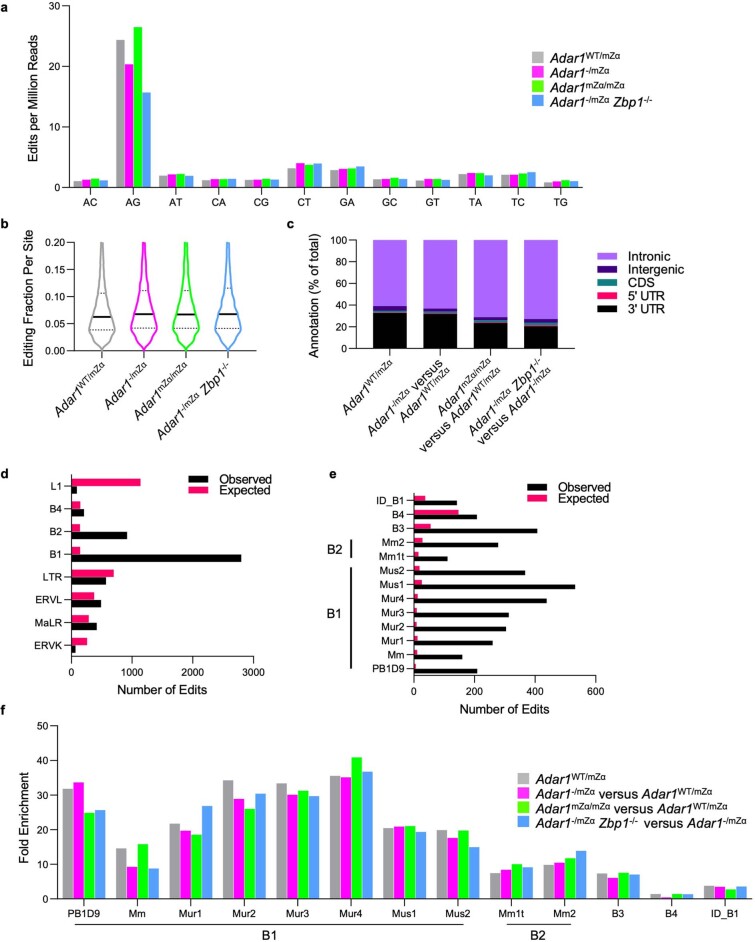
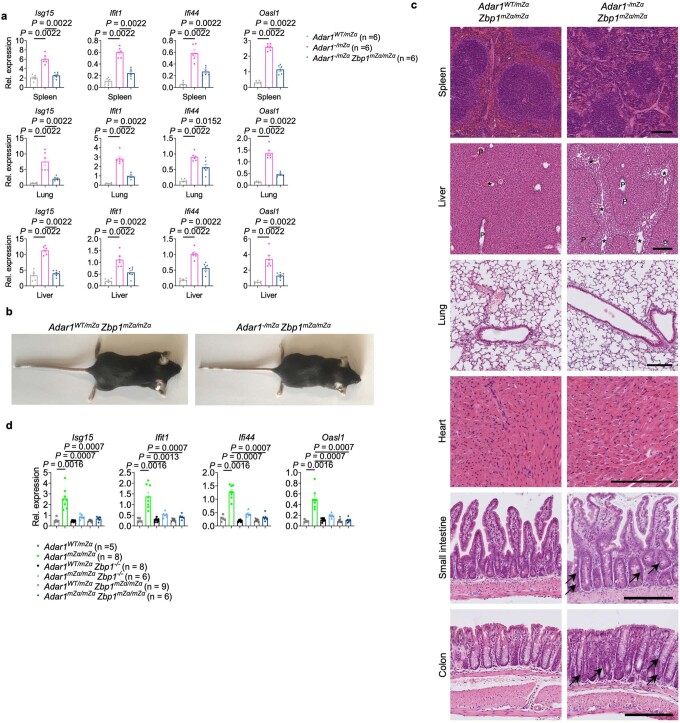
Mutations of the ADAR1 gene encoding an RNA deaminase cause severe diseases associated with chronic activation of type I interferon (IFN) responses, including Aicardi-Goutières syndrome and bilateral striatal necrosis1-3. The IFN-inducible p150 isoform of ADAR1 contains a Zα domain that recognizes RNA with an alternative left-handed double-helix structure, termed Z-RNA4,5. Hemizygous ADAR1 mutations in the Zα domain cause type I IFN-mediated pathologies in humans2,3 and mice6-8; however, it remains unclear how the interaction of ADAR1 with Z-RNA prevents IFN activation. Here we show that Z-DNA-binding protein 1 (ZBP1), the only other protein in mammals known to harbour Zα domains9, promotes type I IFN activation and fatal pathology in mice with impaired ADAR1 function. ZBP1 deficiency or mutation of its Zα domains reduced the expression of IFN-stimulated genes and largely prevented early postnatal lethality in mice with hemizygous expression of ADAR1 with mutated Zα domain (Adar1mZα/- mice). Adar1mZα/- mice showed upregulation and impaired editing of endogenous retroelement-derived complementary RNA reads, which represent a likely source of Z-RNAs activating ZBP1. Notably, ZBP1 promoted IFN activation and severe pathology in Adar1mZα/- mice in a manner independent of RIPK1, RIPK3, MLKL-mediated necroptosis and caspase-8-dependent apoptosis, suggesting a novel mechanism of action. Thus, ADAR1 prevents endogenous Z-RNA-dependent activation of pathogenic type I IFN responses by ZBP1, suggesting that ZBP1 could contribute to type I interferonopathies caused by ADAR1 mutations.


Conflict of interest statement

The authors declare no competing interests.

Figures

Fig. 1
Fig. 1. ZBP1 contributes to IFN induction and early postnatal lethality in mice hemizygously expressing ADAR1 with a mutated Zα domain.
a, Kaplan–Meier survival graph of mice with the indicated genotypes. P values were calculated by two-sided Gehan–Breslow–Wilcoxon test. Control mice included littermates with the Adar1mZα/WT, Adar1WT/– or Adar1WT/WT genotype. b,c, Body weight (b) and RBC counts and HGB and HCT levels in the blood (c) for mice with the indicated genotypes at P1. Mavs−/− mice included littermates with the Adar1mZα/WTMavs−/−, Adar1WT/−Mavs−/− or Adar1WT/WTMavs−/− genotype. d, Representative images of small intestine (SI) and colon sections immunostained for CC3 and graphs depicting quantification of CC3+ cells in mice with the indicated genotypes. Scale bars, 50 μm. e, Top, PCA on RNA-seq data from spleen, lung and brain tissues isolated from mice with the indicated genotypes at P1. PCA was based on genes differentially expressed between Adar1mZα/– and Adar1mZα/WT control mice, including 1,594 (P ≤ 0.05, q ≤ 0.05, ≥2-fold change), 657 (P ≤ 0.05, q ≤ 0.05, ≥2-fold change) and 379 (P ≤ 0.05, ≥2-fold change) genes for the spleen, lung and brain, respectively (Supplementary Table 2). Bottom, fold change (log10) in expression of the 93 ISGs commonly upregulated in all three tissues examined (Supplementary Table 2). Symbols represent mean values of individual genes, solid lines show mean expression of the 93 genes and dashed lines denote the twofold change boundaries. P values were calculated by two-sided non-parametric Mann–Whitney test (spleen) and Kruskal–Wallis test with Dunn’s post hoc test for multiple comparisons (lung and brain). n = 5 for lung and spleen; n = 4 for brain. f, Immunoblot of ZBP1 in lung protein extracts from Adar1mZα/WT and Adar1mZα/– mice at P1. Lanes represent individual mice. GAPDH was used as a loading control. g, qRT–PCR analysis of Zbp1 mRNA expression in the indicated tissues from mice at P1. In bd and g, dots represent individual mice, bar graphs show mean ± s.e.m. and P values were calculated by two-sided non-parametric Mann–Whitney test. For gel source data, see Supplementary Fig. 1. Source data
Fig. 2
Fig. 2. ZBP1 synergizes with MAVS to cause IFN induction and associated pathology in mice with impaired ADAR1 function.
a,b, Relative body weight normalized to that of littermate controls at the age of 10 weeks (a) and RBC counts and HGB and HCT levels in the blood of 15-week-old mice (b) with the indicated genotypes. c, Kaplan–Meier survival graph of mice with the indicated genotypes. Control mice in ac included littermates with the Adar1mZα/WT, Adar1WT/− or Adar1WT/WT genotype. Survival data for Adar1mZα/–Mavs−/− and Adar1mZα/–Zbp1−/− mice and their littermate controls from Fig. 1a are included for comparison. d, Representative images of periodic acid–Schiff (PAS)-stained kidney sections from 15-week-old mice of the indicated genotypes and graphs depicting quantification of histological glomerular MS, glomerular tuft area and cell densities in the glomerular tuft area (arrows indicate non-obliterated capillaries; arrowheads highlight zones of mesangial matrix deposition). Scale bar, 200 μm (top) or 20 μm (bottom). e, Left, PCA on lung RNA-seq data from 15-week-old mice with the indicated genotypes. PCA was based on 678 genes differentially expressed between Adar1mZα/–MavsWT/− mice and the two control groups (Adar1mZα/WT and C57BL/6N) combined (P ≤ 0.05, q ≤ 0.05, ≥2-fold change) (Supplementary Table 3). Right, fold change (log10) in expression of the 399 genes upregulated in Adar1mZα/–MavsWT/− mice, calculated for each genotype by comparison to C57BL/6N mice. Symbols represent mean values of individual genes, solid lines represent mean expression of the 399 genes and dashed lines denote the twofold change boundaries. P values were calculated by Kruskal–Wallis test with Dunn’s post hoc test for multiple comparisons. f, Kaplan–Meier survival graph of mice with the indicated genotypes. Control mice included littermates with the Adar1WT/− or Adar1WT/WT genotype. In a, b and d, dots represent individual mice, bar graphs show mean ± s.e.m. and P values were calculated by Kruskal–Wallis test with Dunn’s post hoc test for multiple comparisons (body weight, HGB, HCT, glomerular tuft area and MS score) or one-way ANOVA with Tukey’s correction for multiple comparisons (RBCs and cells per tuft area). In c and f, P values were calculated by two-sided Gehan–Breslow–Wilcoxon test. Source data
Fig. 3
Fig. 3. Endogenous Z-RNA likely derived from EREs triggers ZBP1-dependent IFN responses in Adar1mZα/– mice.
ac, ERE expression and editing in spleen and brain tissues from mice with the indicated genotypes at P1. a, Heatmap depicting expression of EREs differentially expressed between Adar1mZα/– and Adar1mZα/WT spleen samples (q ≤ 0.05, ≥10-fold change). Only EREs belonging to groups previously linked to formation of dsRNA were included and are ordered by principal component 1 and coloured according to their group. b, Number of differentially edited sites (>2-fold) across the indicated group comparisons. c, Heatmap depicting expression of EREs differentially expressed or differentially edited between Adar1mZα/– and Adar1mZα/WT mice. In a and c, columns represent individual samples, hierarchically clustered according to expression of the selected EREs. d, Kaplan–Meier survival graph of mice with the indicated genotypes. P values were calculated by two-sided Gehan–Breslow–Wilcoxon test. Survival data for Adar1mZα/–Zbp1−/− mice and their littermate controls from Fig. 1a are included for comparison. e,f, Body weight (e) and RBC counts and HGB and HCT levels in blood (f) for mice with the indicated genotypes at P1. Data for Adar1mZα/–Zbp1−/− mice and their littermate controls from Fig. 1b,c are included for comparison. g, Top, PCA on lung RNA-seq data from mice with the indicated genotypes at P1. PCA was based on the 93 ISGs upregulated in all three tissues of Adar1mZα/– mice (Supplementary Table 2). Bottom, fold change (log10) in expression of the same 93 ISGs between mice of each genotype and control Adar1mZα/WT mice. h,i, Relative body weight normalized to that of littermate controls at the age of 10 weeks (h) and RBC counts and HCT and HGB levels in blood at 15 weeks (i) for mice of the indicated genotypes. Data for Adar1mZα/–Zbp1−/− mice and their littermate controls from Fig. 2a,b are included for comparison. Control mice in df, h and i included littermates with the Adar1mZα/WT, Adar1WT/− or Adar1WT/WT genotype. In e, f, h and i, dots represent individual mice, bar graphs show mean ± s.e.m. and P values were calculated by two-sided non-parametric Mann–Whitney test. j, Top, PCA on lung RNA-seq data from 15-week-old mice with the indicated genotypes. PCA was based on the 93 ISGs upregulated in all three tissues of Adar1mZα/– mice (Supplementary Table 2). Bottom, fold change (log10) in expression of the same 93 ISGs between mice of each genotype and control Adar1mZα/WT mice. k, Top, PCA on lung RNA-seq data from 15-week-old mice with the indicated genotypes. PCA was based on the 57 ISGs upregulated in Adar1mZα/mZα mice compared with controls (Supplementary Table 1). Bottom, fold change (log10) in expression of the same 57 ISGs between mice of each genotype and control Adar1mZα/WT mice. In g, j and k, symbols represent mean values of individual genes, solid lines show mean expression of the selected genes and dashed lines denote the twofold change boundaries. P values were calculated by two-sided non-parametric Mann–Whitney test (j) or Kruskal–Wallis test with Dunn’s post hoc test for multiple comparisons (g,k). In a, c, g, j and k, n = 5. Source data
Fig. 4
Fig. 4. ZBP1 promotes IFN induction and early postnatal lethality in Adar1mZα/– mice independently of RIPK3–MLKL-induced necroptosis, FADD–caspase-8-dependent apoptosis and RHIM-dependent RIPK1 signalling.
a, Kaplan–Meier survival graph of mice with the indicated genotypes. Fadd−/−Ripk3−/−, Fadd−/−Mlkl−/− and Ripk1mR/mRMlkl−/− groups included mice with the Adar1mZα/WT, Adar1WT/− or Adar1WT/WT genotype. P values were calculated by two-sided Gehan–Breslow–Wilcoxon test. b,c, Body weight (b) and RBC counts and HGB and HCT levels in blood (c) for mice with the indicated genotypes at P1. d, Left, PCA on lung RNA-seq data from mice with the indicated genotypes at P1. PCA was based on the 93 ISGs upregulated in all three tissues of Adar1mZα/– mice (Supplementary Table 2). Right, fold change (log10) in expression of the same 93 ISGs between mice of each genotype and control Adar1mZα/WT mice. Symbols represent mean values of individual genes, solid lines show mean expression of the selected genes and dashed lines denote the twofold change boundaries. P values were calculated by Kruskal–Wallis test with Dunn’s post hoc test for multiple comparisons. e, qRT–PCR analysis of mRNA expression of the indicated genes in lung tissues from P1 mice with the indicated genotypes. f, Representative images of small intestine and colon sections immunostained for CC3 and quantification of CC3+ cells in P1 mice with the indicated genotypes. CC3+ cell count data for Adar1mZα/– pups from Fig. 1d are included for comparison. Scale bars, 50 μm. In b, c, e and f, dots represent individual mice, bar graphs show mean ± s.e.m. and P values were calculated by two-sided non-parametric Mann–Whitney test. In ac and f, control mice included littermates except for mice with the Adar1mZα/–, Fadd−/−Ripk3−/−, Fadd−/−Mlkl−/− and Ripk1mR/mRMlkl−/− genotypes. Source data
Extended Data Fig. 1
Extended Data Fig. 1. Generation and characterization of Adar1mZα/mZα mice.
a, Schematic depicting the generation of the Adar1mZα allele using CRISPR-Cas12a-mediated gene targeting. The indicated nucleotide substitutions were introduced in exon 1 of the Adar1 gene to substitute amino acids N175 with D and Y179 with A in the Zα domain. Sequencing traces of the desired mutations are shown in homozygous mice. b, RBC, platelet (PLT), white blood cell (WBC), neutrophil (NEU), monocyte (MON), lymphocyte (LYM) counts and HGB and HCT levels in the blood of 10-to-13-month-old mice with the indicated genotypes. c, Spleen-to-body weight ratio of mice with the indicated genotypes. d, Representative H&E-stained sections from spleen, lung, liver, heart and kidney of mice with the indicated genotypes. Adar1mZα/mZα (n = 7), Adar1WT/mZα (n = 10), Adar1WT/WT (n = 3). Scale bar, 100 µm. e, Transcriptional comparison of lung tissues from Adar1mZα/mZα, Adar1WT/mZα and wild type C57BL/6N mice (n = 5 for all genotypes) at 4-5 months of age. The heatmap includes 58 genes differentially expressed between Adar1mZα/mZα mice and the two control groups combined (p ≤ 0.05, q ≤ 0.05, ≥ 2-fold-change), with 57 of these upregulated in the former (Supplementary Data Table 1). Columns represent individual mice, hierarchically clustered according to differential gene expression. Table shows gene ontology (GO) functional annotation of the 57 genes upregulated in Adar1mZα/mZα mice, performed with g:Profiler (https://biit.cs.ut.ee/gprofiler). P values for differential expression analyses were calculated with Qlucore Omics Explorer using two-sided t-tests and with the q value for false discovery rates (FDR) set to 0.05. Calculation of q values was adjusted for multiple hypothesis testing using the Benjamini-Hochberg method. P values for pathway analyses were calculated with g:Profiler using hypergeometric distribution tests and adjusted for multiple hypothesis testing using the g:SCS (set counts and sizes) algorithm, integral to the g:Profiler server (https://biit.cs.ut.ee/gprofiler). f, qRT-PCR analysis of mRNA expression of the indicated genes in indicates tissues from 10-to-13-month-old mice with the indicated genotypes. In b, c and f, dots represent individual mice, bar graphs show mean ± s.e.m and P values were calculated by two-sided nonparametric Mann-Whitney test. Source data
Extended Data Fig. 2
Extended Data Fig. 2. Histological analysis of tissues from Adar1WT/mZα, Adar1−/mZα, Adar1−/mZαMavs−/− and Adar1−/mZαZbp1−/− mice.
a, Representative H&E-stained sections from liver, lung, heart, small intestine and colon from Adar1WT/mZα (n = 5), Adar1−/mZα (n = 7), Adar1−/mZα Mavs−/− (n = 5) and Adar1−/mZα Zbp1−/− (n = 8) mice at P1. Scale bar, 200 µm. Graphs depict histological ileitis and colitis scores. Dots represent individual mice, bar graphs show mean ± s.e.m and P values were calculated by two-sided nonparametric Mann-Whitney test. b, Representative images of PAS-stained kidney sections from Adar1WT/mZα (n = 6), Adar1−/mZα (n = 6), Adar1WT/mZα Zbp1−/− (n = 6) and Adar1−/mZα Zbp1−/− (n = 6) mice at P1. Scale bar, 200 µm (top), 100 µm (middle) or 20 µm (bottom). Mice of all genotypes presented with normal zonal architecture of postnatal kidneys, in particular the cortical nephrogenic zone (white dotted line) appeared unaffected. Black arrows indicate representative protein absorption droplets in proximal tubuli; red arrowheads highlight intact mesangial compartments of respective early mature glomeruli. c–d, Representative images of brain sections from Adar1WT/mZα (n = 8), Adar1−/mZα (n = 11), Adar1−/mZα Mavs−/− (n = 5) and Adar1−/mZα Zbp1−/− (n = 6) mice at P1 stained with H&E (c) or immunolabelled for CD3, B220, IBA1 or MAC3 (d). Scale bar, 200 µm. e, Schematic depicting the generation of Mavs−/− mice using CRISPR-Cas9-mediated gene targeting. Two gRNAs were used to cut in exon 3 and exon 6 resulting in deletion of the respective sequence. DNA sequencing in homozygous mice confirmed the resulting fusion between exons 3 and 6 and the generation of a premature stop codon. Source data
Extended Data Fig. 3
Extended Data Fig. 3. Comparison of RNAseq expression profiles in spleen, lung and brain tissues from Adar1−/mZα and Adar1WT/mZα mice.
a–c, Transcriptional comparison of spleen (a), lung (b) and brain (c) tissues from Adar1−/mZα and Adar1WT/mZα littermate mice at P1. Heatmaps show differentially expressed genes between Adar1−/mZα and Adar1WT/mZα control mice. These were 1,594 (p ≤ 0.05, q ≤ 0.05, ≥ 2-fold-change), 657 (p ≤ 0.05, q ≤ 0.05, ≥ 2-fold-change), and 379 (p ≤ 0.05, ≥ 2-fold-change) genes for the spleen, lung and brain, respectively (Supplementary Data Table 2). Columns represent individual mice, hierarchically clustered according to differential gene expression. Tables show GO functional annotation of the genes found upregulated and downregulated in the comparison between the two genotypes in each organ, performed with g:Profiler (https://biit.cs.ut.ee/gprofiler). P values for differential expression analyses were calculated with Qlucore Omics Explorer using two-sided t-tests and with the q value for false discovery rates (FDR) set to 0.05. Calculation of q values was adjusted for multiple hypothesis testing using the Benjamini-Hochberg method. P values for pathway analyses were calculated with g:Profiler using hypergeometric distribution tests and adjusted for multiple hypothesis testing using the g:SCS (set counts and sizes) algorithm, integral to the g:Profiler server (https://biit.cs.ut.ee/gprofiler). For all genotypes, n = 5 for spleen and lung, n = 4 for brain.
Extended Data Fig. 4
Extended Data Fig. 4. Macroscopic and histological analysis of adult Adar1−/mZα mice deficient in ZBP1 or MAVS.
a, Representative images of mice with the indicated genotypes at about 15 weeks of age. b, Representative H&E-stained sections from indicated tissues of 15-week-old mice with the indicated genotypes. Scale bars, 200 μm. Periportal and pericentral areas in liver sections are marked with P and *, respectively. Pericentral sinusoidal dilatation in Adar1−/mZα MavsWT/− liver section is outlined with dashed lines (top left and bottom right areas). Black arrows indicate dying epithelial cells in small intestinal sections. In a, b, control mice include littermates with Adar1WT/mZα, Adar1WT/− or Adar1WT/WT genotypes. Control (n = 7), Adar1−/mZα Zbp1−/− (n = 11), Adar1−/mZα MavsWT/− (n = 8), Adar1−/mZα Zbp1−/− MavsWT/− (n = 9), Adar1−/mZα Mavs−/− (n = 9), Adar1−/mZα Zbp1−/− Mavs−/− (n = 7). Scale bar, 200 μm.
Extended Data Fig. 5
Extended Data Fig. 5. Comparison of RNA-seq expression profiles in lung tissues from Adar1−/mZαMavsWT/− and control mice.
Comparison of lung RNAseq data from Adar1−/mZα MavsWT/− (n = 5), Adar1WT/mZα (n = 5) and wild type C57BL/6N mice (n = 5) at 15 weeks of age. Heatmap shows 678 genes differentially expressed between Adar1−/mZα MavsWT/− mice and the two control groups combined (p ≤ 0.05, q ≤ 0.05, ≥ 2-fold-change), with 399 of these upregulated in the former (Supplementary Data Table 3). Columns represent individual mice, hierarchically clustered according to differential gene expression. Tables show GO functional annotation of the genes found upregulated and downregulated in this comparison, performed with g:Profiler (https://biit.cs.ut.ee/gprofiler). P values for differential expression analyses were calculated with Qlucore Omics Explorer using two-sided t-tests and with the q value for false discovery rates (FDR) set to 0.05. Calculation of q values was adjusted for multiple hypothesis testing using the Benjamini-Hochberg method. P values for pathway analyses were calculated with g:Profiler using hypergeometric distribution tests and adjusted for multiple hypothesis testing using the g:SCS (set counts and sizes) algorithm, integral to the g:Profiler server (https://biit.cs.ut.ee/gprofiler).
Extended Data Fig. 6
Extended Data Fig. 6. ZBP1 contributes to the early postnatal lethality of Adar1−/−Mavs−/− mice and induces cell death in MAVS-deficient MEFs.
a, Numbers of offspring genotyped at birth from intercrossing Adar1WT/−, Adar1WT/− Zbp1−/−, Adar1WT/− Mavs−/− or Adar1WT/− Zbp1−/− Mavs−/− mice. b, Representative images of Adar1WT/− Mavs−/− Zbp1−/− (n = 6) and Adar1−/− Mavs−/− Zbp1−/− (n = 8) mice at about 15 weeks of age. c, Relative body weight compared to littermate controls in 10-week-old mice with the indicated genotypes. d, RBC counts, HGB and HCT levels in blood of 15–20 week-old mice with the indicated genotypes. In c, d, control mice include littermates with Adar1WT/− or Adar1WT/WT genotypes. Dots represent individual mice, bar graphs show mean ± s.e.m and P values were calculated by two-sided nonparametric Mann-Whitney test. e, Representative H&E-stained sections from the spleen, liver, lung, heart, small intestine and colon of 15–20 week-old Adar1WT/WT Mavs−/− Zbp1−/− (n = 5) and Adar1−/− Mavs−/− Zbp1−/− (n = 5) mice. Black arrows indicate dying epithelial cells in small intestine and colon sections. Scale bars, 200 μm. f, Immunoblot analysis of total lysates from murine embryonic fibroblasts (MEFs) of the indicated genotypes, stimulated with IFNγ (1,000 U ml−1) for 24 h. One representative out of two independent experiments is shown. GAPDH was used as a loading control. g, h, j, Cell death measured by DRAQ7 uptake in MEFs of the indicated genotypes treated with IFNγ (1,000 U ml−1) alone or with combinations of IFNγ (1,000 U ml−1) (24-h pretreatment), cycloheximide (CHX) (1 μg ml−1), QVD-OPh (QVD) (10 μM) and GSK’872 (3 μM). Graph shows mean values from technical triplicates (n = 3), from one representative out of three independent experiments. i, Immunoblot analysis of total lysates from MEFs of the indicated genotypes pre-stimulated with IFNγ (1,000 U ml−1) for 24 h followed by treatment with CHX (1 μg ml−1) for the indicated time points. Data are representative of two independent experiments. GAPDH was used as loading control. For gel source data, see Supplementary Figure 1. Source data
Extended Data Fig. 7
Extended Data Fig. 7. ZBP1 deficiency does not rescue the interferon response and pathology of Trex1−/− mice.
a, Schematic depicting the generation of Trex1−/− mice using CRISPR-Cas9-mediated gene targeting. Two gRNAs were used to delete the single coding exon of the Trex1 gene. DNA sequencing in homozygous mice confirmed the deletion. b, c, Immunoblot analysis of spleen (b) or heart (c) protein lysates from 8–10-week-old mice of the indicated genotypes with the indicated antibodies. α-tubulin and GAPDH were used as loading control. Lanes represent individual mice. One representative of two independent experiments is shown. d, Kaplan-Meier survival plot of mice of the indicated genotypes. Control mice include Trex1WT/ Zbp1−/− and Trex1WT/WT Zbp1−/− mice. e, Graph depicting body weight of 8–10-week-old mice of the indicated genotypes. Males: Trex1−/− Zbp1WT/WT (n = 7), Trex1−/− Zbp1−/− (n = 13), Trex1−/− Zbp1WT/ (n = 11), control (n = 15). Females: Trex1−/− Zbp1WT/WT (n = 9), Trex1−/− Zbp1−/− (n = 8), Trex1−/− Zbp1WT/ (n = 6), control (n = 8). Heart weight relative to body weight: Trex1−/− Zbp1WT/WT (n = 16), Trex1−/− Zbp1−/− (n = 21), Trex1−/− Zbp1WT/ (n = 17), control (n = 22). Spleen weight relative to body weight: Trex1−/− Zbp1WT/WT (n = 15), Trex1−/− Zbp1−/− (n = 18), Trex1−/− Zbp1WT/ (n = 10), control (n = 11). Control mice include Trex1WT/ Zbp1−/− and Trex1WT/WT Zbp1−/− mice. Dots represent individual mice, bar graphs show mean ± s.e.m and P values were calculated by one-way ANOVA test with Tukey’s correction for multiple comparison. f, Representative images of heart sections of 8–10-week-old Trex1−/− Zbp1WT/WT (n = 7), Trex1−/− Zbp1−/− (n = 8), Trex1WT/ Zbp1−/− (n = 5) and Trex1WT/WT Zbp1−/− (n = 5) mice stained with H&E or Masson’s Trichrome (collagen: blue, cytoplasm: red) or immunostained for CD45, CD3 or F4/80. Scale bars: 500 µm for H&E, CD45 and Masson’s Trichrome staining; 100 µm for CD3 and F4/80 staining. g, h, qRT-PCR analysis of mRNA expression of the indicated genes in heart tissues of 8–10-week-old mice of the indicated genotypes. Dots represent individual mice, bar graphs show mean ± s.e.m and P values were calculated by a Kruskal-Wallis test with Dunn’s multiple comparison. For gel source data, see Supplementary Figure 1. Source data
Extended Data Fig. 8
Extended Data Fig. 8. RNA editing analysis in spleen RNA from Adar1WT/mZα, Adar1mZα/mZα, Adar1−/mZα and Adar1−/mZαZbp1−/− mice.
a, Normalised number of edits passing the statistical filters described in the Methods section, split according to the base substitution recorded, showing enrichment of the A > G editing profile associated with deamination of adenine. b, Violin plots of the per-site editing percentage for sites with detected editing. Solid horizontal lines show the median and dotted lines indicate quartiles. c, Edited sites detected in Adar1WT/mZα mice, for reference, and the differential edits determined for the indicated comparisons were matched to annotated genomic features. The percentage of sites is shown for each category. d, Number of expected and observed editing sites in Adar1WT/mZα mice are shown for families of repetitive elements for which either value exceeded 100. e, Number of expected and observed editing sites in Adar1WT/mZα mice are shown for individual SINE families for which either value exceeded 100. f, Fold enrichment (observed/expected) for the SINE families shown in (e), showing detected edits within Adar1WT/mZα mice, for reference, and differential edits within the indicated comparisons. Source data
Extended Data Fig. 9
Extended Data Fig. 9. ZBP1 Zα domain mutation reduces ISG expression in mice expressing ADAR1 with mutated Zα domain and promotes survival to adulthood in Adar1−/mZα mice.
a, qRT-PCR analysis of mRNA expression of the indicated genes in spleen, lung and liver tissues from P1 mice with the indicated genotypes. b, Representative images of mice of the indicated genotypes at about 15 weeks of age. c, Representative H&E-stained sections from spleen, liver, lung, heart, small intestine and colon of mice with the indicated genotypes at 15 weeks old. Scale bar, 200 μm. Periportal and pericentral areas in liver sections are marked with P and *, respectively. Pericentral sinusoidal dilatation in Adar1−/mZα Zbp1mZα/mZα liver section is outlined with a dashed line. Black arrows indicate dying epithelial cells in small intestine and colon sections. d, qRT-PCR analysis of mRNA expression of the indicated genes in lung tissues from 20-week-old mice with the indicated genotypes. In b, c, Adar1WT/mZα Zbp1mZα/mZα (n = 5), Adar1/mZα Zbp1mZα/mZα (n = 8). In a, d, dots represent individual mice, bar graphs show mean ± s.e.m and P values were calculated by two-sided nonparametric Mann-Whitney test. Source data
Extended Data Fig. 10
Extended Data Fig. 10. RIPK3 deficiency does not suppress ISG expression in Adar1−/mZα mice.
qRT-PCR analysis of mRNA expression of the indicated genes in spleen, lung and liver tissues from P1 mice with the indicated genotypes. Dots represent individual mice, bar graphs show mean ± s.e.m and P values were calculated by two-sided nonparametric Mann-Whitney test. Source data

Comment in

References

    1. Song B, Shiromoto Y, Minakuchi M, Nishikura K. The role of RNA editing enzyme ADAR1 in human disease. Wiley Interdiscip. Rev. RNA. 2022;13:e1665. doi: 10.1002/wrna.1665. - DOI - PMC - PubMed
    1. Rice GI, et al. Mutations in ADAR1 cause Aicardi–Goutieres syndrome associated with a type I interferon signature. Nat. Genet. 2012;44:1243–1248. doi: 10.1038/ng.2414. - DOI - PMC - PubMed
    1. Livingston JH, et al. A type I interferon signature identifies bilateral striatal necrosis due to mutations in ADAR1. J. Med. Genet. 2014;51:76–82. doi: 10.1136/jmedgenet-2013-102038. - DOI - PubMed
    1. Placido D, Brown BA, 2nd, Lowenhaupt K, Rich A, Athanasiadis A. A left-handed RNA double helix bound by the Zα domain of the RNA-editing enzyme ADAR1. Structure. 2007;15:395–404. doi: 10.1016/j.str.2007.03.001. - DOI - PMC - PubMed
    1. Herbert A, et al. A Z-DNA binding domain present in the human editing enzyme, double-stranded RNA adenosine deaminase. Proc. Natl Acad. Sci. USA. 1997;94:8421–8426. doi: 10.1073/pnas.94.16.8421. - DOI - PMC - PubMed