. 2022 Jul;607(7920):769-775.
doi: 10.1038/s41586-022-04896-7. Epub 2022 Jul 20.

ADAR1 mutation causes ZBP1-dependent immunopathology

Affiliations

ADAR1 mutation causes ZBP1-dependent immunopathology

Nicholas W Hubbard et al. Nature. 2022 Jul.

Abstract

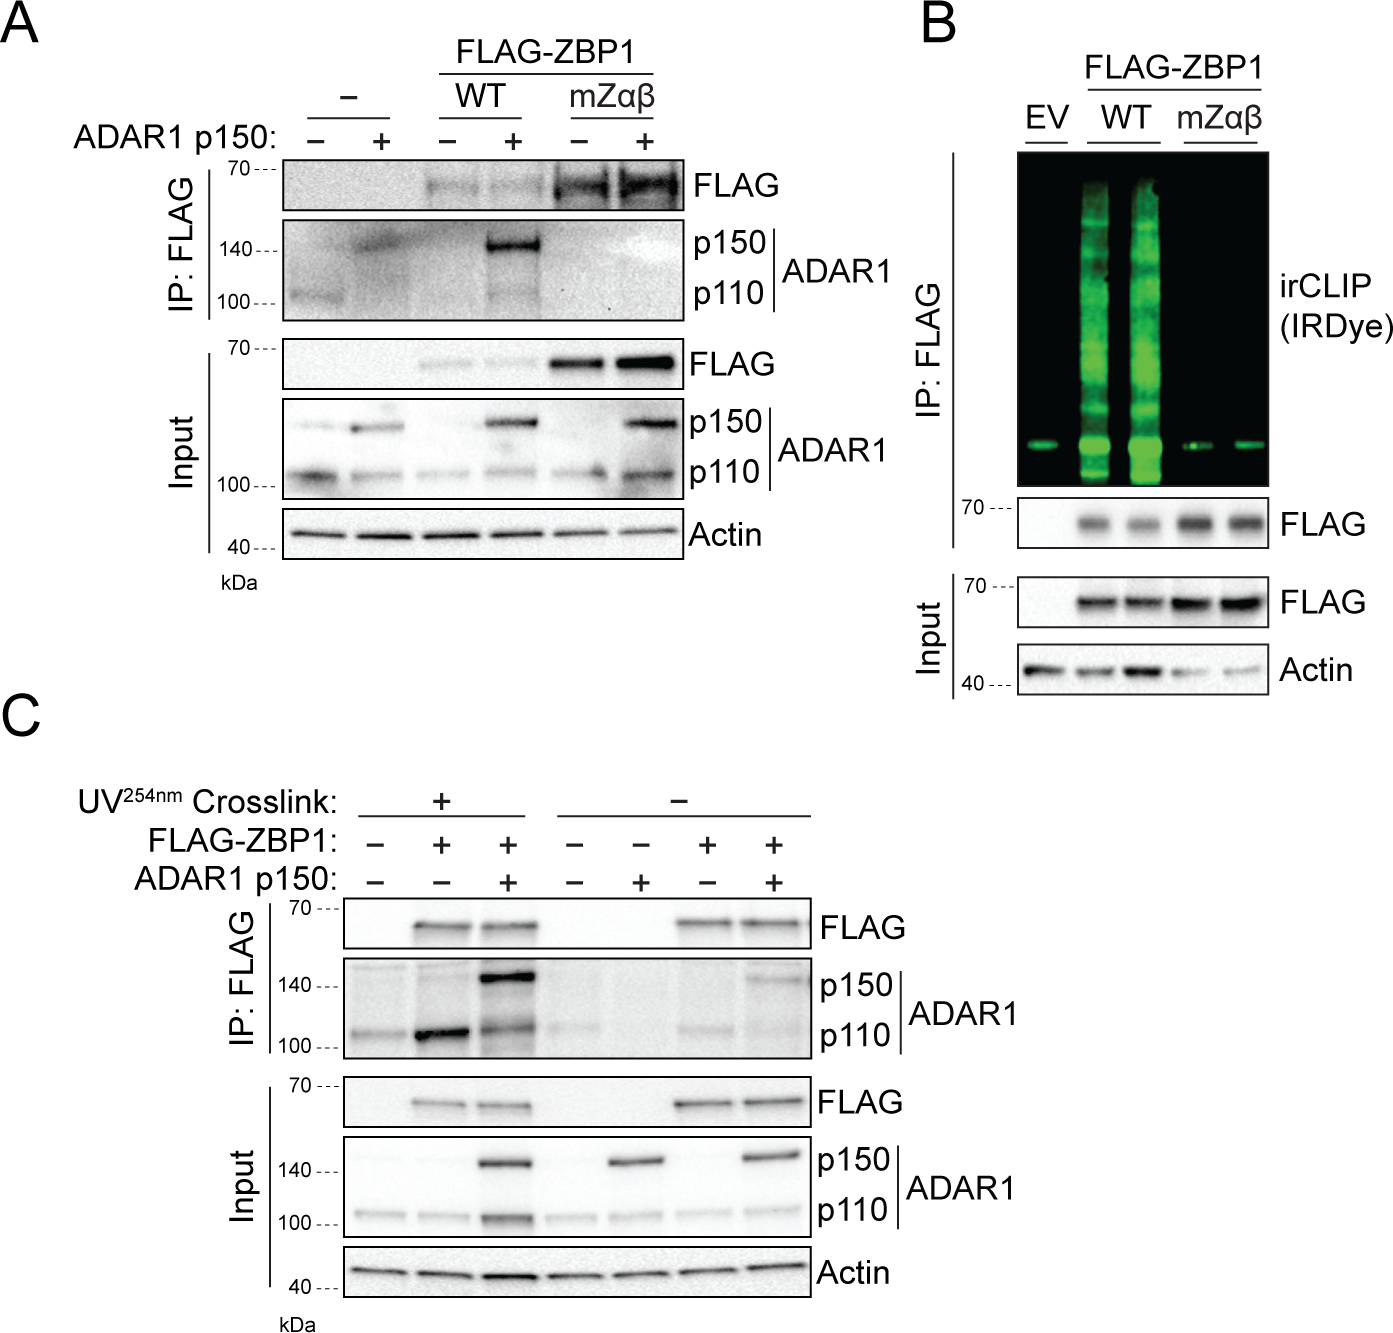
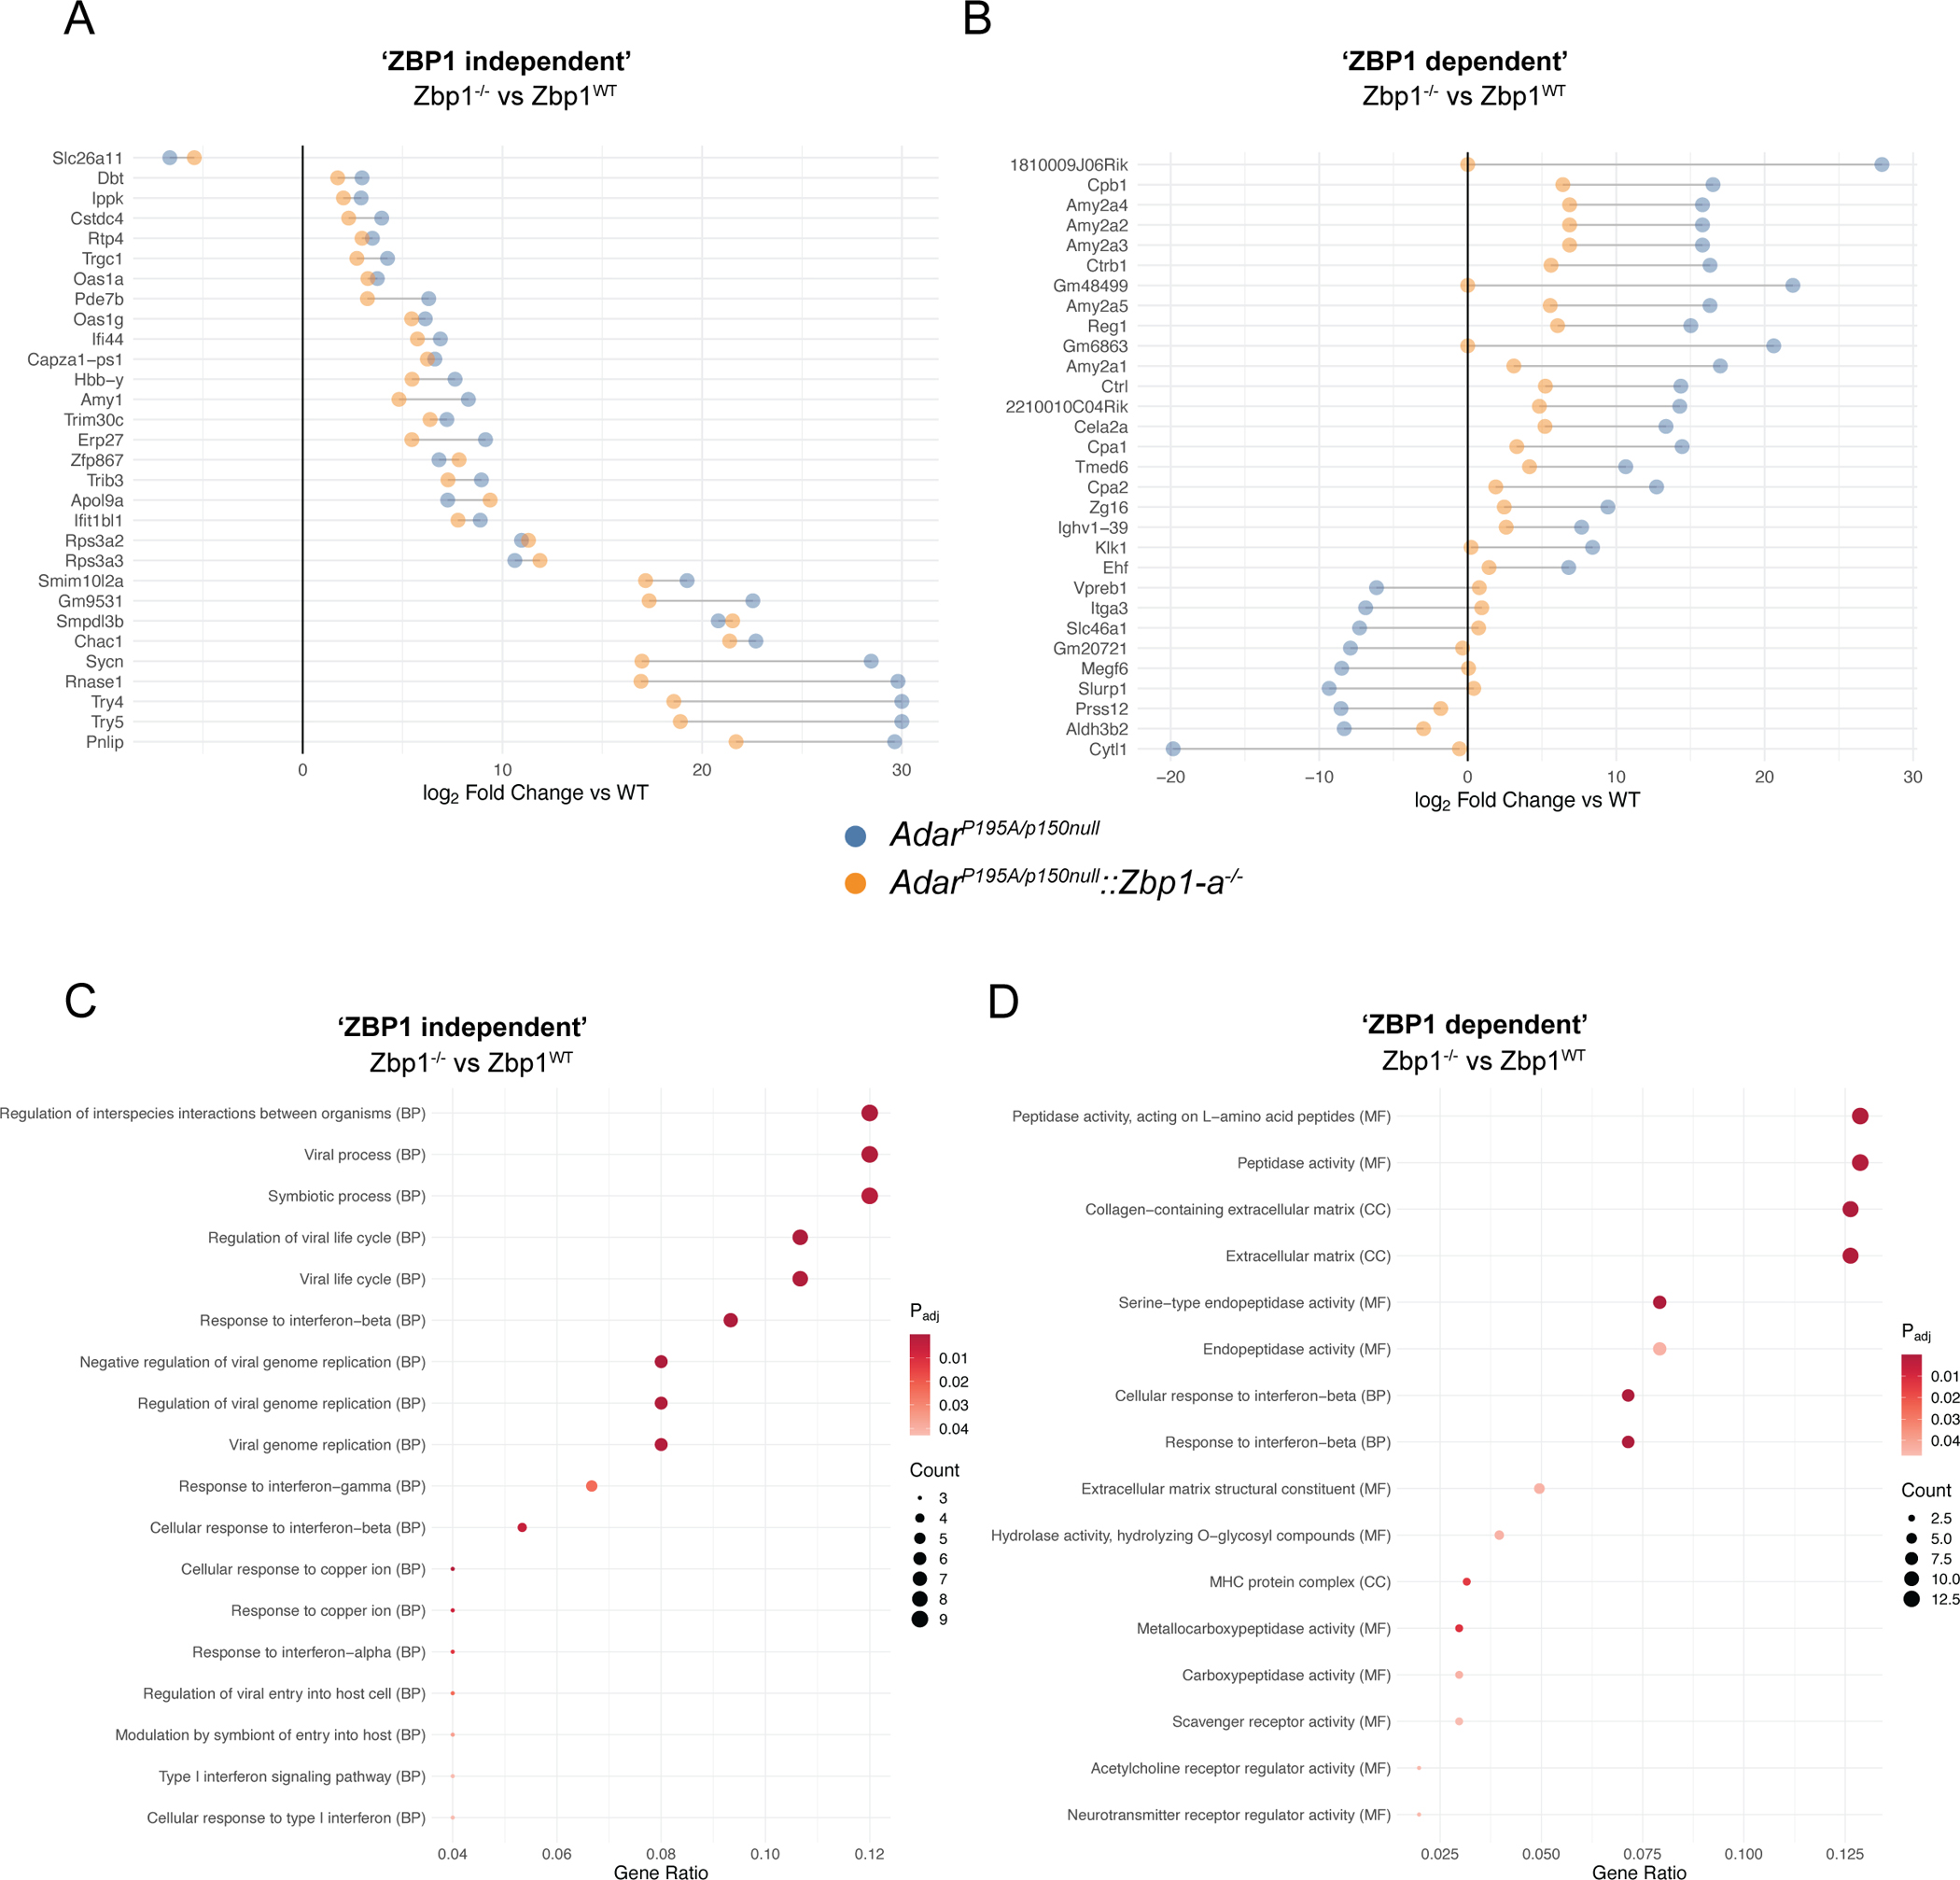
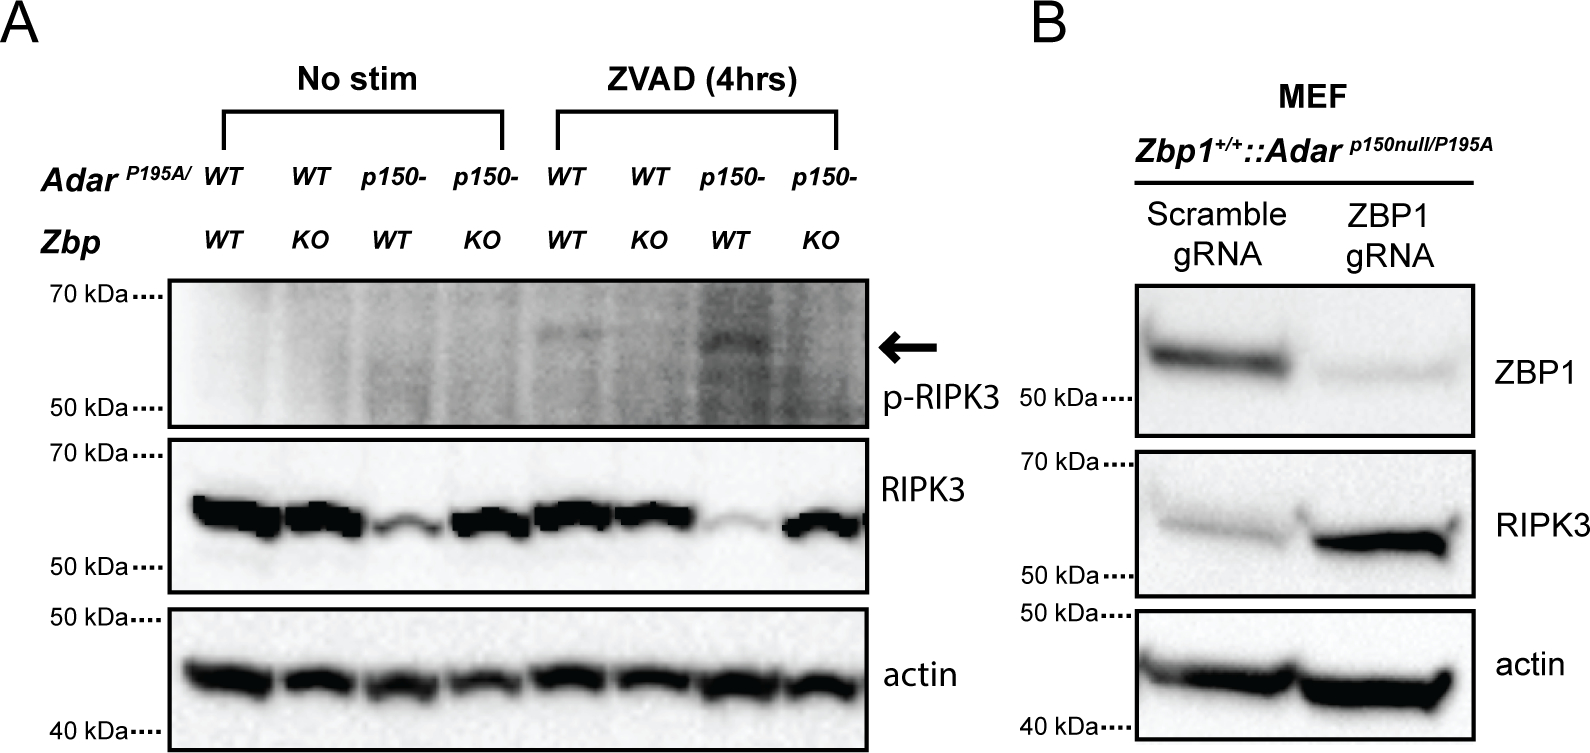
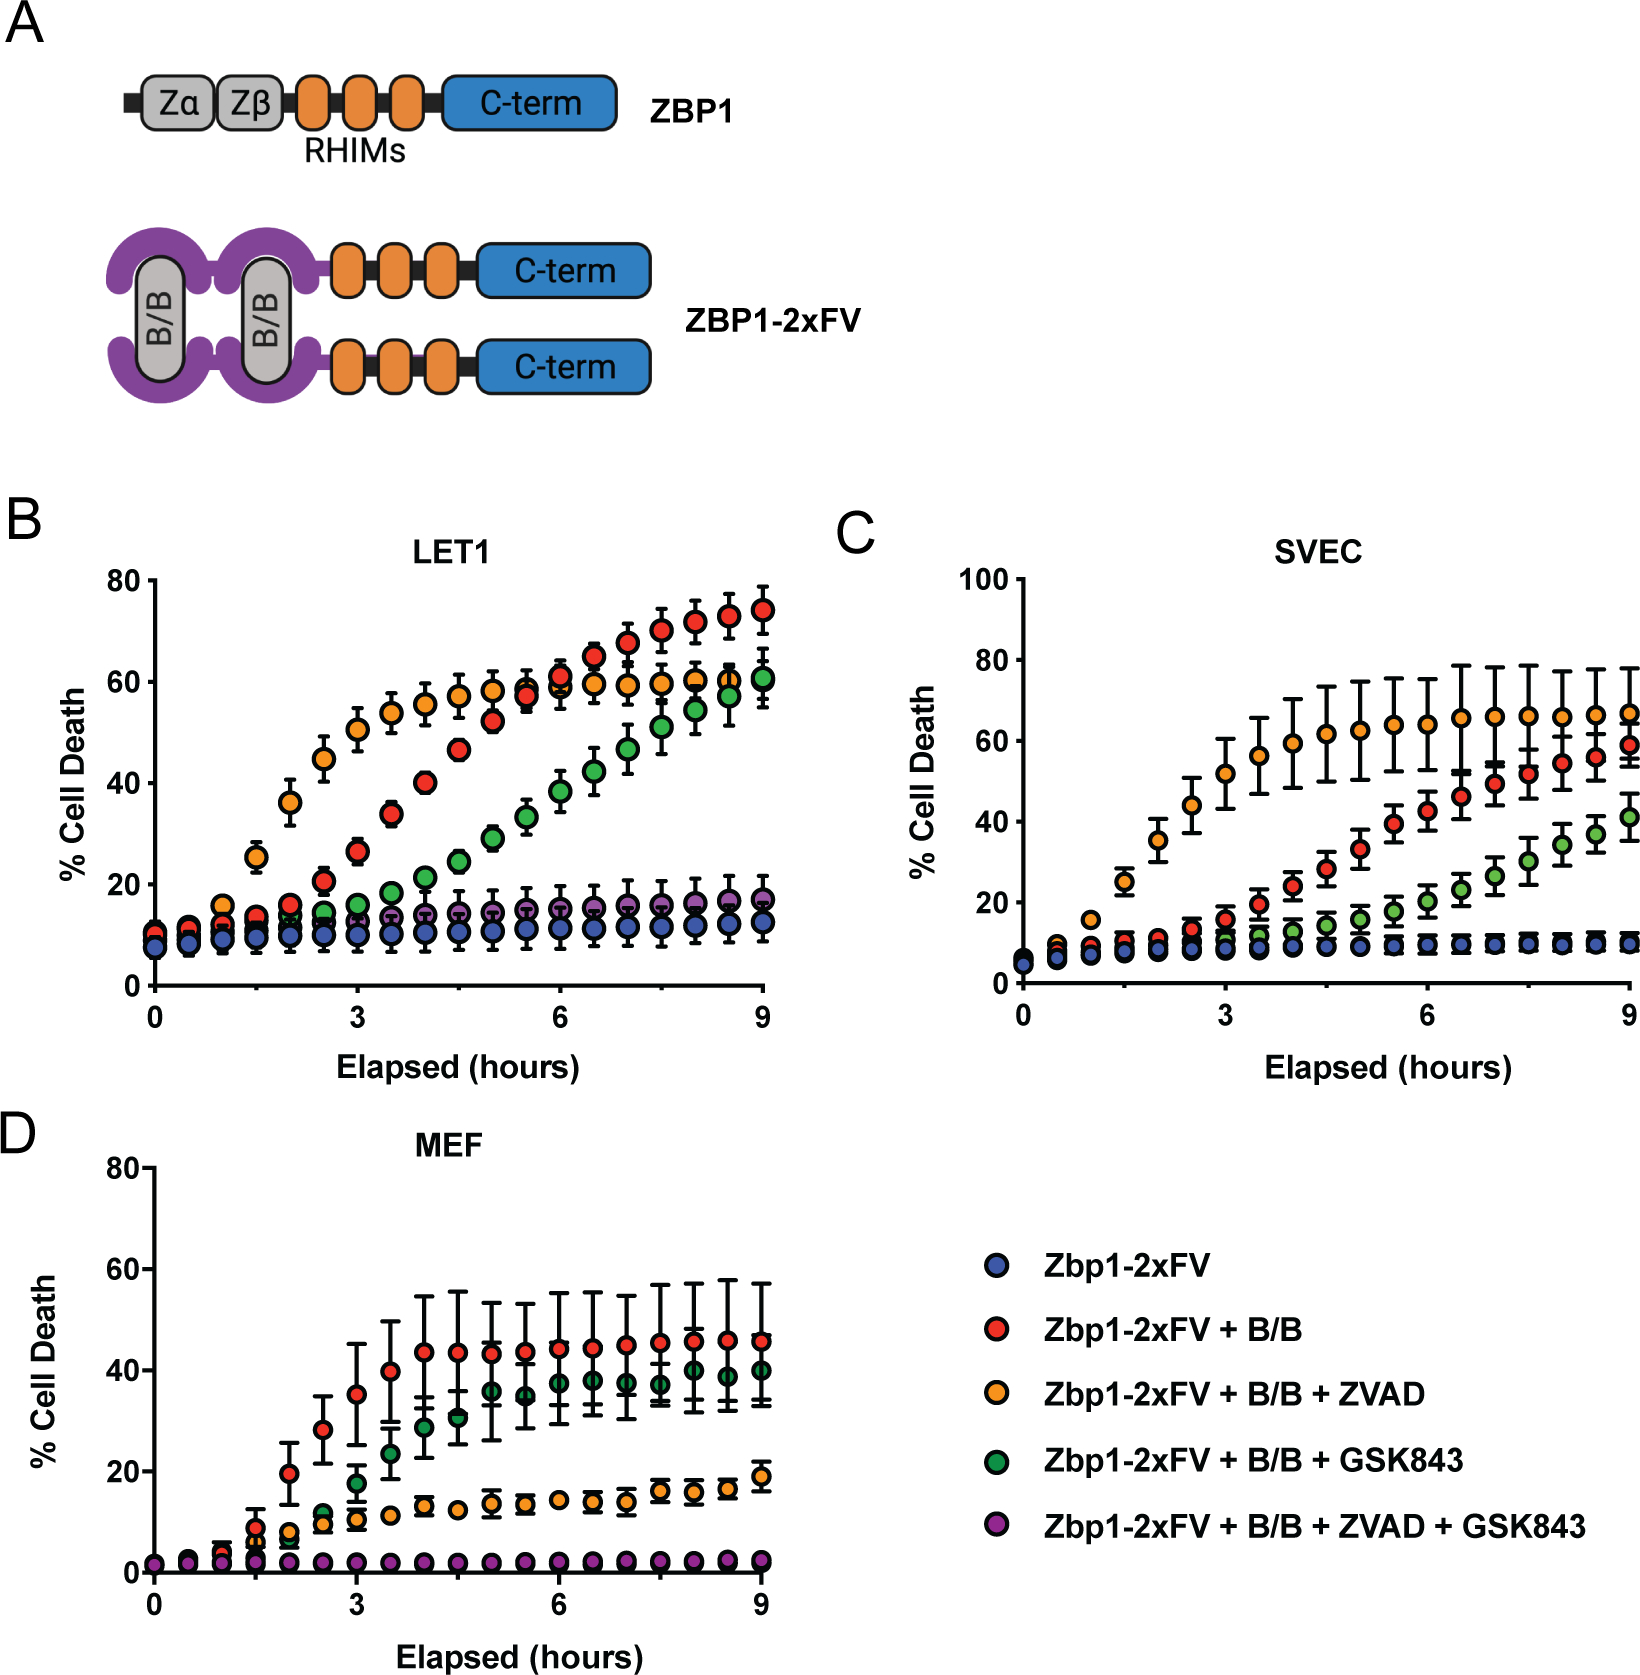
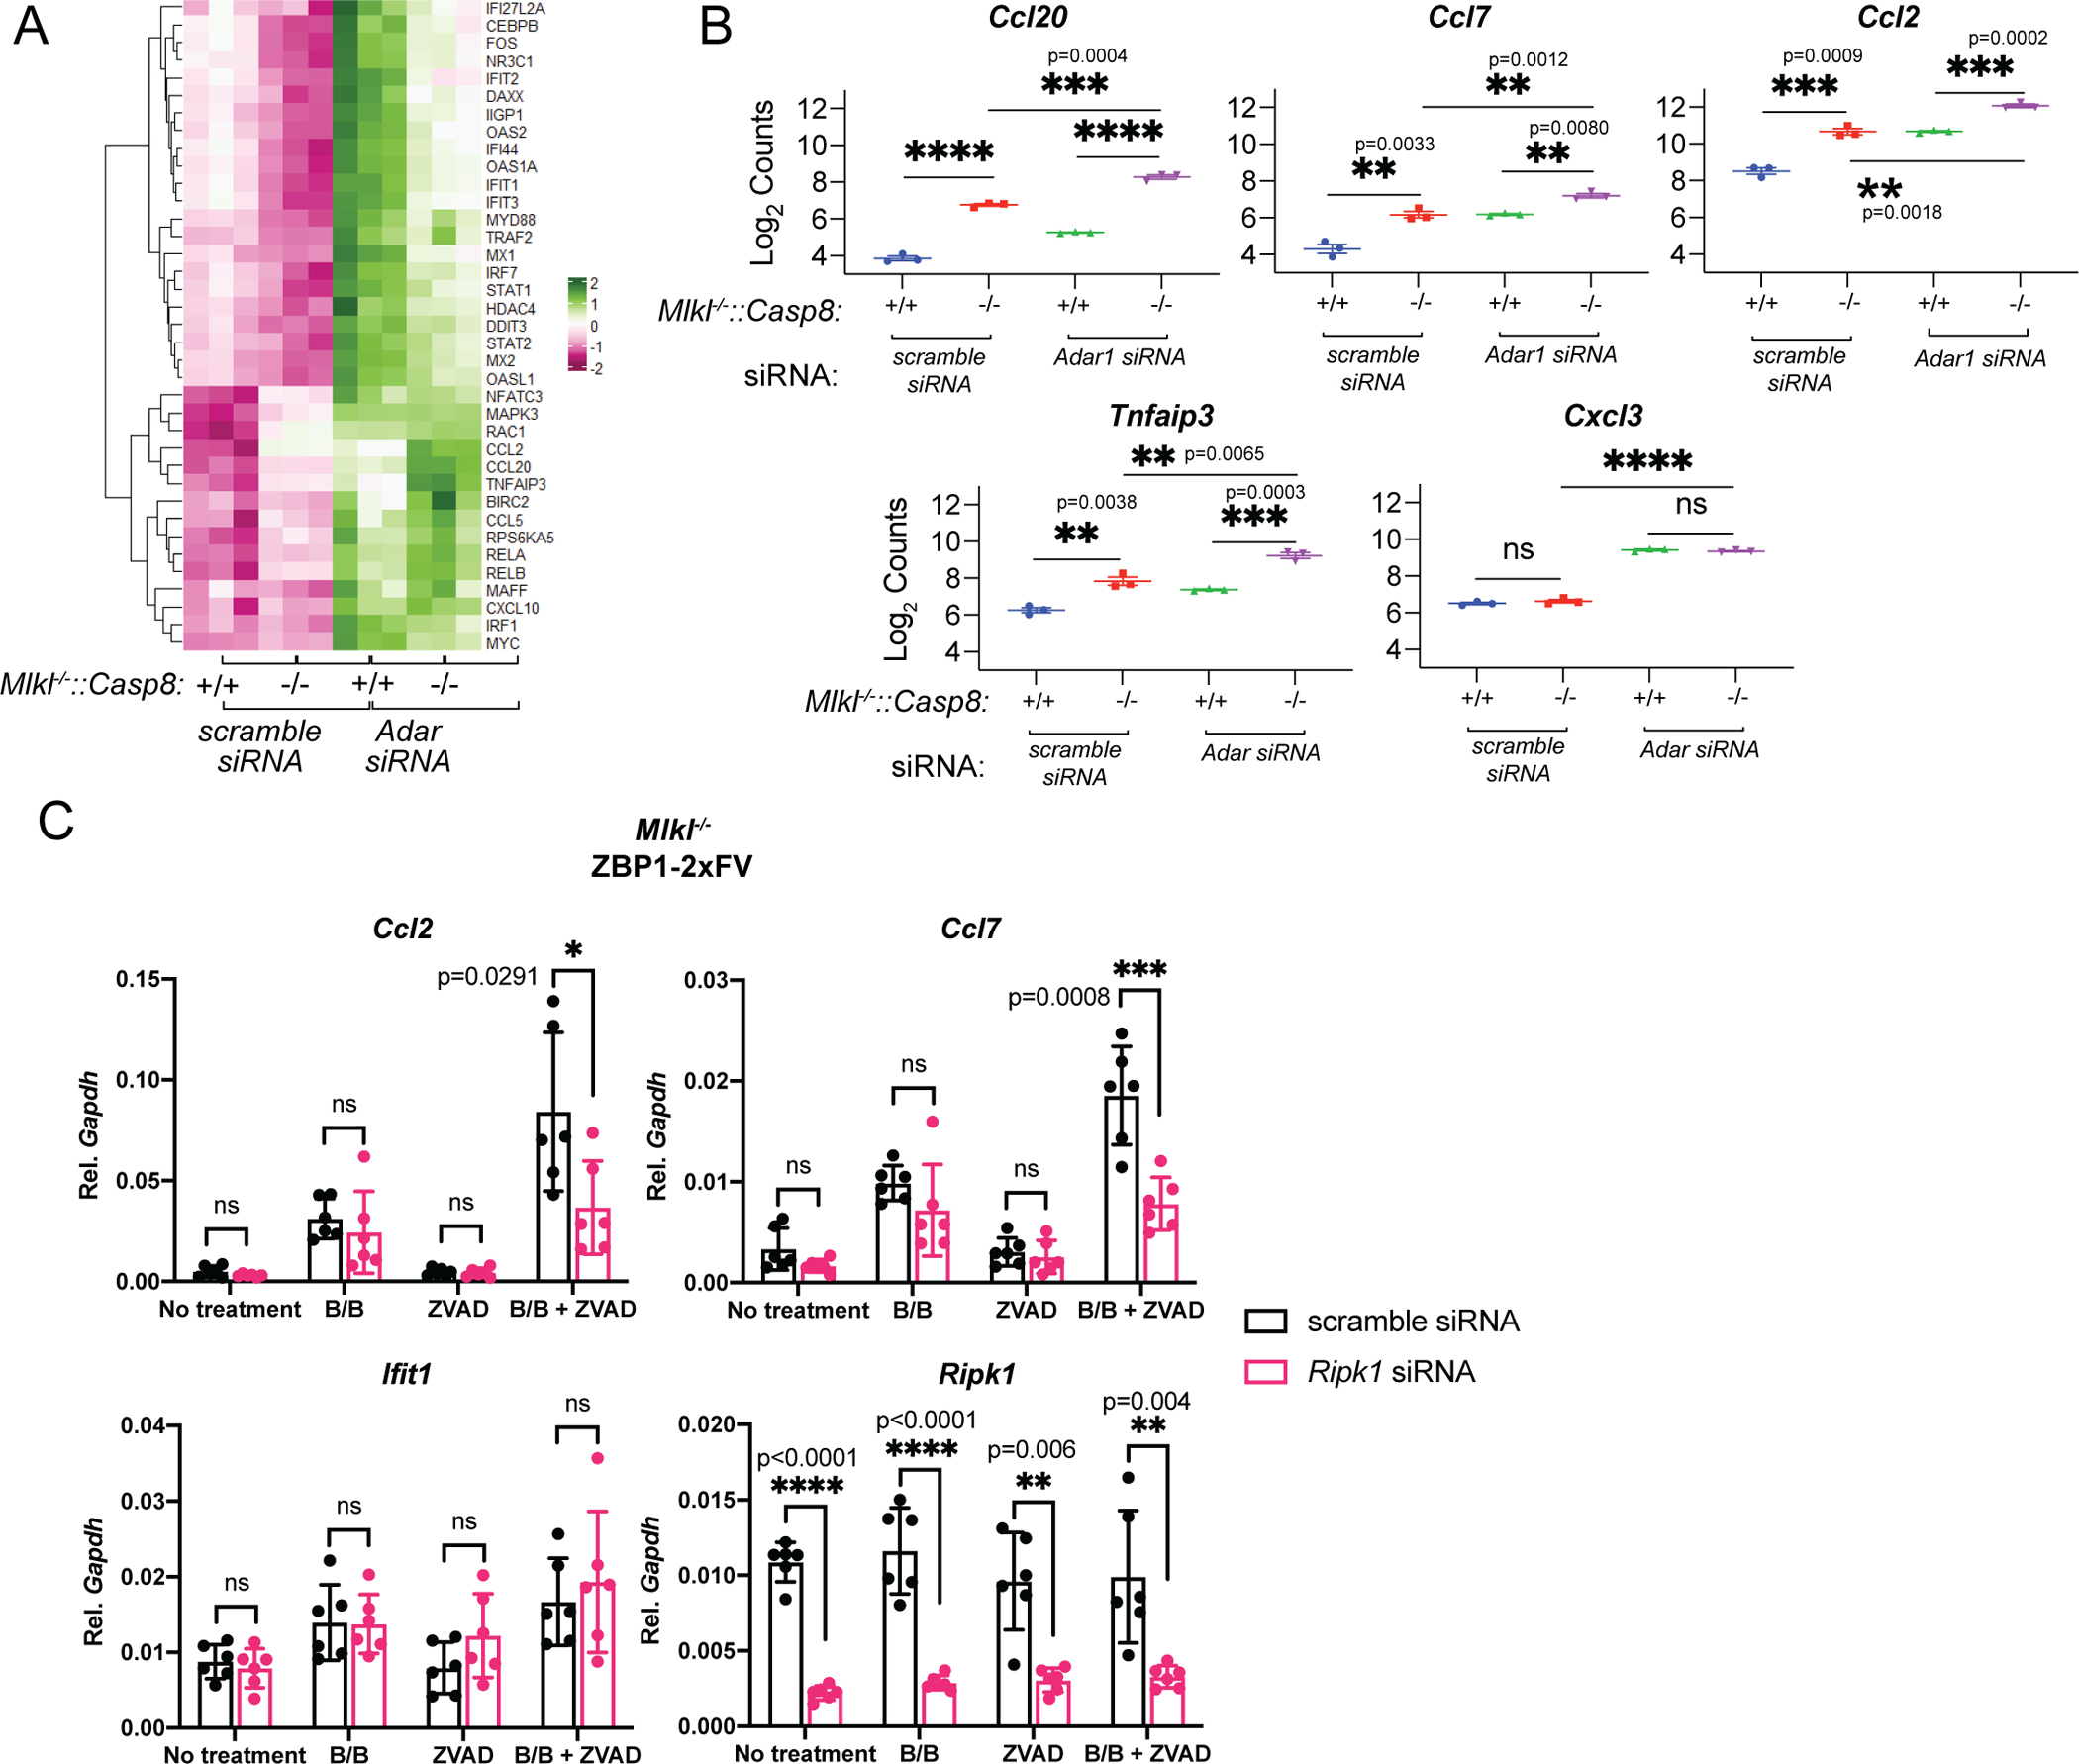
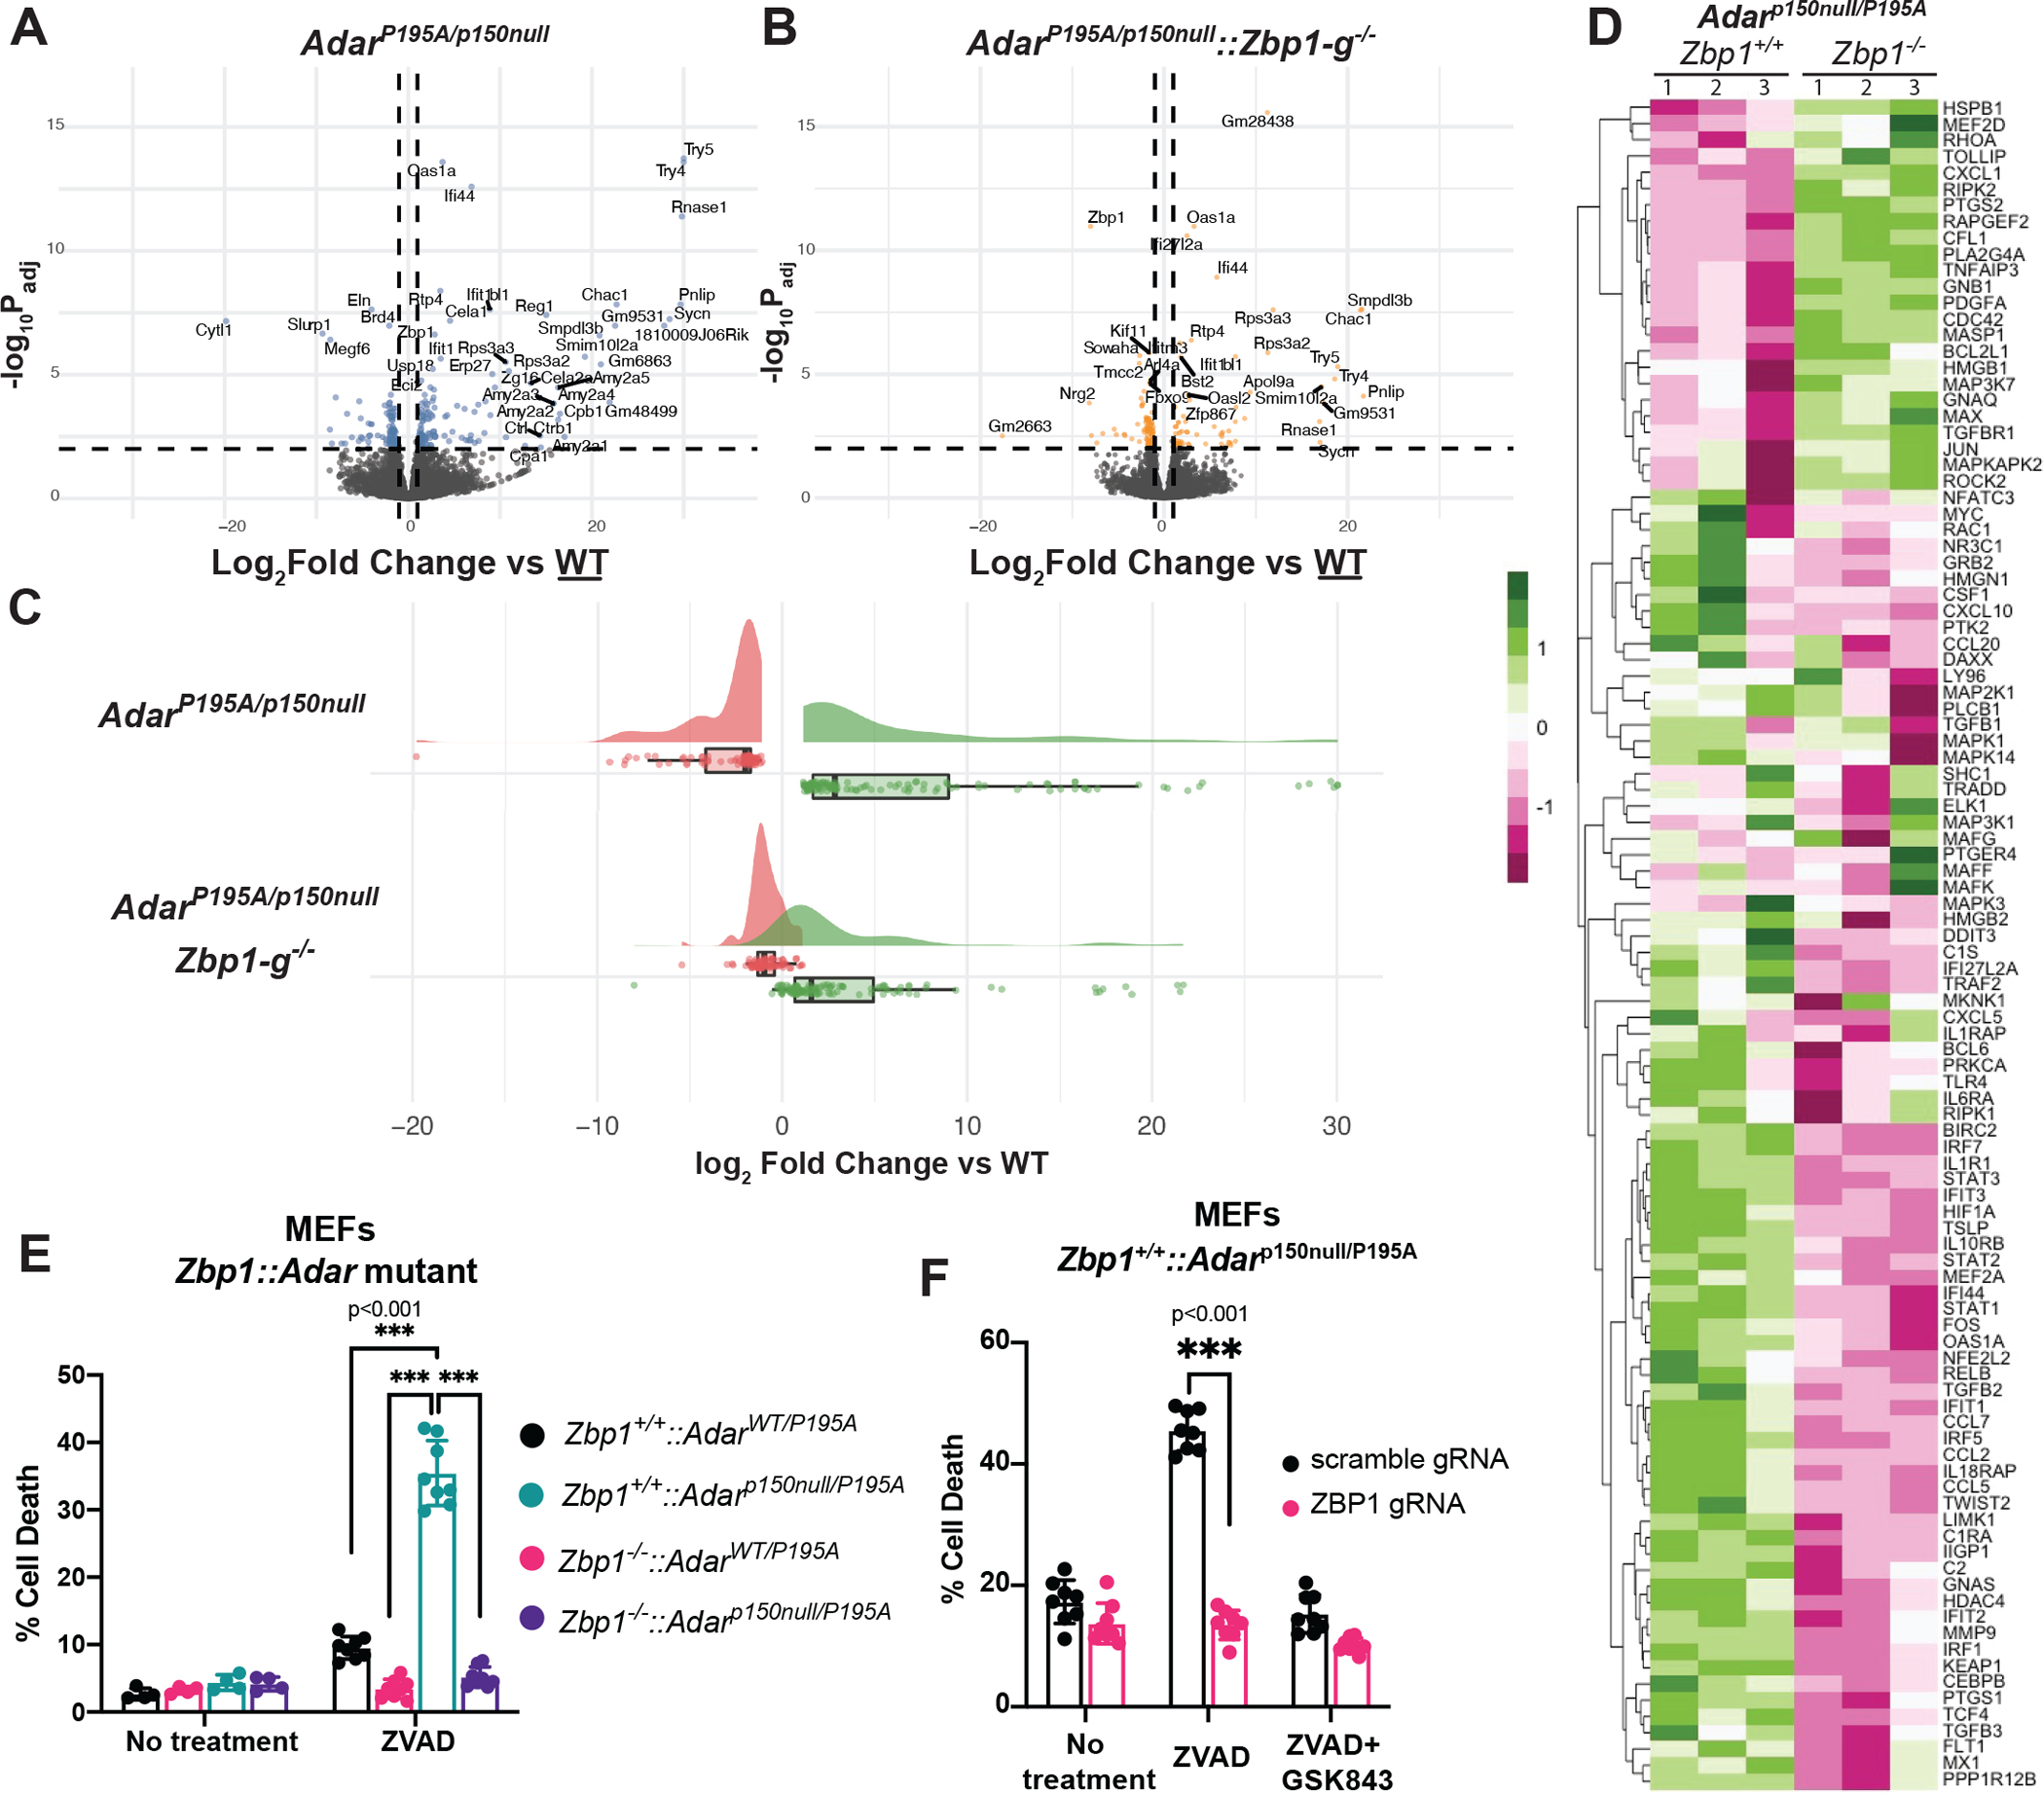
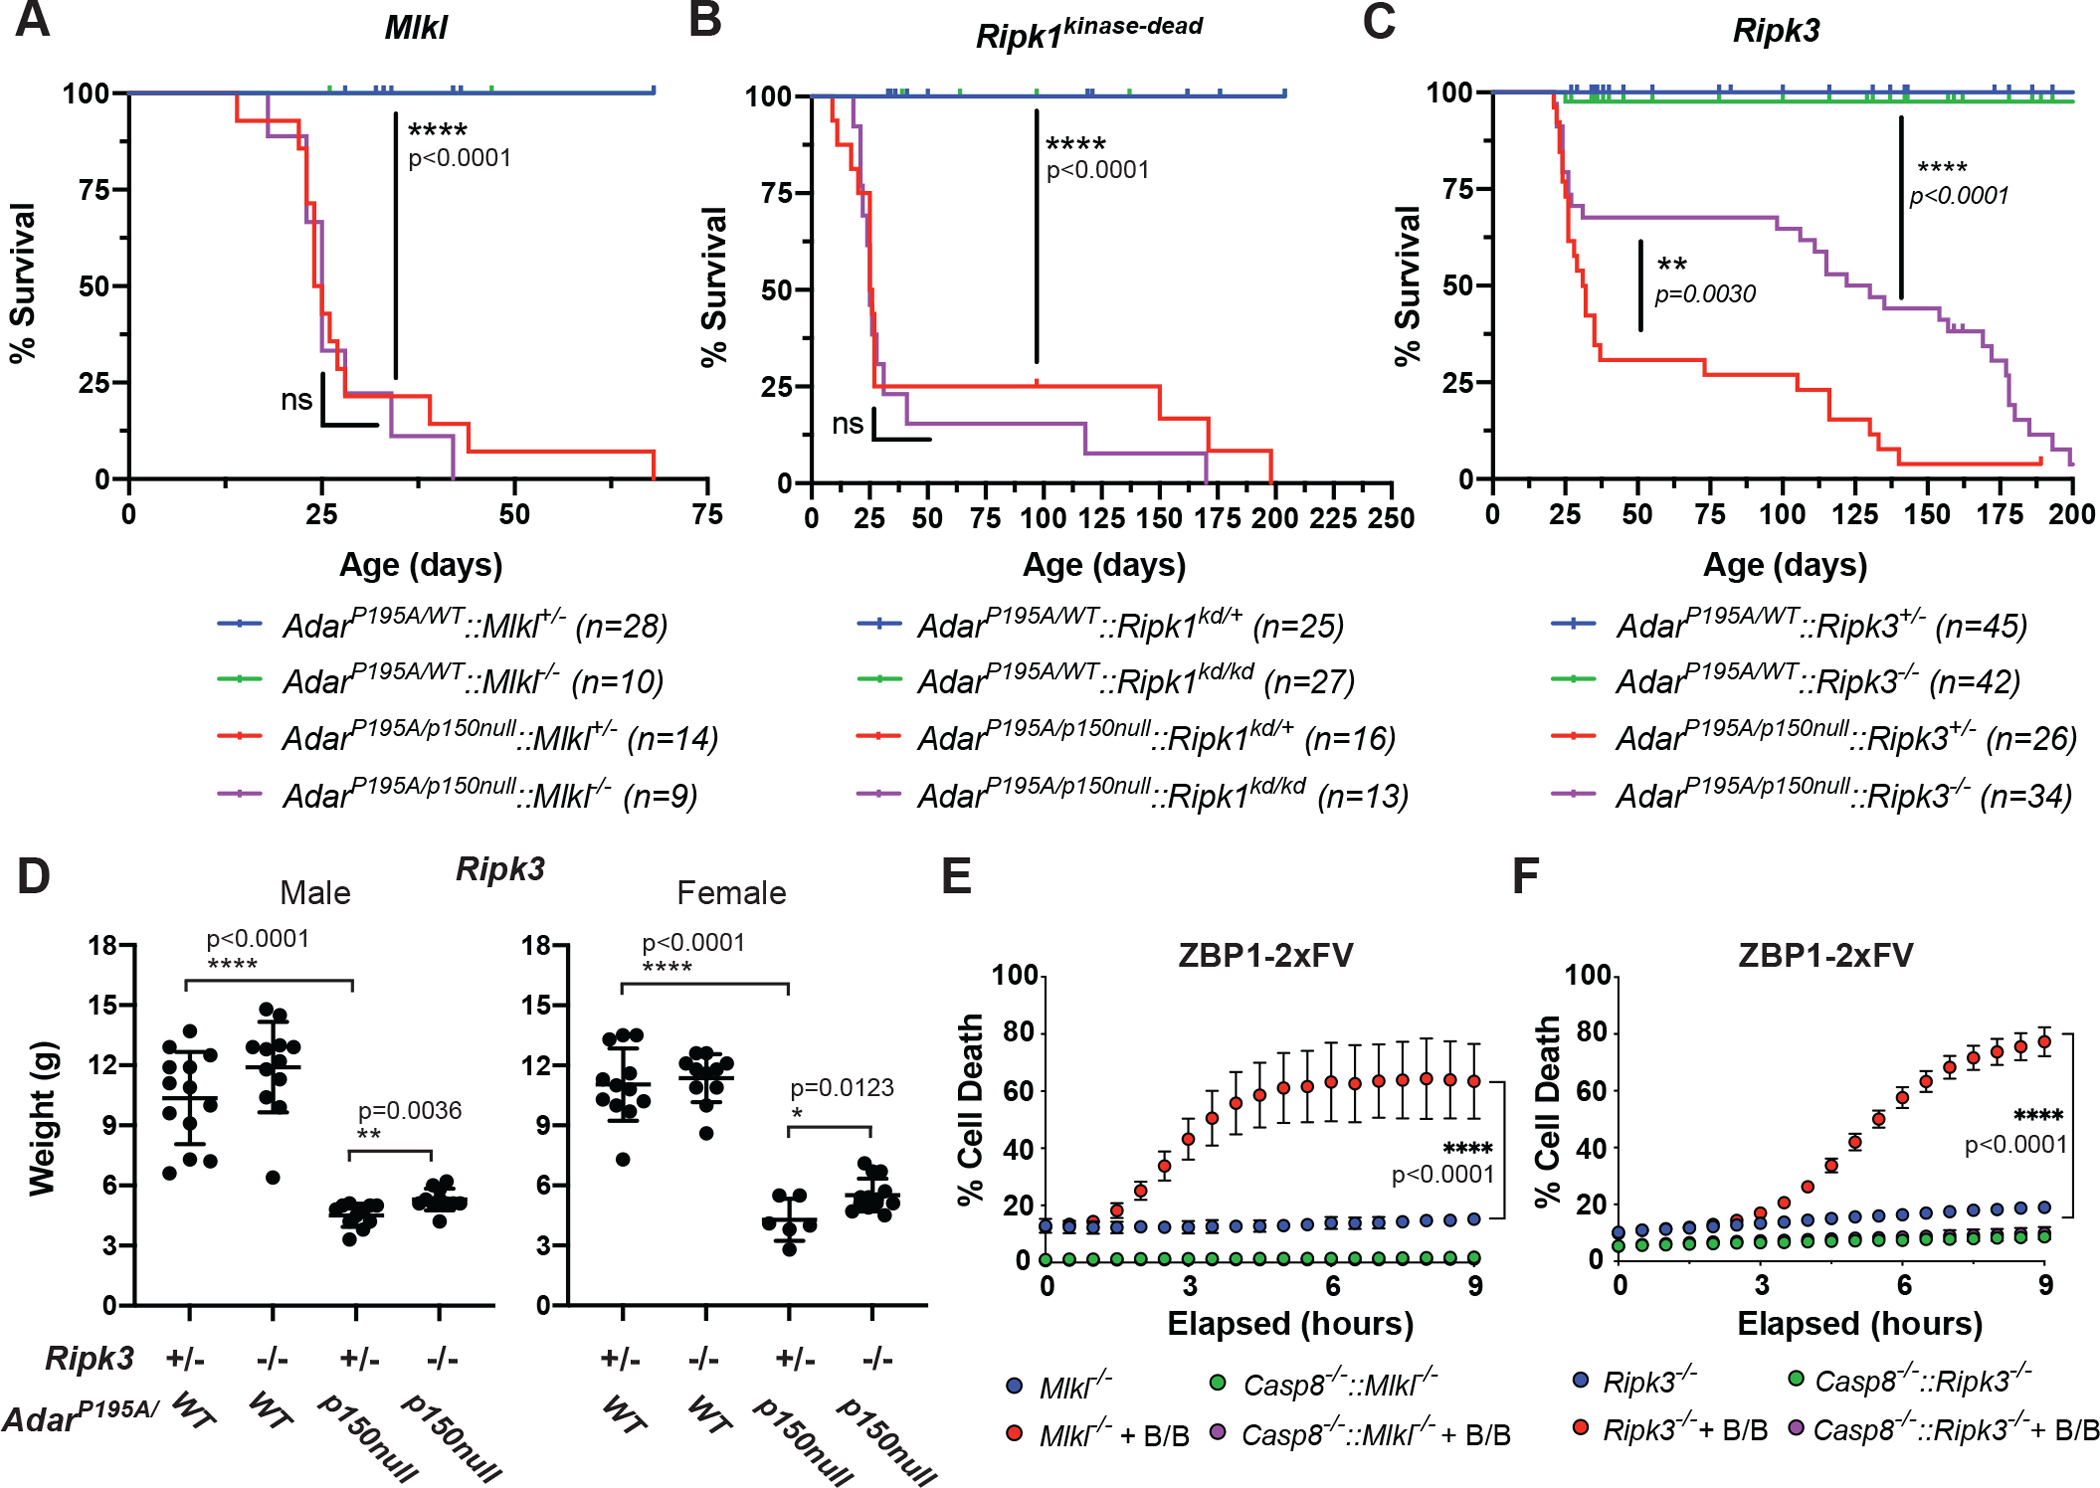
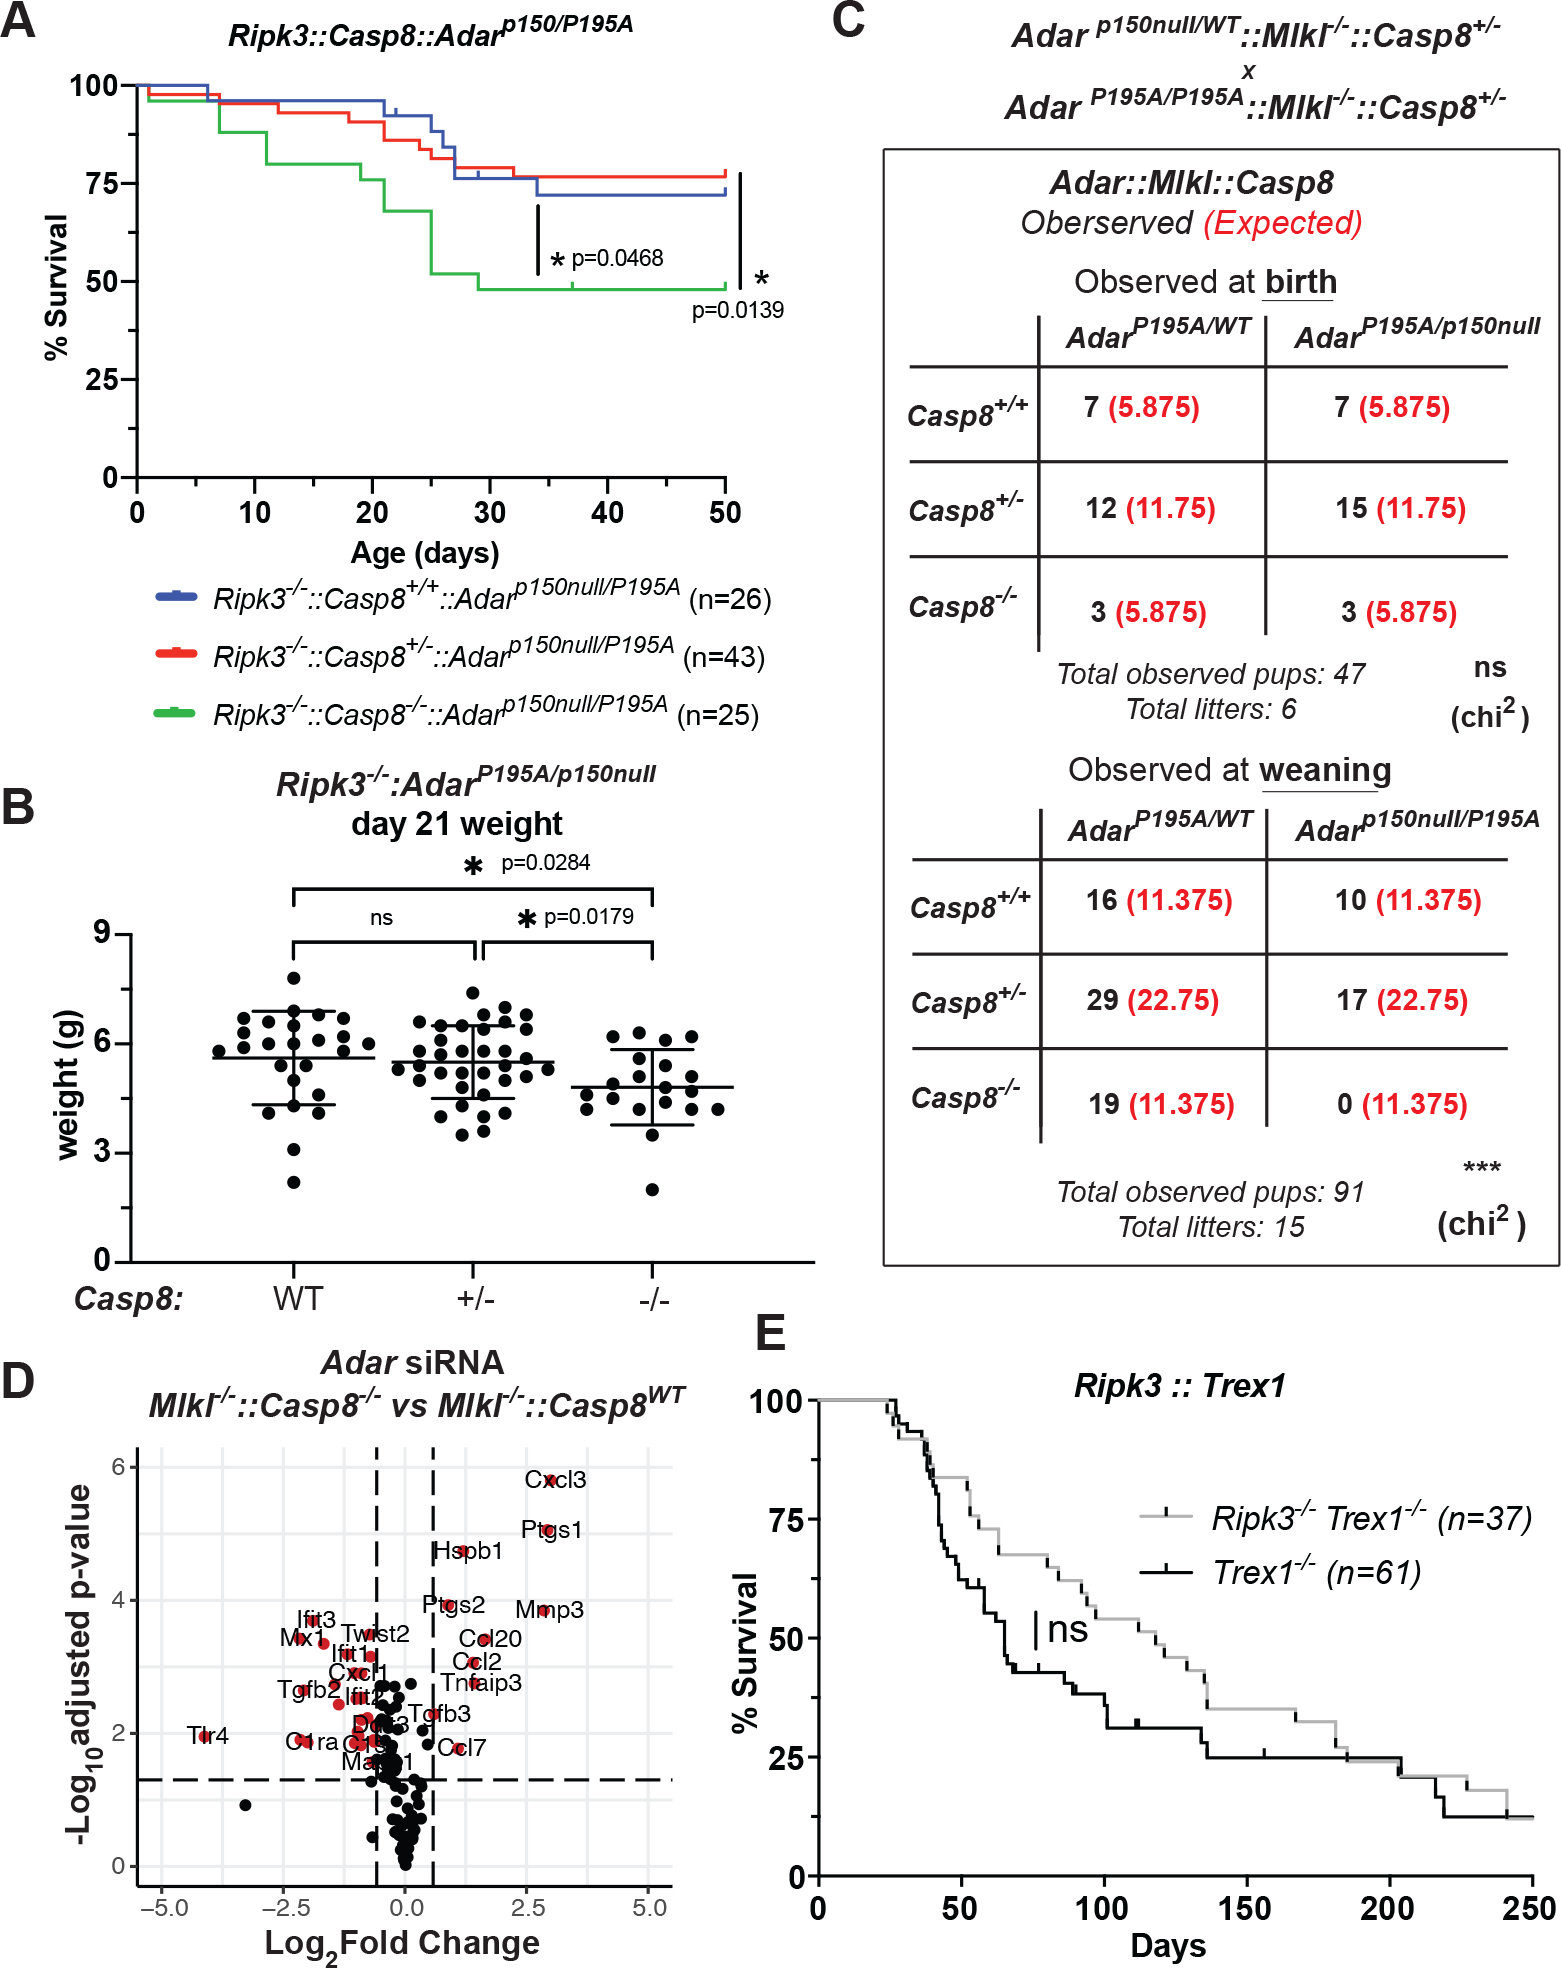
The RNA-editing enzyme ADAR1 is essential for the suppression of innate immune activation and pathology caused by aberrant recognition of self-RNA, a role it carries out by disrupting the duplex structure of endogenous double-stranded RNA species1,2. A point mutation in the sequence encoding the Z-DNA-binding domain (ZBD) of ADAR1 is associated with severe autoinflammatory disease3-5. ZBP1 is the only other ZBD-containing mammalian protein6, and its activation can trigger both cell death and transcriptional responses through the kinases RIPK1 and RIPK3, and the protease caspase 8 (refs. 7-9). Here we show that the pathology caused by alteration of the ZBD of ADAR1 is driven by activation of ZBP1. We found that ablation of ZBP1 fully rescued the overt pathology caused by ADAR1 alteration, without fully reversing the underlying inflammatory program caused by this alteration. Whereas loss of RIPK3 partially phenocopied the protective effects of ZBP1 ablation, combined deletion of caspase 8 and RIPK3, or of caspase 8 and MLKL, unexpectedly exacerbated the pathogenic effects of ADAR1 alteration. These findings indicate that ADAR1 is a negative regulator of sterile ZBP1 activation, and that ZBP1-dependent signalling underlies the autoinflammatory pathology caused by alteration of ADAR1.


Conflict of interest statement

Competing interests

DBS is a co-founder and shareholder of Danger Bio, LLC, and a scientific advisor for Related Sciences LLC. AO is a co-founder and shareholder of Walking Fish Therapeutics.

Figures

Extended Data 1:
Extended Data 1:. Interaction of ZBP1 with RNA and ADAR1.
A. Co-precipitation ADAR1 with WT or mutant Zαβ (mZαβ) Flag-tagged ZBP1 (FLAG-ZBP1) after FLAG immunoprecipitation. Β. Immunoprecipitation and IR-CLIP analysis for RNA binding by of WT or mZαβ FLAG-ZBP1. C. Co-precipitation of ADAR1 and FLAG-tagged ZBP1 after UV-crosslinking. These experiments were performed in HEK293T cells.
Extended Data 2:
Extended Data 2:. Immunopathology in ADAR-mutant mice is ZBP1 dependent.
Survival proportions observed upon cross of Adarp150null/WT::Zbp1-a+/− mice to AdarP195A/P195A::Zbp1-+/−, **** p<0.0001 (Mantel-Cox Log-Rank test) (A) or Adarp150null/WT::Zbp1-a−/− mice to AdarP195A/P195A::Zbp1-a−/−, not significant (Mantel-Cox Log-Rank test) (B). (C) Histopathological analysis of liver and kidney from affected, rescued and unaffected mice (genotypes indicated.) For liver samples, regions of cytoplasmic vacuolation indicated with asterisk. Original magnification 20x, HE staining. For kidney, glomeruli are indicated with arrows, from original magnification 40x HE staining.
Extended Data 3:
Extended Data 3:. Cross of AdarP195A/p150null mice to a separately derived, fully congenic Zbp1−/−-g strain.
A-B. SNP typing analysis of ZBP1-g (A) and ZBP1-a (B) mice. C-D. Zbp1−/−-g::AdarP195A/p150null survival proportions(C) and observed weight (D) at 21 days (weaning). Combined male & female, Zbp1+/+::AdarP195A/WT (n=17), Zbp1+/−::AdarP195A/WT (n=21), Zbp1−/−::AdarP195A/WT (n=10), Zbp1+/+::AdarP195A/p150null (n=9), Zbp1+/−::AdarP195A/WT (n=25), Zbp1−/−::AdarP195A/WT (n=7).
Extended Data 4:
Extended Data 4:. ZBP1 is IFN dependent and partially dependent on MDA5.
A. Twelve-hour stimulation of LET1 and SVEC cells with varying concentrations of IFN-β followed by Western Blot analysis for ZBP1 protein. B. Quantitative PCR analysis for Zbp1 and Ifnb after ADAR1 depletion in wild-type (scramble gRNA) or MDA5 knockout LET1. Gene was normalized against Gapdh. Significance determined by individual student t-tests. Each group (Zbp and Ifnb) contains 3 biologic replicates, each comprising the average of 4 technical replicates). This experiment is representative of two independent repeats. Whisker bars are presented as mean +/− SD. C. Survival of Zbp1−/−::MDA5−/−::ADARp150null/p150null mice. Zbp1-a+/+::Ifih1−/−::Adarp150null/+ n=6, Zbp1-a+/+::Ifih1−/−::Adarp150null/p150null n=4, Zbp1-a−/−::Ifih1−/−::Adarp150null/+ n=5, Zbp1-a−/−::Ifih1−/−::Adarp150null/p150null n=3. Statistical significance determined by Mantel-Cox (Log-Rank) test. D. Survival proportions of Zbp1−/−-a::Adarp150/WT intercross. Chi square power analysis performed, indicating significance at p=1.82×10⁻⁵.
Extended Data 5:
Extended Data 5:. Identification of ZBP1 dependent and independent aspects of the ADAR1 inflammatory signature.
A-B: Cleveland plots indicating changes in the ADAR1 dependent gene signature observed in the spleens of 23 day old mice, indicating most- (A) and least- (B) changed genes upon ZBP1 ablation in AdarP195A/p150null mice. Gene selection is the top 30 largest contributors to the ZBP1 dependent (A) and independent (B) signature from ADARP195A/p150null mice, in comparison to WT mice. Gene Ontology analysis was performed on the signatures from A and B. C-D: GO-terms analysis for ZBP1-independent signature (C), and the ZBP1 dependent signature analysis (D).
Extended Data 6:
Extended Data 6:. Flow cytometry analysis of splenic cellular subsets.
B cell, T cell, monocyte, macrophage percentages from day 23 spleens of Zbp1::Adarp150/P195A mice.
Extended Data 7:
Extended Data 7:. ZVAD treatment induces phosphorylation of RIPK3 in ADAR mutant MEFs in a ZBP1 dependent fashion.
A. Analysis of phospho-RIPK3 in ADAR1 mutant MEFs after 4 hour ZVAD treatment. B. Confirmation of ZBP1 gRNA knockout in ADAR1 mutant MEFs.
Extended Data 8:
Extended Data 8:. MLKL or RIPK1kinase dead mutations do not rescue ADARP195A/p150null mutation.
Three-week-old weights (weaning) of male or female AdarP195A/p150null mice crossed to animals lacking, A: MLKL. Mlkl+/−::AdarP195A/WT (m/f n=9/7), Mlkl+/−::AdarP195A/p150null (m/f n=8/2), Mlkl−/−::AdarP195A/WT (m/f n=8/5), Mlkl−/−::AdarP195A/p150null (m/f n=6/3). or B: carrying a point mutation abrogating the kinase activity of RIPK1 (Ripk1kd). Ripk1kd/+::AdarP195A/WT (m/f n=3/11), Ripk1kd/+::AdarP195A/p150null (m/f n=7/5), Ripk1kd/kd::AdarP195A/WT (m/f n=11/8), Ripk1kd/kd::AdarP195A/p150null (m/f n=5/5). Statistical differences determined by individual student t-tests (two tailed). All genotypes are littermates from mixed litters.
Extended Data 9:
Extended Data 9:. Oligomerization of ZBP1 triggers necroptotic cell death.
A. Schematic indicating the replacement of ZBP1’s Z-DNA binding domain with a tandem FKBP domain. B-D: Cell death following addition of B/B homodimerizer with indicated combinations of ZVAD and GSK843 in LET1s (each group, n=4 biologic replicates) (B), SVECs (each group n=4 biologic replicates) (C) or MEFs (each group n=3 biologic replicates) (D). Statistical significance was determined by unpaired t tests (two-tailed). Experiments B and C are representative of two independent experiments, and D is representative of 3 independent experiments. All whisker bars are presented as mean +/− SD.
Extended Data 10:
Extended Data 10:. Molecular analysis of cell death induced by ZBP1–2xFV homodimerization.
A. Phospho-MLKL analysis of ZBP1–2xFV MEFs (wild-type, Ripk3−/−, MLKL−/−) after 1 hour stimulation with B/B homodimerizer. B. Cleaved-caspase 3 analysis of ZBP1–2xFV MEFs (wild-type, Ripk3−/−, MLKL−/−) after 3 hour stimulation with B/B homodimerizer. C. Representative image depicting Caspase-8 deficiency exacerbation of disease phenotype in ADARP195A/p150null::RIPK3−/− mice. Image of 20-day old littermates from the cross depicted in Fig. 4B.
Extended Data 11:
Extended Data 11:. Pathologic analysis of Mlkl−/−::Casp8−/−::Adarp150null/P195A mice.
A-B. Immunohistochemical staining (A) and quantification (B) in liver for cleaved-caspase 3. (n=3 d.0 pups, each group) Original magnification 10x. C. Additional histological images of other tissue sites (kidney, liver and small intestine). Kidney (20x) and liver (10x) PAS staining, small intestine HE staining (original magnification as stated). D-E. Immunohistochemical staining, with 2.5x and 10x images (D) and quantification (E) in brain for Iba1 (n=3 d.0 pups, each group). B & E use tissues from matched animals.
Extended Data 12:
Extended Data 12:. Immunoprecipitation of RIPK3 and RIPK1 by ZBP1 is enhanced by Casp8 deficiency.
A. Pulldown of ZBP1–2xFV (FKBP) and co-precipitation of RIPK1 in Ripk3−/−::Casp8−/− MEFs. B. Pulldown of ZBP1–2xFV (FKBP) and co-precipitation of RIPK1 and RIPK3 in Mkl−/−::Casp8−/− MEFs. C. Pulldown of ZBP1 and co-precipitation of RIPK3 and in Mlkl−/−::Adarp150null/P195A MEFs.
Extended Data 13:
Extended Data 13:. ZBP1 activation results in RIPK1 dependent, RIPK3 independent gene transcription which is enhanced by knockout of Casp8.
A-B Differential transcript analysis of Mlkl−/−::Casp8+/+ and Mlkl−/−::Casp8−/− MEFs (n=3) following ADAR depletion, by (A) Heatmap analysis and (B) individual quantification of the top 5 differentially expressed genes. Statistical significance determined by individual unpaired t tests (two-tailed). Where not indicated: **** p<0.0001. C. QPCR analysis of top 5 differentially expressed genes identified (B) in MEFs expressing ZBP1–2xFV after B/B activation after depletion of RIPK1. n=6 biologic replicates for each treatment group, each representing the average of three technical replicates. Data is compiled from two independent experiments. Statistical significance determined by individual unpaired t tests (two-tailed). Where indicated: **** p<0.0001. Whisker bars represent the mean +/− SD.
Extended Data 14:
Extended Data 14:. ZBP1A64P mutation attenuates ZBP1 activity in ADAR deficiency model and during influenza infection.
A. Previously-reported structures of the ZBDs of ZBP1 (left) and ADAR1 (right), with A64 and P195A (respectively) highlighted in green. PDB accession #s: 1J75 and 3F21. B. Survival proportions of Adar1P195A/p150null::ZBP1A64P mice (n=9 animals) compared with previous survival statistics of AdarP195A/p150null::ZBP1-a+/− animals. C. Cell death analysis following influenza (X31, MOI 2) infection of primary MEFs derived from Wild Type (B6/J), Zbp1−/− or ZBP1A64P/A64P mice. Each group, n=2 biologic replicates. Whisker bars represent the mean +/− SD. Experiment was independently replicated using MEFs derived from a different embryo. D. Expression of ZBP1 in wild-type, Zbp1−/−, and Zbp1A64P/A64P MEFs following 24 stimulation with 1000 IU/mL murine IFN-β.
Figure 1:
Figure 1:. Immunopathology in ADAR1-mutant mice is driven by ZBP1.
A: Schematic of ADAR1 and ZBP1. B-D: Parental and expected offspring genotypes (B), observed genotypes (C) and percent survival for each genotype produced (D) by the cross of Adarp150null/WT::Zbp1-a+/− mice to AdarP195A/P195A::Zbp1-a−/− mice. E-F: Observed weights for mice of indicated genotypes at 3 (E), 6 or 8 (F) weeks of age. Survival bars represent littermates across 18 litters, AdarP195A / WT:: Zbp1−/− (n=19), AdarP195A / WT:: Zbp1+/− (n=24), AdarP195A/p150null:: Zbp1+/− (n=14), AdarP195A/p150null:: Zbp1−/− (n=27). **** = p ≤ 0.0001 (Log-Rank Mantel Cox). Litter weights: AdarP195A/WT:: Zbp1+/+ (n=17), AdarP195A/p150null:: Zbp1+/+ (n=18), AdarP195A/p150null:: Zbp1+/+ (n=5). **** = p ≤ 0.0001, unpaired t test, two-tailed. 6 week weights, from left to right n = 15, 19, 18, 17, 2, 1. 8 week weights, from left to right n = 10, 18, 17, 15, 2. Whisker bars (1E,F) are presented as mean +/− SD.
Figure 2:
Figure 2:. The inflammatory program initiated by ADAR1 mutation remains intact upon ZBP1 knockout.
A-B: Volcano plots depicting differential expression of genes detected by RNA sequencing of whole spleen tissue derived from 23 day old mice of the genotypes (A) AdarP195A/p150null (affected) n=4 or (B) AdarP195A/p150null::Zbp1-g−/− (rescued) n=5, in each case compared to spleens derived from wild-type pups (n=4). C: Raincloud plots of affected (n=4) and ZBP1 (n=5) rescued animals depicting the statistically significant up- and down-regulated ADAR signature identified in A. in. ADAR1 signature was identified from the differential analysis of ADAR vs WT from genes with a log2 fold change > 1 and adjusted p-value < 0.01. D. Heatmap analysis of differential gene expression from Nanostring analysis of wild-type vs. Zbp1−/− ADAR mutant MEFs. E-F. Cell death, as measured by loss of plasma membrane integrity using an IncuCyte imager, of Adar mutant MEFs after 8 hour ZVAD treatment on (E) Adar::Zbp1 mutant MEFs (genetic knockout/mutants) or (F) Adar mutant MEFs with CRISPR-Cas9 knockout of ZBP1. Each experimental group (bar) contains n=8 biologic replicates (8 wells). Statistical significance determined by unpaired student t-tests, two-tailed. Incucyte analyses (E and F) are single representatives of independently duplicated experiments. Whisker bars (2E,F) are presented as mean +/− SD.
Figure 3:
Figure 3:. ZBP1-induced necroptosis does not underlie immunopathology induced by ADAR1 mutation.
A-C: Survival proportions for AdarP195A/p150null mice crossed to animals lacking MLKL (A), carrying a point mutation abrogating the kinase activity of RIPK1 (Ripk1kd) (B) or lacking RIPK3 (C). In each case, the result of a breeding scheme analogous to that depicted in Fig. 1B is shown. Survival proportions (A-C) represent littermates from 9 (A, Mlkl), 10 (B, Ripk1kd) or 18 (C, Ripk3) litters; AdarP195A / WT:: Mlkl+/− (n=28), AdarP195A / WT:: Mlkl−/− (n=10), AdarP195A/p150null:: Mlkl+/− (n=14), AdarP195A/p150null:: Mlkl−/− (n=9). AdarP195A / WT:: Ripk1kd/+ (n=25), AdarP195A / WT:: Ripk1kd/kd (n=27), AdarP195A/p150null:: Ripk1kd/+ (n=16), AdarP195A/p150null:: Ripk1kd/kd (n=13). AdarP195A / WT:: Ripk3+/− (n=28), AdarP195A / WT:: Ripk3−/− (n=10), AdarP195A/p150null:: Ripk3+/− (n=14), AdarP195A/p150null:: Ripk3−/− (n=9). Survival statistics determined by Log-Rank (Mantel-Cox) test, exact p values indicated on curves. D: Weights of male or female Ripk3−/− mice, observed at 21 days after birth. Litter weights: AdarP195A/WT:: Ripk3+/− (m/f n=13/12), AdarP195A/WT:: Ripk3−/− (m/f n=12/11), AdarP195A/p150null:: Ripk3−/− (m/f n=11/6), AdarP195A/p150null:: Ripk3+/− (m/f n=11/13). Statistical differences determined by individual unpaired t tests (two-tailed), exact p values indicated on plots. E-F: Cell death, as measured by loss of plasma membrane integrity, observed in MEFs from (E) Mlkl−/− and Mlkl−/−::Casp8−/− (n=3 for each group) and (F) Ripk3−/− and Ripk3−/−::Casp8−/− (n=4 for each group) genotypes stably expressing 2xFV-ZBP1, following treatment with the activating drug B/B. E and F are representative of three independently replicated experiments. Whisker bars (3D-F) are presented as mean +/− SD.
Figure 4:
Figure 4:. Caspase-8 suppresses lethal inflammatory signaling in ADAR1-mutant mice.
A-B: Ripk3−/−::Casp8−/−::AdarP195A/p150null cross (A) survival and (B) weight at weaning (d.21). A: Log-rank (Mantel-Cox) statistical test performed on survival curves for survival to day 50 between Ripk3−/−::Adarp150nullP195A littermates (AdarP195A/WT mice excluded from comparison) which were Casp8+/+ (n=26), Casp8+/− (n=43) and Casp8−/− (n=25) showed a significant decrease in survival proportion of Casp8−/− mice compared to Casp8+/+ (p=0.0568) and Casp8+/− (p=0.0139) mice. B: Difference between Casp8+/+ and Casp8+/− was not significant. Individual student t-tests performed on affected mouse weights (Adarp150null/P195A) show a statistically significant decrease in Casp8−/− (n=20) compared to Casp8+/+ (n=25), p=0.0284 and Casp8+/− (n=35), p=0.0179 mice. C: Observed (black) and expected (red) mice from Mlkl−/−::Casp8−/−::AdarP195A/p150null cross at birth (day 0) and at weaning (day 21). Chi square power analysis was performed on observed:expected frequencies at birth (not significant) and weaning (p=0.0032**). D: Volcano plots showing differential gene expression from Nanostring analysis of MEF cells derived from Mlkl−/− or Mlkl−/−::Casp8−/− embryos, following siRNA-mediated depletion of ADAR1. E. Survival proportions for Trex1−/− (n=61) or Trex1−/−::Ripk3−/− (n=37) mice. Not significant (Mantel-Cox Log-Rank). Whisker bars (4B) are presented as mean +/− SD.

Comment in

References

Main text references

    1. Pestal K et al. Isoforms of RNA-Editing Enzyme ADAR1 Independently Control Nucleic Acid Sensor MDA5-Driven Autoimmunity and Multi-organ Development. Immunity 43, 933–944 (2015). - PMC - PubMed
    1. Ahmad S et al. Breaching Self-Tolerance to Alu Duplex RNA Underlies MDA5-Mediated Inflammation. Cell 172, 797–810.e13 (2018). - PMC - PubMed
    1. Herbert A et al. A Z-DNA binding domain present in the human editing enzyme, double-stranded RNA adenosine deaminase. Proc National Acad Sci 94, 8421–8426 (1997). - PMC - PubMed
    1. Rice GI et al. Mutations in ADAR1 cause Aicardi-Goutières syndrome associated with a type I interferon signature. Nat Genet 44, 1243 (2012). - PMC - PubMed
    1. Maurano M et al. Protein kinase R and the integrated stress response drive immunopathology caused by mutations in the RNA deaminase ADAR1. Immunity (2021) doi:10.1016/j.immuni.2021.07.001. - DOI - PMC - PubMed

Methods References

    1. Murphy JM et al. The pseudokinase MLKL mediates necroptosis via a molecular switch mechanism. Immunity 39, 443–453 (2013). - PubMed
    1. Kasparcova V et al. Cutting Edge: RIP1 kinase activity is dispensable for normal development but is a key regulator of inflammation in SHARPIN-deficient mice. J Immunol 192, 5476–5480 (2014). - PMC - PubMed
    1. Lin J et al. RIPK1 counteracts ZBP1-mediated necroptosis to inhibit inflammation. Nature 540, 124–128 (2016). - PMC - PubMed
    1. Newton K, Sun X & Dixit VM Kinase RIP3 is dispensable for normal NF-kappa Bs, signaling by the B-cell and T-cell receptors, tumor necrosis factor receptor 1, and Toll-like receptors 2 and 4. Molecular and Cellular Biology 24, 1464–1469 (2004). - PMC - PubMed
    1. Salmena L et al. Essential role for caspase 8 in T-cell homeostasis and T-cell-mediated immunity. Gene Dev 17, 883–895 (2003). - PMC - PubMed

MeSH terms