. 2022 Jul 4:16:883333.
doi: 10.3389/fninf.2022.883333. eCollection 2022.

Fast Simulation of a Multi-Area Spiking Network Model of Macaque Cortex on an MPI-GPU Cluster

Affiliations

Fast Simulation of a Multi-Area Spiking Network Model of Macaque Cortex on an MPI-GPU Cluster

Gianmarco Tiddia et al. Front Neuroinform. .

Abstract

Spiking neural network models are increasingly establishing themselves as an effective tool for simulating the dynamics of neuronal populations and for understanding the relationship between these dynamics and brain function. Furthermore, the continuous development of parallel computing technologies and the growing availability of computational resources are leading to an era of large-scale simulations capable of describing regions of the brain of ever larger dimensions at increasing detail. Recently, the possibility to use MPI-based parallel codes on GPU-equipped clusters to run such complex simulations has emerged, opening up novel paths to further speed-ups. NEST GPU is a GPU library written in CUDA-C/C++ for large-scale simulations of spiking neural networks, which was recently extended with a novel algorithm for remote spike communication through MPI on a GPU cluster. In this work we evaluate its performance on the simulation of a multi-area model of macaque vision-related cortex, made up of about 4 million neurons and 24 billion synapses and representing 32 mm2 surface area of the macaque cortex. The outcome of the simulations is compared against that obtained using the well-known CPU-based spiking neural network simulator NEST on a high-performance computing cluster. The results show not only an optimal match with the NEST statistical measures of the neural activity in terms of three informative distributions, but also remarkable achievements in terms of simulation time per second of biological activity. Indeed, NEST GPU was able to simulate a second of biological time of the full-scale macaque cortex model in its metastable state 3.1× faster than NEST using 32 compute nodes equipped with an NVIDIA V100 GPU each. Using the same configuration, the ground state of the full-scale macaque cortex model was simulated 2.4× faster than NEST.

Keywords: GPU (CUDA); computational neuroscience; high performance computing (HPC); message passing interface (MPI); multi-area model of cerebral cortex; primate cortex; simulations; spiking neural networks.


Conflict of interest statement

The authors declare that the research was conducted in the absence of any commercial or financial relationships that could be construed as a potential conflict of interest.

Figures

Figure 1
Figure 1
Spike handling and delivery schemes. (A) Structure of a single spike buffer. (B) Schematic depicting MPI communication between spike buffers for different hosts.
Figure 2
Figure 2
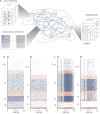
Spiking neuronal network model used to evaluate simulator performance in this study. (A) Schematic overview of the model. The multi-area model represents 32 areas of macaque vision-related cortex, each modeled by four cortical layers with a size of 1mm2. Local connectivity, cortico-cortical connectivity, and population sizes are adapted for each area. (B) Network activity of areas V1 and V2 in the ground state. (C) Network activity of the same areas in the metastable state. Figure adapted from Schmidt et al. (2018a) and Schmidt et al. (2018b).
Figure 3
Figure 3
Ground state distributions of firing rate (A,B), CV ISI (C,D) and Pearson correlation of the spike trains (E,F) for the populations L4E and L4I of area V1. The distributions are averaged over 10 simulations with NEST (orange) and NEST GPU (sky blue). Every averaged distribution has an error band representing its standard deviation.
Figure 4
Figure 4
Metastable state distributions of firing rate (A,B), CV ISI (C,D) and Pearson correlation of the spike trains (E,F) for the populations L4E and L4I of area V1. The distributions are averaged over 10 simulations with NEST (orange lines) and NEST GPU (sky blue dashed line). Every averaged distribution has an error band representing its standard deviation. An additional set of NEST simulation distributions is also shown.
Figure 5
Figure 5
Averaged distributions of the ground state and the metastable state of the model for all 32 areas obtained using NEST (orange, left side) and NEST GPU (sky blue, right side) and compared with split violin plots. The central dashed line represents the distribution's median, whereas the other two dashed lines represent the interquartile range. (A,D) average firing rate, (B,E) average CV ISI, (C,F) average Pearson correlation of the spike trains.
Figure 6
Figure 6
Earth Mover's Distance between distributions of firing rate (A,D), CV ISI (B,E) and correlation of the spike trains (C,F) obtained for area V1 of the model in the ground state and the metastable state. NEST-NEST (orange, left) and NEST-NEST GPU (sky blue, right) data are placed side by side.
Figure 7
Figure 7
Strong-scaling performance of the multi-area model in its ground and metastable states on JURECA-DC using NEST 3.0. (A) Simulated with parameters inducing stable ground state activity in the network. The left sub-panel displays the absolute wall-clock time Twall for the network construction and state propagation in ms for a biological model time Tmodel = 10s. Error bars indicate the standard deviation of the performance across 10 repeat simulations with different random seeds, the central points of which show the respective mean values. Error bars are shown in pink in the right panels to indicate that they are for the state propagation phase as a whole; the corresponding standard deviations are the same as in the left panels. The top right sub-panel presents the real-time factor defined as Twall/Tmodel. Detailed timers show the absolute (top right) and relative (bottom right) time spent in the four different phases of the state propagation: update, collocation, communication, and delivery. Where the collocation phase is not discernible, this is due to its shortness. (B) Simulated with parameters inducing a metastable state with population bursts of variable duration. Same arrangement as (A).
Figure 8
Figure 8
Contributions to the simulation time of the multi-area model. (A) Contributions to the simulation time in the ground state and the metastable state for NEST and NEST GPU measured with the real-time factor. Error bars show the standard deviation of the overall performance across 10 simulations with different random seeds. The plot shows the performance obtained by NEST GPU and NEST in the 32-node configuration. NEST simulations were performed on JURECA-DC using 8 MPI processes per node and 16 threads per task, whereas NEST GPU simulations were performed on JUSUF using one MPI process per node and 8 threads per task. The black dashed line indicates the biological time. (B) Relative contributions to the simulation time of the multi-area model in the metastable state for every area (i.e., for every MPI process) in a NEST GPU simulation.

References

    1. Akopyan F., Sawada J., Cassidy A., Alvarez-Icaza R., Arthur J., Merolla P., et al. . (2015). Truenorth: design and tool flow of a 65 mw 1 million neuron programmable neurosynaptic chip. IEEE Trans. Comput. Aided Design Integrat. Circ. Syst. 34, 1537–1557. 10.1109/TCAD.2015.2474396 - DOI
    1. Albers J., Pronold J., Kurth A. C., Vennemo S. B., Haghighi Mood K., Patronis A., et al. . (2022). A modular workflow for performance benchmarking of neuronal network simulations. Front. Neuroinform. 16, 837549. 10.3389/fninf.2022.837549 - DOI - PMC - PubMed
    1. Alonso-Nanclares L., Gonzalez-Soriano J., Rodriguez J., DeFelipe J. (2008). Gender differences in human cortical synaptic density. Proc. Natl. Acad. Sci. U.S.A.105, 14615–14619. 10.1073/pnas.0803652105 - DOI - PMC - PubMed
    1. Azevedo F. A., Carvalho L. R., Grinberg L. T., Farfel J. M., Ferretti R. E., Leite R. E., et al. . (2009). Equal numbers of neuronal and nonneuronal cells make the human brain an isometrically scaled-up primate brain. J. Comp. Neurol. 513, 532–541. 10.1002/cne.21974 - DOI - PubMed
    1. Babapoor-Farrokhran S., Hutchison R. M., Gati J. S., Menon R. S., Everling S. (2013). Functional connectivity patterns of medial and lateral macaque frontal eye fields reveal distinct visuomotor networks. J. Neurophysiol. 109, 2560–2570. 10.1152/jn.01000.2012 - DOI - PubMed

LinkOut - more resources