

The Development of 3D Bovine Intestinal Organoid Derived Models to Investigate Mycobacterium Avium ssp Paratuberculosis Pathogenesis
- PMID: 35859809
- PMCID: PMC9290757
- DOI: 10.3389/fvets.2022.921160
The Development of 3D Bovine Intestinal Organoid Derived Models to Investigate Mycobacterium Avium ssp Paratuberculosis Pathogenesis
Abstract
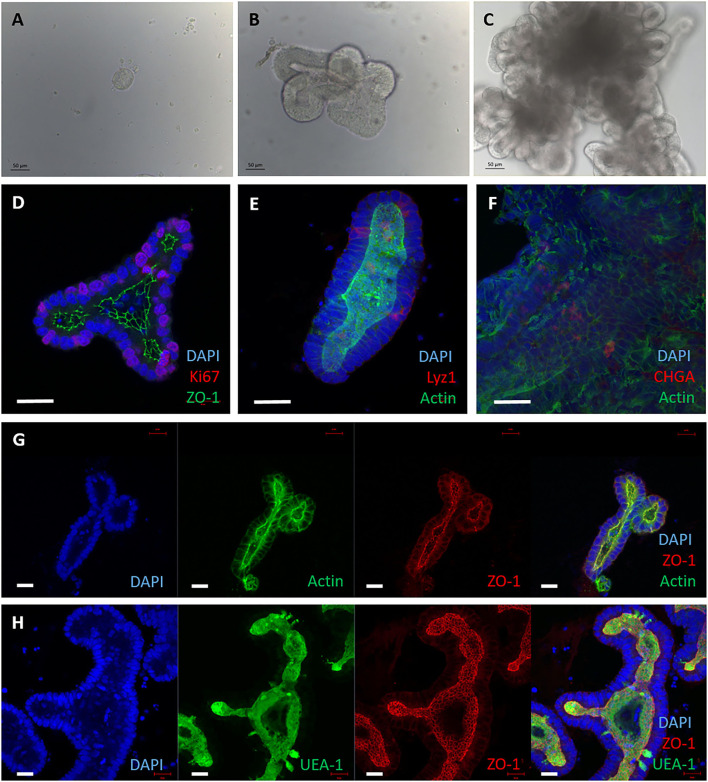
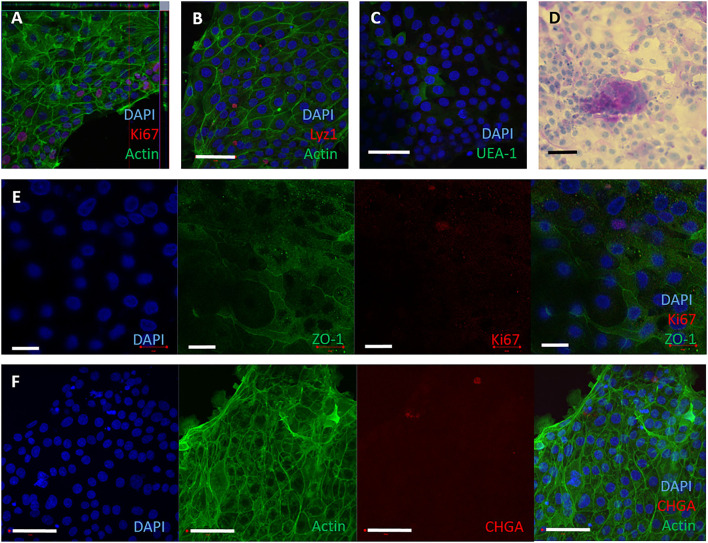
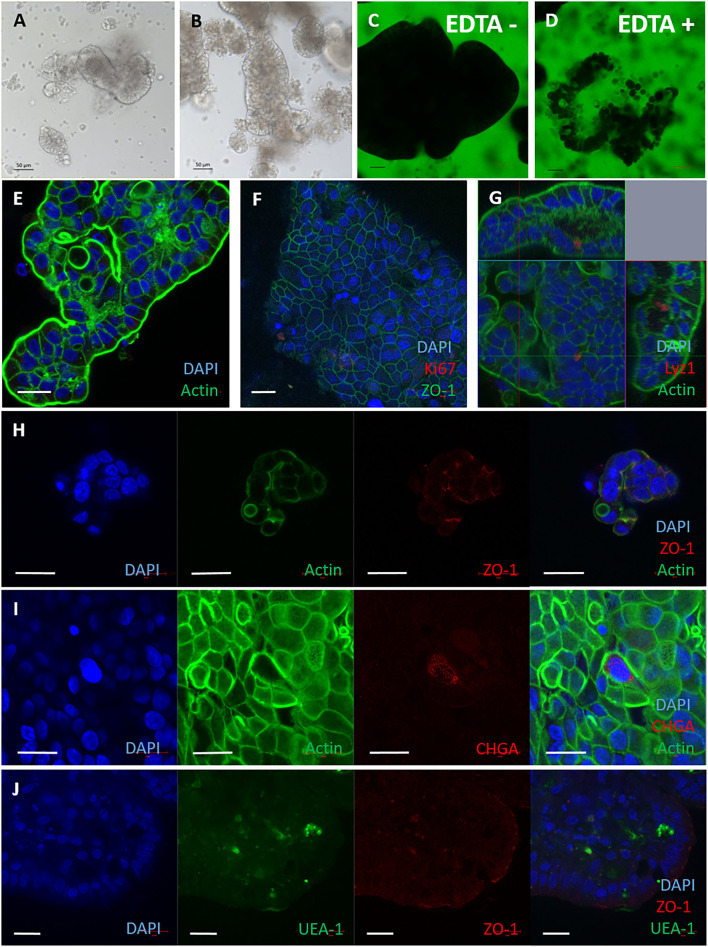
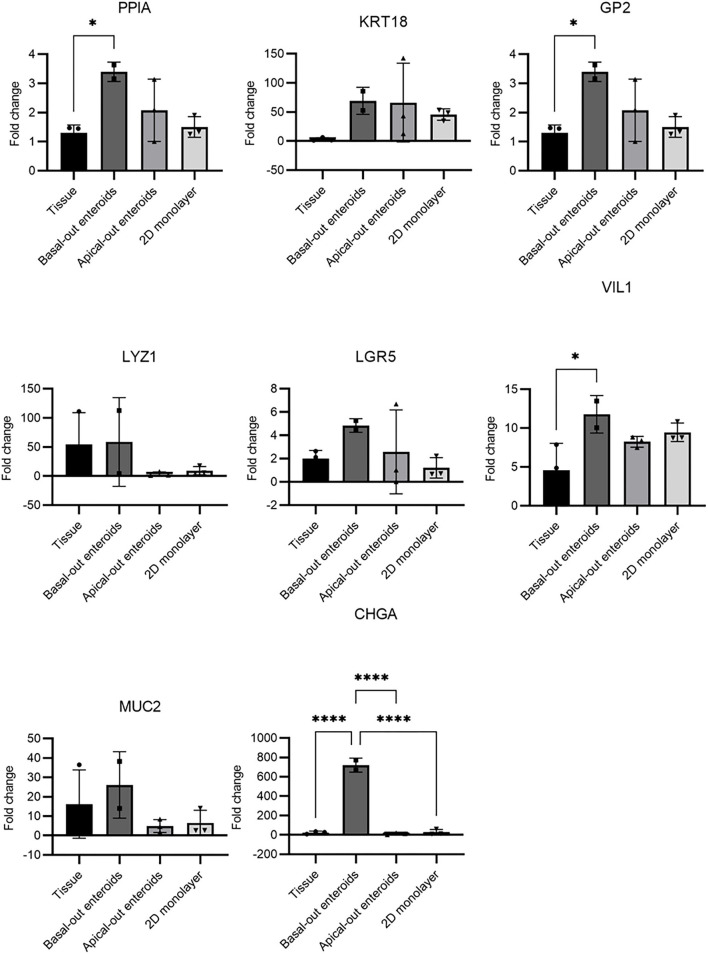
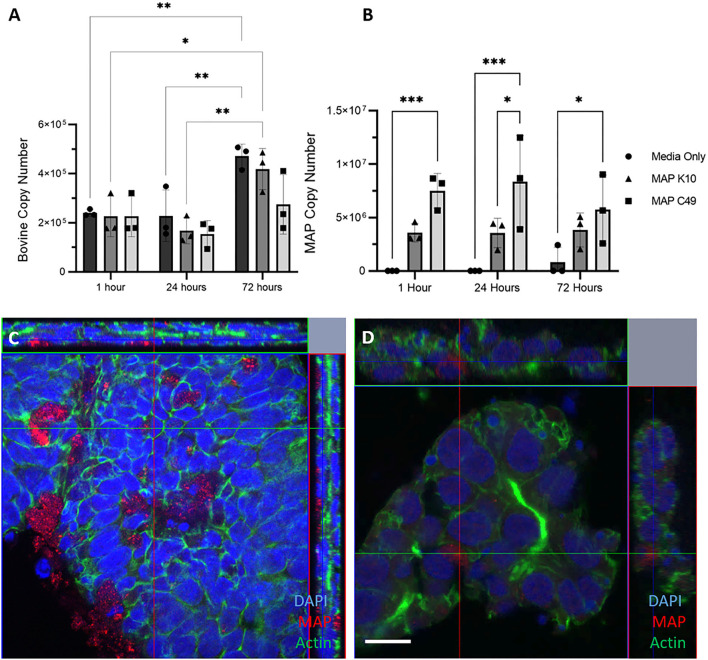
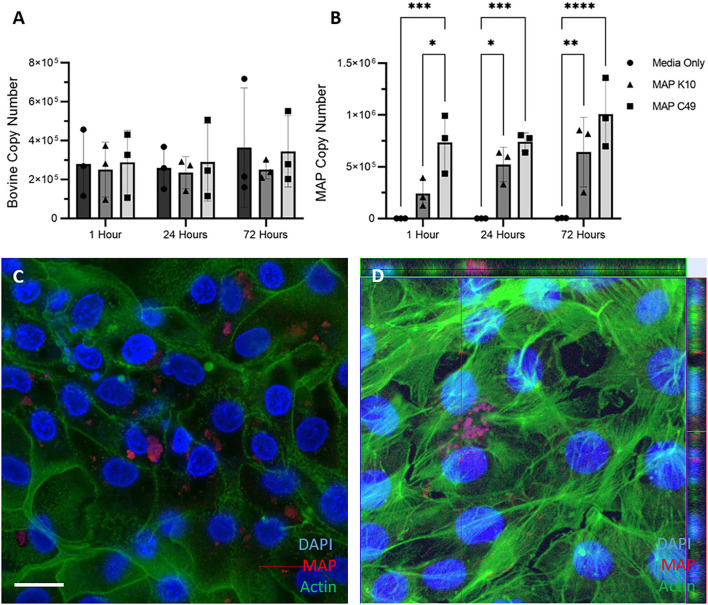
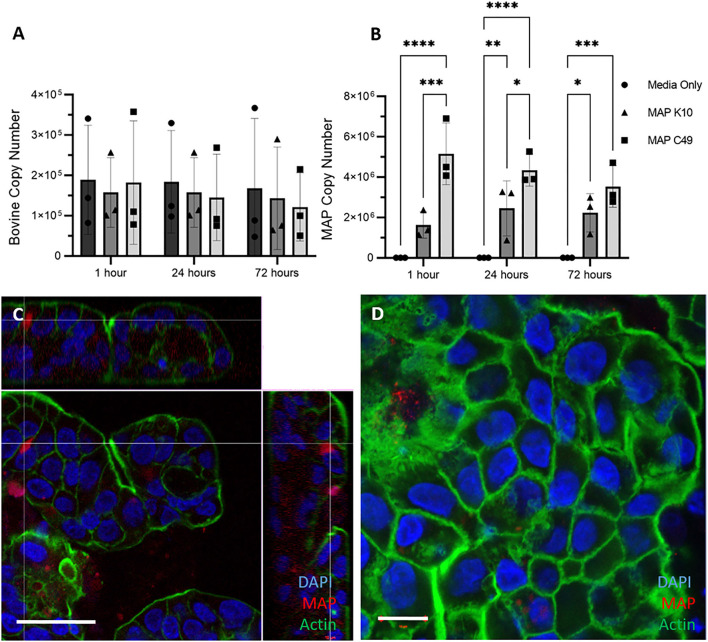
Mycobacterium avium subspecies paratuberculosis (MAP) is the etiological agent of Johne's Disease, a chronic enteritis of ruminants prevalent across the world. It is estimated that approximately 50% of UK dairy herds are infected with MAP, but this is likely an underestimate of the true prevalence. Infection can result in reduced milk yield, infertility and premature culling of the animal, leading to significant losses to the farming economy and negatively affecting animal welfare. Understanding the initial interaction between MAP and the host is critical to develop improved diagnostic tools and novel vaccines. Here we describe the characterisation of three different multicellular in vitro models derived from bovine intestinal tissue, and their use for the study of cellular interactions with MAP. In addition to the previously described basal-out 3D bovine enteroids, we have established viable 2D monolayers and 3D apical-out organoids. The apical-out enteroids differ from previously described bovine enteroids as the apical surface is exposed on the exterior surface of the 3D structure, enabling study of host-pathogen interactions at the epithelial surface without the need for microinjection. We have characterised the cell types present in each model system using RT-qPCR to detect predicted cell type-specific gene expression, and confocal microscopy for cell type-specific protein expression. Each model contained the cells present in the original bovine intestinal tissue, confirming they were representative of the bovine gut. Exposure of the three model systems to the K10 reference strain of MAP K10, and a recent Scottish isolate referred to as C49, led to the observation of intracellular bacteria by confocal microscopy. Enumeration of the bacteria by quantification of genome copy number, indicated that K10 was less invasive than C49 at early time points in infection in all model systems. This study shows that bovine enteroid-based models are permissive to infection with MAP and that these models may be useful in investigating early stages of MAP pathogenesis in a physiologically relevant in vitro system, whilst reducing the use of animals in scientific research. Bos taurus: urn:lsid:zoobank.org:act:4C90C4FA-6296-4972-BE6A-5EF578677D64.
Keywords: 2D cell culture; 3D cell model; Mycobacterium paratuberculosis (MAP); cattle; in vitro model; organoid.
Copyright © 2022 Blake, Jensen, Mabbott, Hope and Stevens.
Conflict of interest statement
The authors declare that the research was conducted in the absence of any commercial or financial relationships that could be construed as a potential conflict of interest.
Figures
Similar articles
-
The role of Mce proteins in Mycobacterium avium paratuberculosis infection.Sci Rep. 2024 Jun 28;14(1):14964. doi: 10.1038/s41598-024-65592-2. Sci Rep. 2024. PMID: 38942800 Free PMC article.
-
Mycobacterium avium subspecies paratuberculosis targets M cells in enteroid-derived monolayers through interactions with β1 integrins.Am J Physiol Gastrointest Liver Physiol. 2025 May 1;328(5):G482-G501. doi: 10.1152/ajpgi.00250.2024. Epub 2025 Mar 20. Am J Physiol Gastrointest Liver Physiol. 2025. PMID: 40112014
-
Rapid baso-apical translocation of Mycobacterium avium ssp. paratuberculosis in mammary epithelial cells in the presence of Escherichia coli.J Dairy Sci. 2018 Jul;101(7):6287-6295. doi: 10.3168/jds.2017-13945. Epub 2018 Apr 26. J Dairy Sci. 2018. PMID: 29705415
-
Molecular Epidemiology of Mycobacterium avium subsp. paratuberculosis on Dairy Farms.Annu Rev Anim Biosci. 2016;4:155-76. doi: 10.1146/annurev-animal-021815-111304. Epub 2015 Nov 2. Annu Rev Anim Biosci. 2016. PMID: 26526547 Review.
-
Potential application of emerging diagnostic techniques to the diagnosis of bovine Johne's disease (paratuberculosis).Vet J. 2016 Mar;209:32-9. doi: 10.1016/j.tvjl.2015.10.033. Epub 2015 Oct 22. Vet J. 2016. PMID: 26831164 Review.
Cited by
-
Differential role of M cells in enteroid infection by Mycobacterium avium subsp. paratuberculosis and Salmonella enterica serovar Typhimurium.Front Cell Infect Microbiol. 2024 Jul 8;14:1416537. doi: 10.3389/fcimb.2024.1416537. eCollection 2024. Front Cell Infect Microbiol. 2024. PMID: 39040600 Free PMC article.
-
From in vitro development to accessible luminal interface of neonatal bovine-derived intestinal organoids.BMC Vet Res. 2025 May 6;21(1):319. doi: 10.1186/s12917-025-04773-1. BMC Vet Res. 2025. PMID: 40325425 Free PMC article.
-
A matter of differentiation: equine enteroids as a model for the in vivo intestinal epithelium.Vet Res. 2024 Mar 16;55(1):30. doi: 10.1186/s13567-024-01283-0. Vet Res. 2024. PMID: 38493107 Free PMC article.
-
Bovine Enteroids as an In Vitro Model for Infection with Bovine Coronavirus.Viruses. 2023 Feb 27;15(3):635. doi: 10.3390/v15030635. Viruses. 2023. PMID: 36992344 Free PMC article.
-
Modeling Paratuberculosis in Laboratory Animals, Cells, or Tissues: A Focus on Their Applications for Pathogenesis, Diagnosis, Vaccines, and Therapy Studies.Animals (Basel). 2023 Nov 17;13(22):3553. doi: 10.3390/ani13223553. Animals (Basel). 2023. PMID: 38003170 Free PMC article. Review.
References
-
- Bermudez LE, Petrofsky M, Sommer S, Barletta RG. Peyer's patch-deficient mice demonstrate that mycobacterium avium subsp. paratuberculosis Translocates across the Mucosal Barrier via both M cells and enterocytes but has inefficient dissemination Infect Immun. (2010) 78:3570–7. 10.1128/IAI.01411-09 - DOI - PMC - PubMed
-
- Facciuolo A, Gonzalez-Cano P, Napper S, Griebel PJ, Mutharia LM. Marked differences in mucosal immune responses induced in ileal versus jejunal peyer's patches to mycobacterium avium subsp. paratuberculosis secreted proteins following targeted enteric infection in young calves. PLoS ONE. (2016) 11:158747. 10.1371/journal.pone.0158747 - DOI - PMC - PubMed
LinkOut - more resources
Full Text Sources
Research Materials