. 2022 Jul 4:10:933984.
doi: 10.3389/fcell.2022.933984. eCollection 2022.

Post-Transcriptional Dynamics is Involved in Rapid Adaptation to Hypergravity in Jurkat T Cells

Affiliations

Post-Transcriptional Dynamics is Involved in Rapid Adaptation to Hypergravity in Jurkat T Cells

Christian Vahlensieck et al. Front Cell Dev Biol. .

Abstract

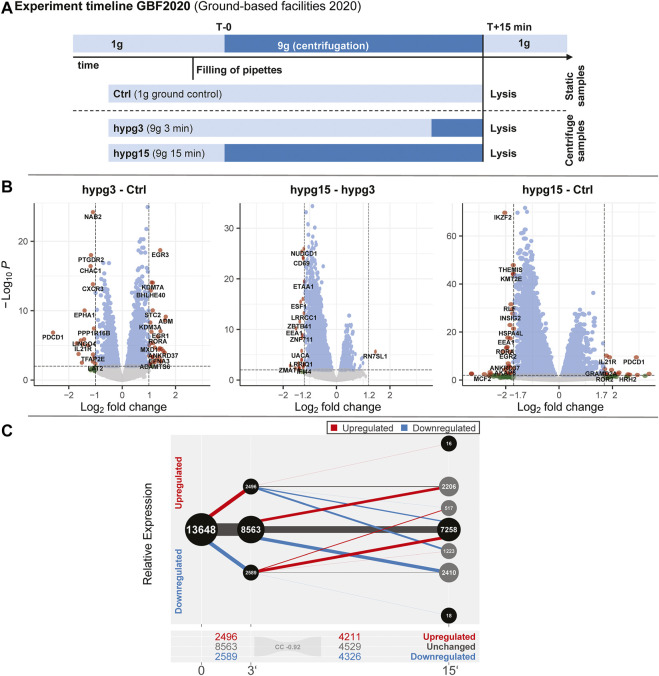
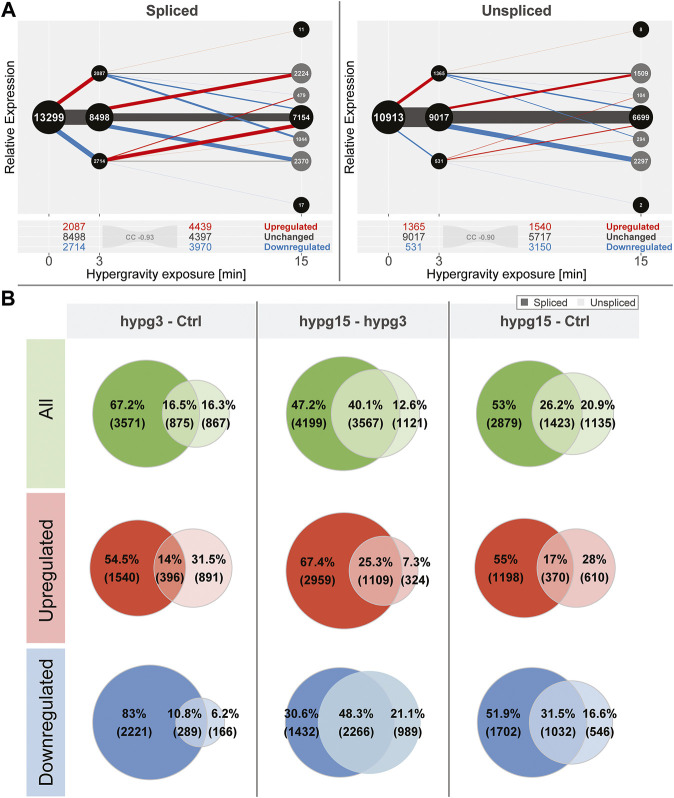
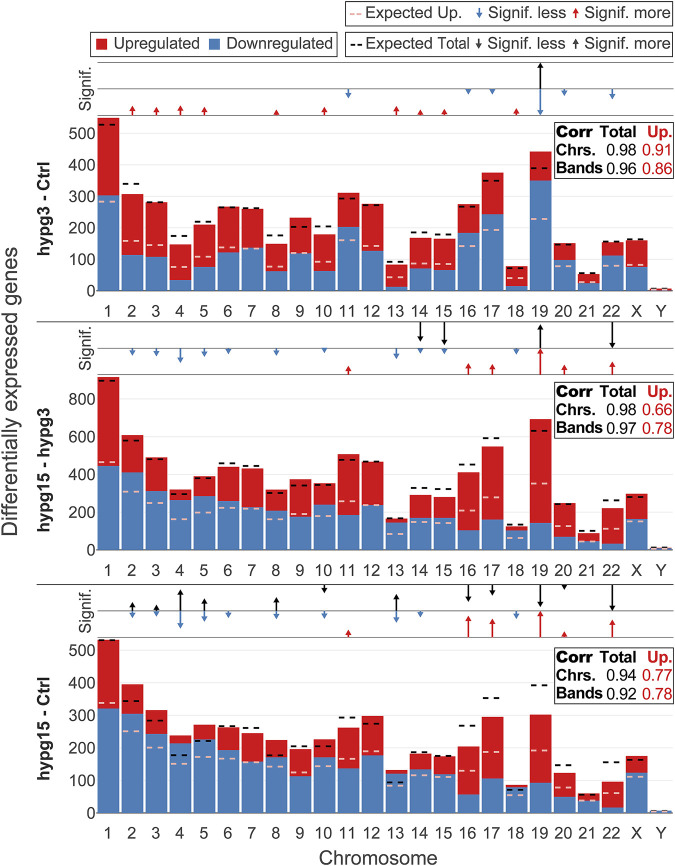
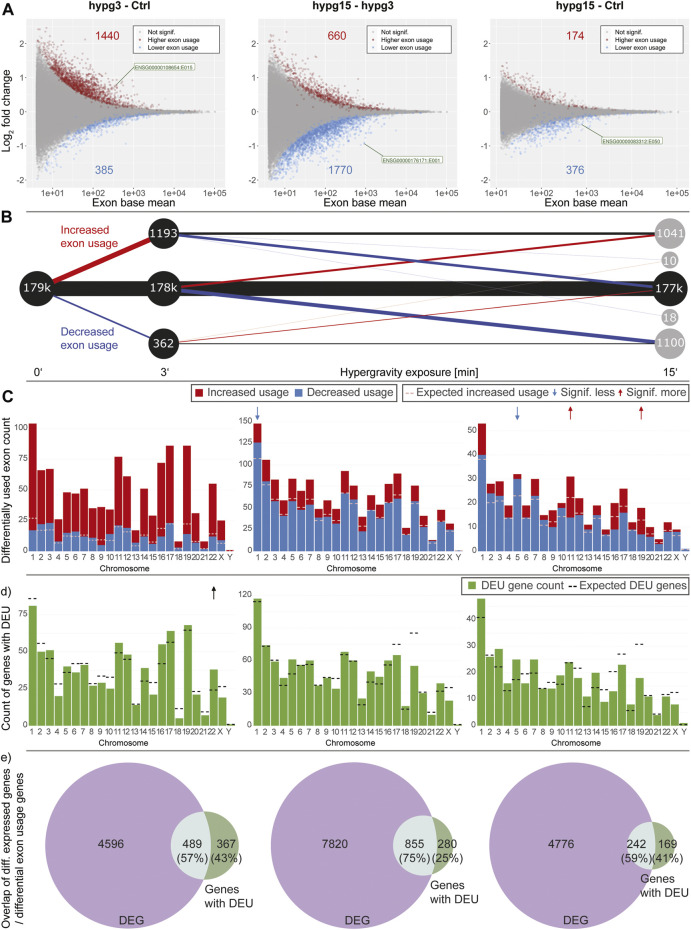
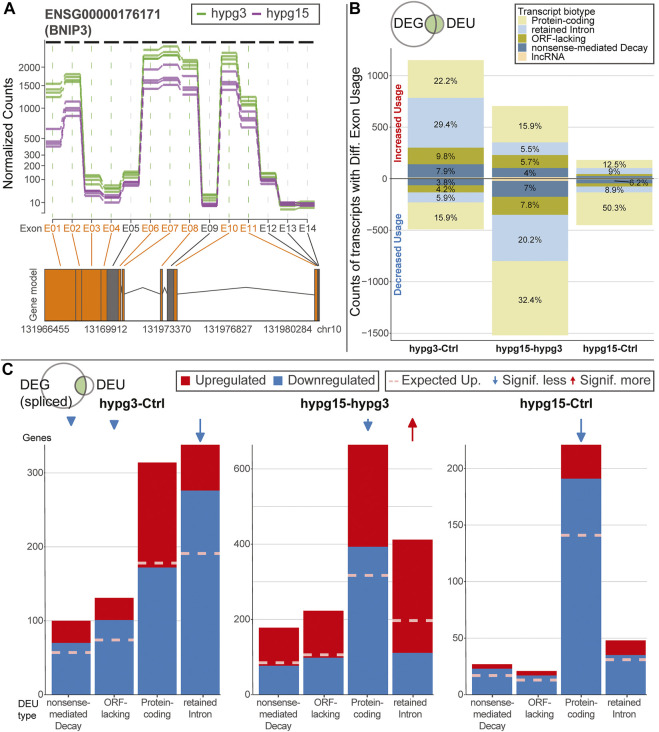
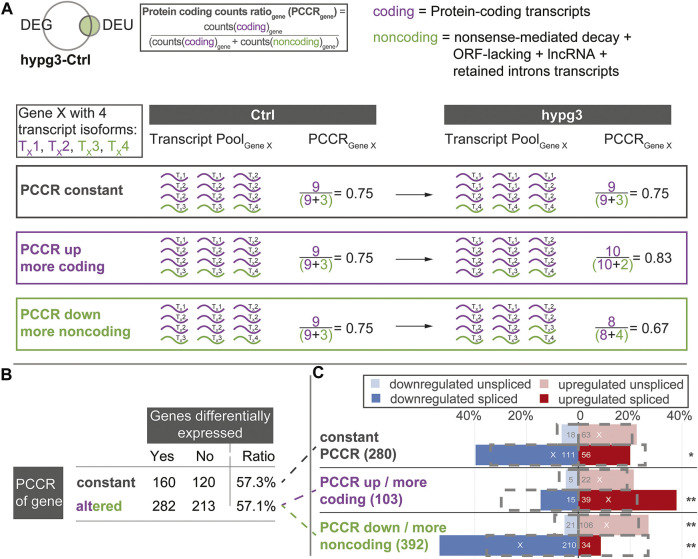
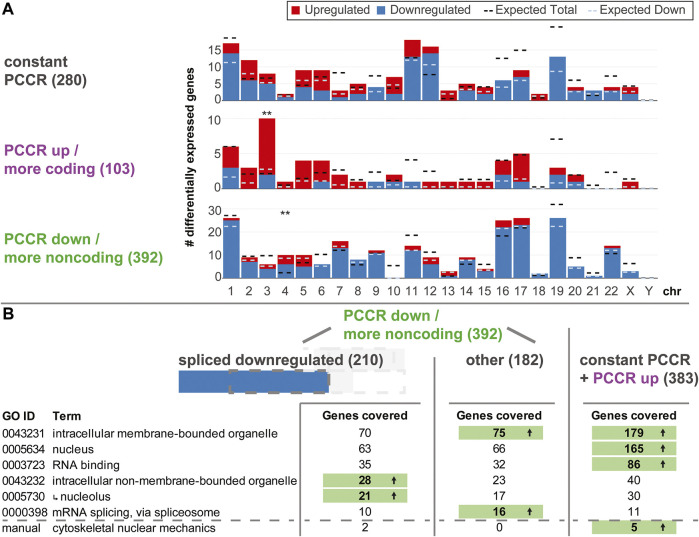
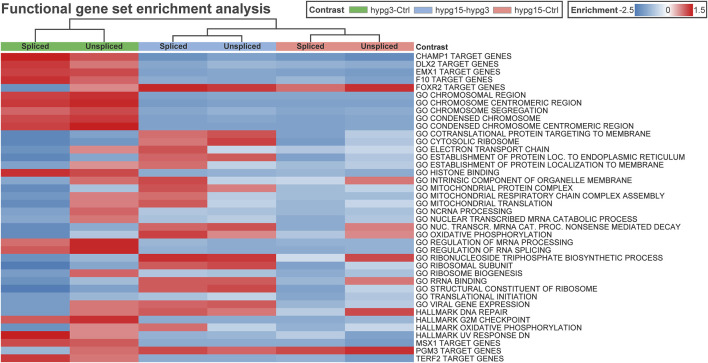
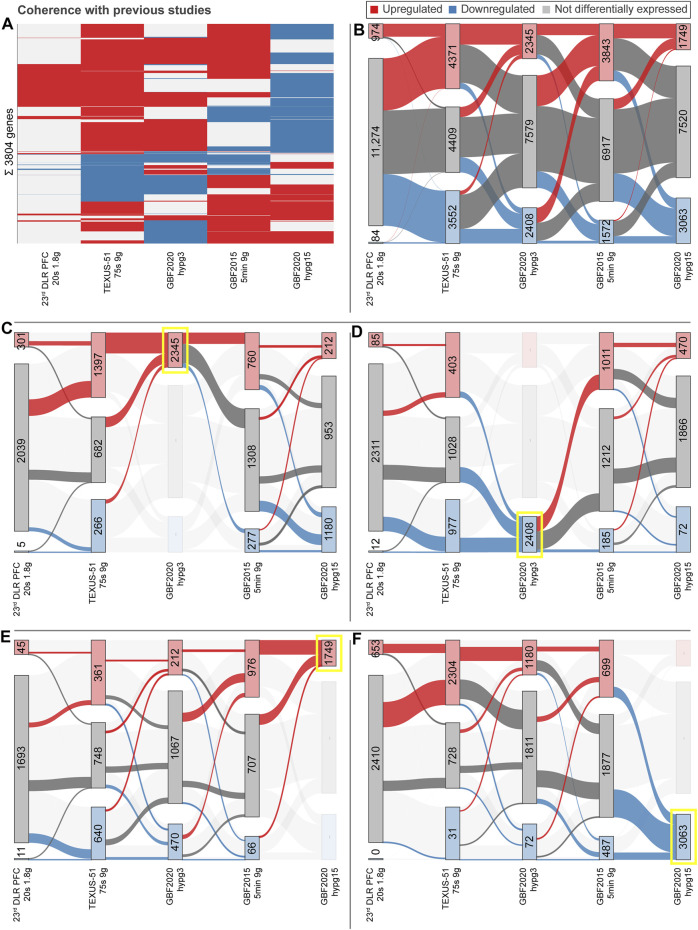
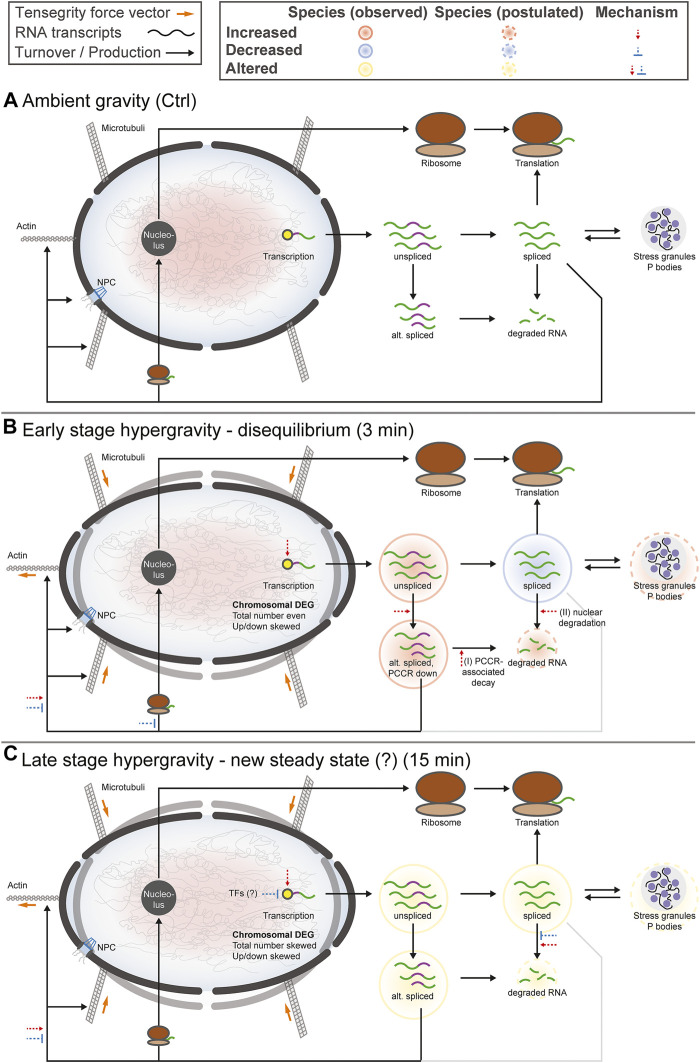
The transcriptome of human immune cells rapidly reacts to altered gravity in a highly dynamic way. We could show in previous experiments that transcriptional patterns show profound adaption after seconds to minutes of altered gravity. To gain further insight into these transcriptional alteration and adaption dynamics, we conducted a highly standardized RNA-Seq experiment with human Jurkat T cells exposed to 9xg hypergravity for 3 and 15 min, respectively. We investigated the frequency with which individual exons were used during transcription and discovered that differential exon usage broadly appeared after 3 min and became less pronounced after 15 min. Additionally, we observed a shift in the transcript pool from coding towards non-coding transcripts. Thus, adaption of gravity-sensitive differentially expressed genes followed a dynamic transcriptional rebound effect. The general dynamics were compatible with previous studies on the transcriptional effects of short hypergravity on human immune cells and suggest that initial up-regulatory changes mostly result from increased elongation rates. The shift correlated with a general downregulation of the affected genes. All chromosome bands carried homogenous numbers of gravity-sensitive genes but showed a specific tendency towards up- or downregulation. Altered gravity affected transcriptional regulation throughout the entire genome, whereby the direction of differential expression was strongly dependent on the structural location in the genome. A correlation analysis with potential mediators of the early transcriptional response identified a link between initially upregulated genes with certain transcription factors. Based on these findings, we have been able to further develop our model of the transcriptional response to altered gravity.

Keywords: altered gravity; gene expression; gravity-sensing; hypergravity; immune cells; space flight.


Conflict of interest statement

The authors declare that the research was conducted in the absence of any commercial or financial relationships that could be construed as a potential conflict of interest.

Figures

FIGURE 1
FIGURE 1
Global dynamics of the effects of hypergravity on the transcript pool. (A) Experiment fixation scheme. Overview of the experimental conditions for which samples were acquired. During the ground-based facilities 2020 campaign, Jurkat T cells were filled into 1 ml pipettes, incubated for 15 min and then rapidly emptied into RLT lysis buffer. During these 15 min, four samples remained at 1xg gravity (Ctrl), and four samples stayed at 1xg for 12 min and where consequently exposed to 9xg on a pipette centrifuge for 3 min before lysis (hypg3). A third group was exposed to 9xg for the entire 15 min before lysis (hypg15). (B) Volcano plots of all three temporal comparisons show the overall distribution. Genes with highest fold change that exceed the p value thresholds of ±1.0/±1.2/±1.7 are annotated. Hypg15-hypg3 and hypg15-Ctrl show a pronounced skew towards downregulation, for hypg3 a slight tendency towards upregulation is apparent. An MA plot analysis can be found in Supplementary Figure S3. (C) Temporal coherence of gene expression. The number of genes that were upregulated/downregulated after 3 min is shown (three balls at 3′). Starting from these pools, genes that were consistently or even exceedingly up-/downregulated (lines to upper two balls, lower two balls), those that were no longer differentially regulated (lines to center ball) or only slightly elevated/lower (lines to inner two grey balls), or even regulated in the opposite direction (lines crossing the middle) are displayed. The line width represents the number of genes in each category. Most genes that were differentially expressed after 3 min were either no longer differentially expressed (dominantly for downregulated) or even regulated in the opposite direction (dominantly for downregulated) after 15 min. Continuous regulation in a single direction was very rare. The Spearman correlation coefficient between fold changes of the hypg3-Ctrl and the hypg15-hypg3 comparison is displayed at the bottom.
FIGURE 2
FIGURE 2
Global dynamics of the effects of hypergravity on the spliced and unspliced transcript pool. (A) Temporal coherence of gene expression in the spliced and unspliced pool, analogously to Figure 1C. Again, the fraction of genes that were consistently regulated in one direction was very small. The initial regulation pattern after 3 min was not symmetric anymore but showed a preference for downregulation for the spliced fraction and a strong preference for upregulation for the unspliced fraction. (B) Overlap between spliced (strong colors) and unspliced (light colors) fractions for all genes, only upregulated, and only downregulated genes for all three temporal comparisons. The fraction of unspliced differentially expressed genes (DEGs) was small compared to spliced DEGs after 3 min and became larger in the following comparisons. This was mostly driven by the low number of downregulated unspliced genes after 3 min but not by upregulated genes after 3 min.
FIGURE 3
FIGURE 3
Chromosomal distribution of differential gene expression. Number of differentially upregulated (red) and downregulated (blue) genes per chromosome (horizontal axis) for all three comparisons. The expected number of total DEGs per chromosome (based on the fraction of differentially expressed genes for all genes and the number of detected genes per chromosome and assuming a uniform probability of differential expression) is shown as a black dashed line, the expected number of upregulated genes out of up- and downregulated genes is shown as dashed light red line. Above each diagram, arrows show if the actual number of all DEGs (upper row)/upregulated genes (lower row) lies significantly above (arrow pointing upwards, arrow length represents magnitude of deviation) or below (arrow pointing downwards, arrow length represents magnitude of deviation) the expectation. In the box on the right, the correlation coefficient between the expected and the actual number of total DEGs/upregulated genes is shown, both on the chromosome level (as displayed in the diagram) and on the chromosomal cytoband level. The closer the correlation coefficient comes to 1, the more the actual number corresponds to the expected number. Initially, DEGs were evenly distributed over all chromosomes, tightly following the expectation, but upregulation versus downregulation was non-evenly distributed between chromosomes. Later in time, also absolute numbers no longer corresponded to the expectations. The same figure split by chromosome cytobands can be found in Supplementary Figure S8.
FIGURE 4
FIGURE 4
Splicing dynamics. (A) MA plot for fold changes of exons for all three comparisons in time. Exons that showed significantly increased or decreased usage are highlighted. The exon with the lowest p value is highlighted for each comparison. A skew towards upregulation and overall diminishing effect strength over time become visible. (B) Temporal coherence of differentially used exons. For exons that were called differentially used, the behavior between 3 and 15 min resp. after 15 min is shown. Only exons that have a non-NA false discovery rate (FDR) value for all three contrasts are shown, leading to smaller numbers of differentially used exons after 3 min. The same filter logic as for Figures 1C, 2A,B was used. The line width for non-significant exons has been scaled to 1/10th to assure visibility. (C) Distribution of exons with significant differential usage over all chromosomes for all three comparisons. The expected number of exons with increased usage per chromosome is indicated with a dashed line. If the deviation between the expectation and the actual number is significant, it is indicated with an arrow on top of the diagram, comparable to Figure 4. Exon usage tightly followed the expectation for most chromosomes, only for the later comparisons do deviations become evident. (D) Distribution of genes that showed significant differential exon usage over all chromosomes. Expected number of genes per chromosomes is indicated with a dashed line. (E) Overlap between genes that showed differential gene expression and genes that showed differential exon usage for the given comparison. A large fraction of genes simultaneously showed differential gene expression and differential exon usage, yet there is a sizeable fraction (25–43%) of genes that singularly displayed differential exon usage.
FIGURE 5
FIGURE 5
Characterization of effects of alternative splicing. (A) Example of differential exon usage for the gene BCL2 interacting protein 3 (BNIP3) that carries the exon (E01) with the strongest differential effect for the contrast hypg15-hypg3, annotated in Figure 4A. Normalized counts of all exons are displayed over the entire gene. Exons that were flagged as significantly differentially used are highlighted in orange on the axis label and in the schematic gene model (exons as boxes, introns as triangles). (B) Distribution of transcript biotypes for all differentially used exons for all three temporal comparisons. Alterations in protein-coding exons still lead to translatable transcripts; transcripts with exons flagged as retained introns, processed transcripts and nonsense-mediated decay lead to transcripts that are not translated into proteins or show decreased translation rates and are likely prone to early degradation. The overall diminishing effect strength after 15 min of hypergravity can be observed, additionally the fraction of DEU transcripts that are not protein-coding is prominent after 3 min and decreased after 15 min. (C) Plotting of alternatively spliced transcripts from genes that, in addition to differential exon usage (DEU), are differentially expressed genes (DEGs). For each transcript, up- (red) or downregulation (blue) of the host gene is shown. This is based on the spliced pool since per definition the unspliced pool should not be informative about alternative splicing (compare Supplementary Figure S10 for unspliced data). Data is split by transcript biotype on the x axis. lncRNA has been excluded due to the small number. The expected fraction of upregulated genes is indicated by a dashed line, based on the fraction of upregulated versus downregulated genes for all genes multiplied with the number of DEG-DEU overlaps for the specified exon biotype. Protein-coding transcripts constitute the dominant fraction after 15 min but not after 3 min. After 3 min, DEUs with retained introns are the dominant group and are additionally much more downregulated than expected, as opposed to protein-coding DEUs after 3 min.
FIGURE 6
FIGURE 6
Protein coding counts ratio analysis of genes with differential exon usage. Quantitative analysis of the results from Figure 5C. Assessment if the transcript pool composition of genes changed between mostly coding transcripts and non-coding transcripts, and if this is associated with differential expression of these genes. (A) Definition of protein coding counts ratio (PCCR) as the fraction of RNA sequencing counts of coding transcripts over all counts of a given gene. Examples for a constant, increased, and decreased PCCR between Ctrl and hypg3 are given. (B) The fraction of differentially expressed genes was analyzed for genes where the PCCR was altered (up and down) and for those with unaltered PCCR. (C) Split between genes with constant PCCR, increased PCCR, and decreased PCCR. For each subset of genes, the number of genes that is significantly upregulated or downregulated in the spliced and unspliced fraction is indicated. The grey boxes indicate the expected distribution from the overall DEG datasets. Significant deviations from the expectation based on a Fisher exact test are indicated (** for p < 0.01, * for p < 0.05). An “X” indicates the mean direction of differential gene expression. An extended analysis can be found in Supplementary Figure S11.
FIGURE 7
FIGURE 7
Functional analysis of genes with constant, increased, and decreased PCCR. (A) Number of differentially upregulated (red) and downregulated (blue) genes per chromosome (horizontal axis) for genes with constant PCCR, increased PCCR, and decreased PCCR. The expected number of total DEGs per chromosome (based on the fraction of differentially expressed genes for all genes and the number of detected genes per chromosome and assuming a uniform probability of differential expression) is shown as a black dashed line, the expected number of downregulated genes out of the set of up- and downregulated genes is shown as a dashed light blue line. Chromosomes with significantly more or less differentially expressed genes are indicated with black stars, those with a significant deviation in the distribution of up-versus downregulated genes with blue stars (FDR <0.05 *, FDR <0.01 **). (B) Gene Ontology (GO) enrichment analysis of genes with decreased PCCR that are downregulated in the spliced dataset (left), all remaining genes with decreased PCCR (middle), and those with constant or increased PCCR (right). Only gene Ontology sets covering a large fraction of genes from the groups are listed. Further, a manually curated gene set was analyzed, containing factors involved in the cytoskeletal nuclear mechanical axis. If the number of covered genes significantly (FDR <0.05) exceeds the statistical expectation, it is highlighted in green with an arrow. The nucleolus GO set is a subset of the intracellular non-membrane-bounded organelle set, as indicated by an arrow.
FIGURE 8
FIGURE 8
Correlating regulatory effects with differential gene expression. Functional gene set enrichment analysis for differential gene expression for all three comparisons. The analysis was conducted separately for unspliced and for spliced transcripts. Selected MSigDB sets were analyzed, including GO pathways, transcription factor targets, hallmark genes, etc. Most gene sets show a rebound effect with either upregulation after 3 min and consecutive downregulation between 3 and 15 min or the other way around. Only a few sets show consistent enrichment for both spliced and unspliced data, including GO translational initiation which is consistently downregulated.
FIGURE 9
FIGURE 9
Coherence of transcriptional dynamics with other hypergravity studies at different timepoints. Hypergravity comparisons from previous studies have been added to the two comparisons hypg3- Ctrl and hypg15-Ctrl, including 20 s of 1.8xg hypergravity from the 23rd DLR Parabolic Flight Campaign (PFC), 75 s of on average 9xg hypergravity during the TEXUS-51 campaign, and 5 min of 9xg hypergravity from the 2015 ground-based facilities campaign (GBF 2015). Data sets are filtered for genes that could be detected in all data sets. Data sets are ordered by exposure time. (A) Clustered heat map of all genes that are differentially expressed in at least 3/5 of the data sets, a total of 3805 genes. Significantly (FDR <0.05) upregulated genes are indicated in red, downregulated in blue, not significantly differentially expressed in grey. (BF) Sankey flowchart of gene expression behavior over time. For each data set, corresponding to a point in time, the number of significantly (FDR <0.05) upregulated (red), not differentially expressed (grey), and downregulated (blue) genes is given. Box heights are proportional to the number of genes. For each category at each timepoint, the number of genes that consecutively become upregulated, downregulated, or not differentially expressed at the next timepoint is indicated by colored connectors of different sizes. This is either performed for all genes (B) or highlighting the behavior of genes that are upregulated or downregulated at a certain point in time, including upregulated after 3 min (C), downregulated after 3 min (D), upregulated after 15 min (E), and downregulated after 15 min (F).
FIGURE 10
FIGURE 10
Summary of the transcriptional effects of hypergravity discovered in this study. Turnovers that are increased (red) and decreased (blue) by altered gravity are indicated by arrows. Effects that could be fully demonstrated are displayed as solid lines; effects that could be postulated are indicated by dashed lines. The placement of items does not necessarily reflect the location in the cell. For reasons of simplicity, not all connectors are shown, e.g., translation of alternatively spliced RNA transcripts. Alternatively spliced transcripts are composed of transcripts with and without altered PCCR, and include, but are not limited to, nucleolar-associated transcripts and transcripts from the cytoskeletal nuclear mechanical axis. (A) Steady state. (B) Early effects that could be detected at 3 min of hypergravity. (C) Late effects/long-lasting effects that could be detected after 15 min of hypergravity.

References

    1. Adrian A., Schoppmann K., Sromicki J., Brungs S., Von Der Wiesche M., Hock B., et al. (2013). The Oxidative Burst Reaction in Mammalian Cells Depends on Gravity. Cell. Commun. Signal 11, 98. 10.1186/1478-811x-11-98 - DOI - PMC - PubMed
    1. Albrecht-Buehler G. (1991). Possible Mechanisms of Indirect Gravity Sensing by Cells. ASGSB Bull. 4, 25–34. - PubMed
    1. Ashworth W., Stoney P. N., Yamamoto T. (2019). States of Decay: The Systems Biology of mRNA Stability. Curr. Opin. Syst. Biol. 15, 48–57. 10.1016/j.coisb.2019.03.006 - DOI
    1. Battista N., Meloni M. A., Bari M., Mastrangelo N., Galleri G., Rapino C., et al. (2012). 5‐Lipoxygenase‐dependent Apoptosis of Human Lymphocytes in the International Space Station: Data from the ROALD Experiment. FASEB J. 26, 1791–1798. 10.1096/fj.11-199406 - DOI - PubMed
    1. Battle A., Khan Z., Wang S. H., Mitrano A., Ford M. J., Pritchard J. K., et al. (2015). Impact of Regulatory Variation from RNA to Protein. Science 347, 664–667. 10.1126/science.1260793 - DOI - PMC - PubMed