

Correlation between Blood Oxygen Level-Dependent Magnetic Resonance Imaging Images and Prognosis of Patients with Multicenter Diabetic Nephropathy on account of Artificial Intelligence Segmentation Algorithm
- PMID: 35860185
- PMCID: PMC9293502
- DOI: 10.1155/2022/5700249
Correlation between Blood Oxygen Level-Dependent Magnetic Resonance Imaging Images and Prognosis of Patients with Multicenter Diabetic Nephropathy on account of Artificial Intelligence Segmentation Algorithm
Abstract
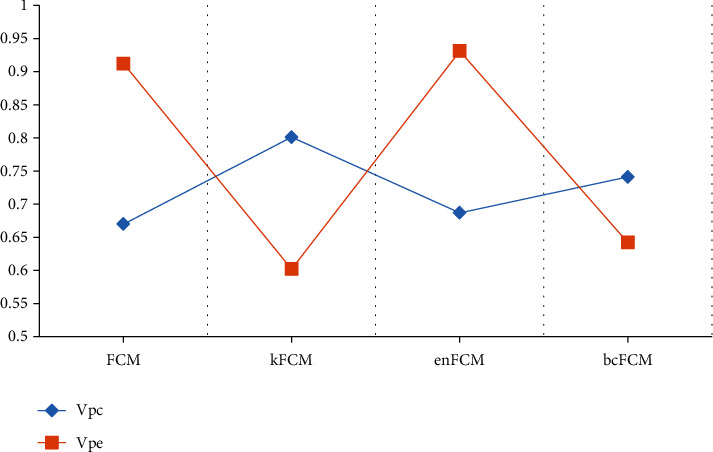
This study was aimed to analyze the correlation between blood oxygen level-dependent magnetic resonance imaging (BOLD-MRI) images and prognosis of patients with diabetic nephropathy (DN) based on artificial intelligence (AI) segmentation algorithm, so as to provide references for diagnosis and treatment as well as prognosis analysis of patients DN. In this study, a kernel function-based fuzzy C-means algorithm (KFCM) model was proposed, and the FCM algorithm based on neighborhood pixel information (BCFCM) and the FCM algorithm based on efficiency improvement (EnFCM) were introduced for comparison to analyze the image segmentation effects of three algorithms. The results showed that the partition coefficient (Vpc) and partition entropy (Vpe) of the KFCM algorithm were 0.801 and 0.602, respectively, which were better than those of the traditional FCM, BCFCM, and EnFCM algorithm. At the same time, the effects of correlation between renal cortex R2∗ (RC-R2∗), renal medulla R2∗ (RM-R2∗), renal cortex D (RC-D), renal medulla D (RM-D) and renal function on the prognosis were compared. The results showed that the correlation coefficients between RC-R2∗, RM-R2∗, RC-D, RM-D and renal function were 0.57, 0.62, 0.49, and 0.38, respectively; among them, RC-R2∗ and RM-R2∗ were negatively correlated to the estimated glomerular filtration rate (eGFR), and the difference between the groups was statistically significant (P <0.05). Among the factors affecting the prognosis of DN patients, the GFR, hemoglobin (Hb), RC-R2∗, RM-R2∗, and RC-D were all related to the prognosis of DN, and the difference between groups was statistically obvious (P <0.05). It suggested that the KFCM algorithm proposed in this study showed the relatively best segmentation effect on BOLD-MRI images for DN patients; an increase in R2∗ indicated a poor prognosis, and an increase in the RC-D value indicated a better prognosis.
Copyright © 2022 Yifan Zhang et al.
Conflict of interest statement
The authors declare no conflicts of interest.
Figures


References
Publication types
MeSH terms
Substances
LinkOut - more resources
Full Text Sources
Medical
Research Materials
Miscellaneous
