[Preprint]. 2023 Jun 16:2022.01.28.477987.
doi: 10.1101/2022.01.28.477987.

Mapping SARS-CoV-2 antigenic relationships and serological responses

Affiliations

Mapping SARS-CoV-2 antigenic relationships and serological responses

Samuel H Wilks et al. bioRxiv. .

Update in

  • Mapping SARS-CoV-2 antigenic relationships and serological responses.
    Wilks SH, Mühlemann B, Shen X, Türeli S, LeGresley EB, Netzl A, Caniza MA, Chacaltana-Huarcaya JN, Corman VM, Daniell X, Datto MB, Dawood FS, Denny TN, Drosten C, Fouchier RAM, Garcia PJ, Halfmann PJ, Jassem A, Jeworowski LM, Jones TC, Kawaoka Y, Krammer F, McDanal C, Pajon R, Simon V, Stockwell MS, Tang H, van Bakel H, Veguilla V, Webby R, Montefiori DC, Smith DJ. Wilks SH, et al. Science. 2023 Oct 6;382(6666):eadj0070. doi: 10.1126/science.adj0070. Epub 2023 Oct 6. Science. 2023. PMID: 37797027 Free PMC article.

Abstract

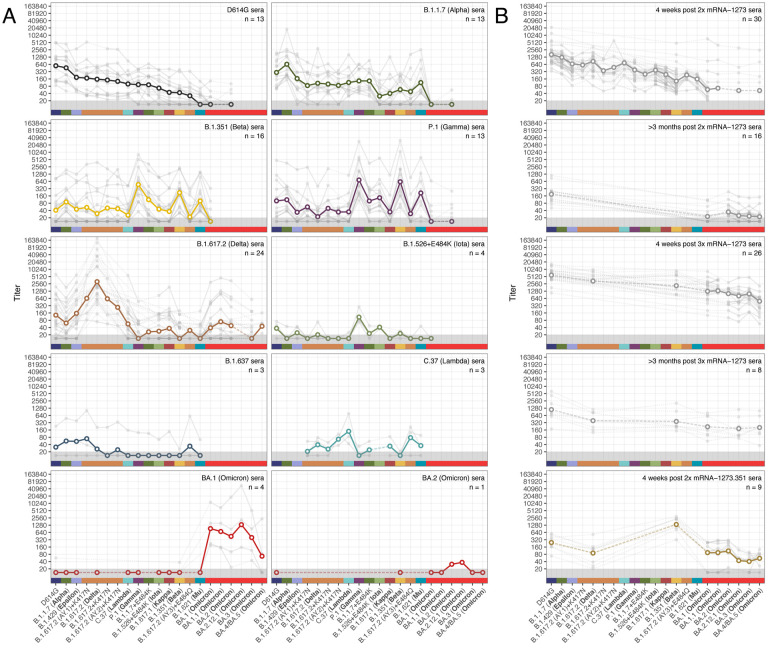
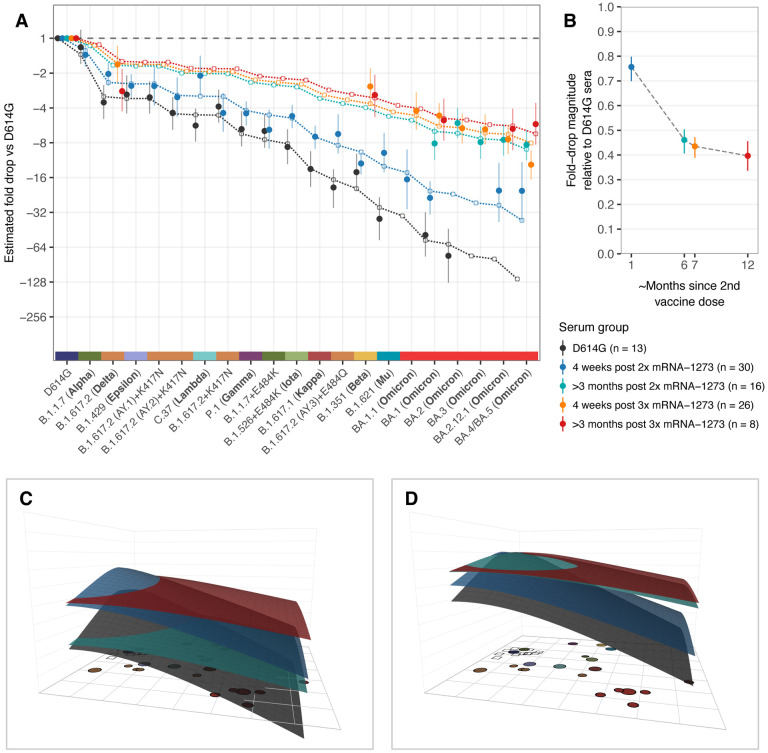
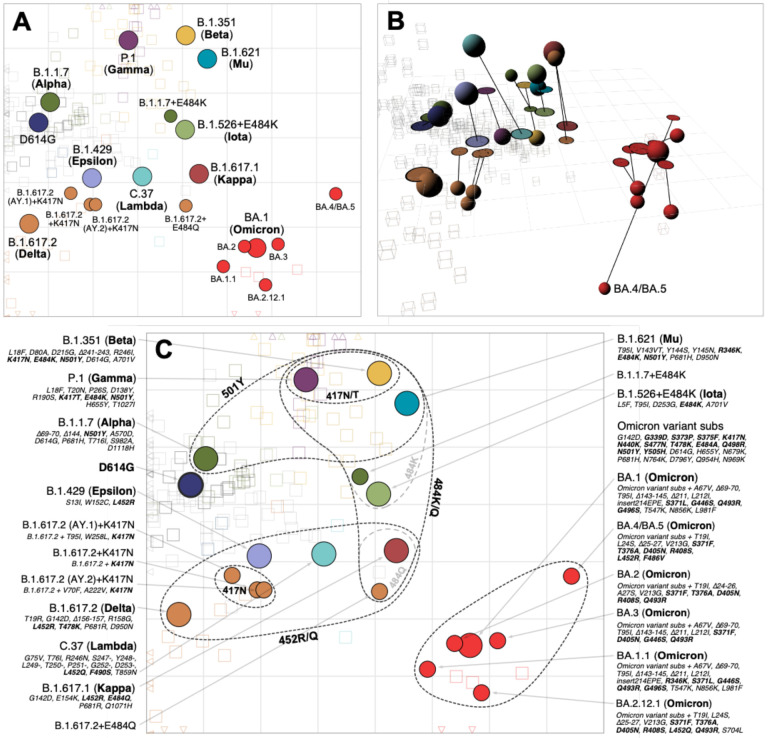
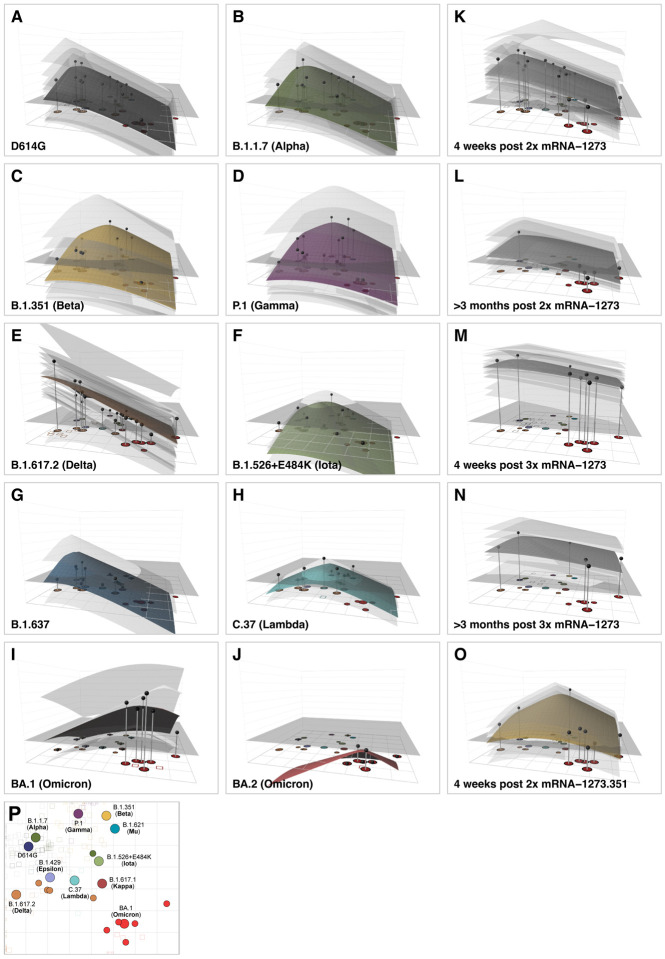
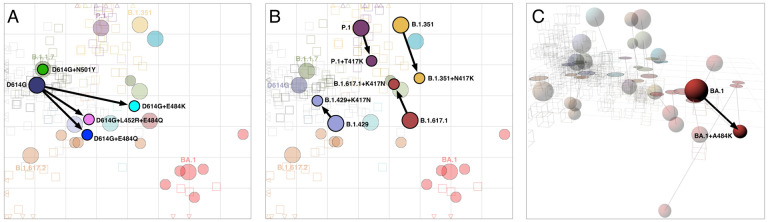
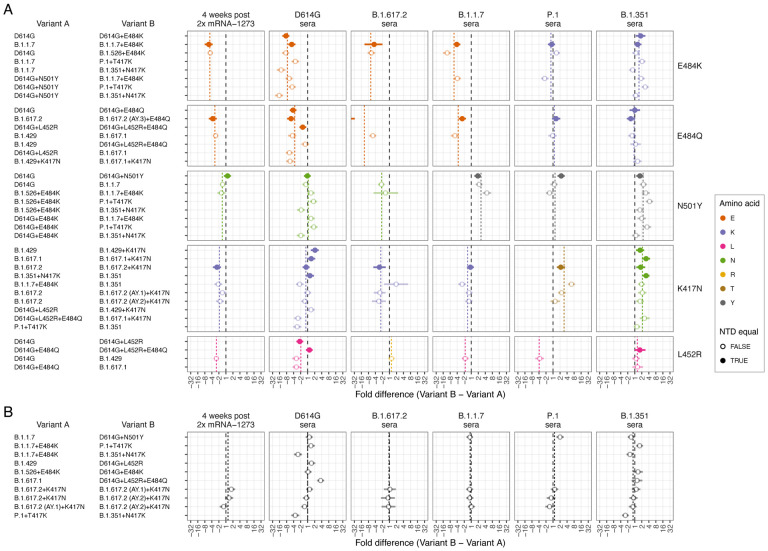
During the SARS-CoV-2 pandemic, multiple variants escaping pre-existing immunity emerged, causing concerns about continued protection. Here, we use antigenic cartography to analyze patterns of cross-reactivity among a panel of 21 variants and 15 groups of human sera obtained following primary infection with 10 different variants or after mRNA-1273 or mRNA-1273.351 vaccination. We find antigenic differences among pre-Omicron variants caused by substitutions at spike protein positions 417, 452, 484, and 501. Quantifying changes in response breadth over time and with additional vaccine doses, our results show the largest increase between 4 weeks and >3 months post-2nd dose. We find changes in immunodominance of different spike regions depending on the variant an individual was first exposed to, with implications for variant risk assessment and vaccine strain selection.


Conflict of interest statement

Competing interests

Victor M Corman has his name on patents regarding SARS-CoV-2 serological testing and monoclonal antibodies. He is also a part-time employee at Labor Berlin - Charité Vivantes GmbH, a diagnostic laboratory and subsidiary of Charité - Universitätsmedizin Berlin and the Vivantes – Netzwerk für Gesundheit GmbH.

Florian Krammer has been consulting for Curevac, Seqirus and Merck and is currently consulting for Pfizer, Third Rock Ventures, Avimex and GSK. He is named on several patents regarding influenza virus and SARS-CoV-2 virus vaccines, influenza virus therapeutics and SARS-CoV-2 serological tests. Some of these technologies have been licensed to commercial entities and Dr. Krammer is receiving royalties from these entities. Dr. Krammer is also an advisory board member of Castlevax, a spin-off company formed by the Icahn School of Medicine at Mount Sinai to develop SARS-CoV-2 vaccines. The Krammer laboratory has received funding for research projects from Pfizer, GSK and Dynavax and three of Dr. Krammer’s mentees have recently joined Moderna.

Figures

Fig. 1
Fig. 1. Neutralization of lentivirus pseudotypes encoding different SARS-CoV-2 spike proteins, against different groups of human sera collected after vaccination or primary infection with different variants.
Serum groups are split into sera elicited by infection with different variants (A), and sera elicited by vaccination (B). Variants are ordered according to geometric mean titer (GMT) in D614G sera (panel A, top left), while additional Omicron variants are ordered chronologically. Bold lines with empty circles show the GMTs calculated after estimated differences in individual response size were removed to mitigate biases where not all sera from a group were titrated against a particular variant, as described in Materials and Methods, ‘Titer Analyses’ section. Fainter individual lines and solid points show individual serum titers. Points in the gray region at the bottom of the plots show titers and GMTs that fell below the detection threshold of 20. Each panel is labeled according to the respective serum group and color-coded as indicated on the x-axis. Fig. S2 shows titers split by sample source for the 5 serum groups where samples came from a mixture of cohorts or agencies. Titer box plots, line plots showing the individual serum titers after accounting for individual effects, and titer folddifferences relative to the homologous titer, are shown in figs. S3, S4 and S5 respectively.
Fig. 2
Fig. 2. Comparison of fold-drops to different variants in post D614G infection and post mRNA-1273 vaccination sera.
A) Comparison of different estimates of titer fold-drop responses against different variants. Solid points show the estimate for the mean fold drop compared to the titer for D614G, while lines represent the 95% highest density interval (HDI) for this estimate. The points for D614G to the left of the plot represents the homologous virus against which fold-change for other strains was compared and are therefore fixed at 1. Dotted lines and outline circles show estimates based on a model that assumes a shared overall pattern of fold-drops but estimates “slope” differences in the rate of reactivity drop-off seen in the 4 serum groups, as described in Materials and Methods, “Calculating fold-drop differences in vaccine sera”. To aid comparison, points and lines for each of the serum groups have some offset in the x-axis. B) Estimates of fold-drop magnitudes for each mRNA-1273 serum group, relative to the fold-drops seen in the D614G convalescent serum group. Lines show the 95% HDI for each of the estimates and the position on the x axis is proportional to the number of months since 2nd vaccine dose, assuming an average of 6 months for sera in the >3 months post 2x mRNA-1273 and >3 months post 3x mRNA-1273 groups. C) Antibody landscapes showing how estimates of the mean titer for each of the serum groups in panel A vary across antigenic space. D) Antibody landscapes as shown in C but fixed to have the same peak titer (2560) against the D614G variant in order to visualize differences in the slope of the titer drop-off based on a fixed magnitude of response. Interactive versions of the landscapes shown in panels C & D are accessible online at https://acorg.github.io/mapping_SARS-CoV-2_antigenic_relationships_and_serological_responses.
Fig. 3
Fig. 3. Antigenic map of SARS-CoV-2 variants and selected substitutions.
A) Antigenic map with variant names. B) Antigenic map with variant positions in 3D and lines connecting to their respective positions in the 2D map. C) Antigenic map with variant names and substitutions annotated and grouped by amino acid present at spike positions 417, 452, 484 and 501, with an additional grouping for the 6 Omicron variants. Variants are shown as circles, sera as squares/cubes. Variants with additional substitutions from a root variant are denoted by smaller circles, in the color of their root variant. The x and y-axes both represent antigenic distance, with one grid square corresponding to a two-fold serum dilution in the neutralization assay. Therefore, two grid squares correspond to a four-fold dilution, three to an eight-fold dilution and so on. The x-y orientation of the map is free, as only the relative distances between variants and sera are relevant. Triangular arrowheads at the edge of the bounding box point in the direction of the sera that would be shown outside of the plot limits. A non-zoomed version of this map is shown in fig. S22. Interactive versions of the maps shown in panels A & B are available online at https://acorg.github.io/mapping_SARS-CoV-2_antigenic_relationships_and_serological_responses.
Fig. 4
Fig. 4. Antibody landscapes for each serum group.
Colored surfaces show the GMT antibody landscapes for the different serum groups, light gray surfaces show the landscapes for individual sera. Gray impulses show the height of the GMT for a specific variant, after accounting for individual effects as described in Materials and Methods (which would otherwise bias the GMT for variants not titrated against all sera). The base x-y plane corresponds to the antigenic map shown in Fig. 3 and reproduced in panel P. The vertical z-axis in each plot corresponds to the titer on the log2 scale, each two-fold increment is marked, starting from a titer of 20, one unit above the map surface. The gray horizontal plane indicates the height of a titer of 50, as a reference for judging the landscapes against various estimates of neutralizing antibody correlates of protection. Additional visualizations of predicted versus fitted titers are shown in fig. S24. The number of sera included for the calculation of the landscapes are A) D614G sera (n=13), B) B.1.1.7 sera (n=13), C) B.1.351 sera (n=15), D) P.1 sera (n=13), E) B.1.617.2 sera (n=21), F) B.1.526+E484K sera (n=4), G) B.1.637 sera (n=2), H) C.37 sera (n=2), I) BA.1 sera (n=4), J) BA.2 sera (n=1), K) 4 weeks post 2x mRNA-1273 sera (n=30), L) >3 months post 2x mRNA-1273 sera (n=13), M) 4 weeks post 3x mRNA-1273 sera (n=26), N) >3 months post 3x mRNA-1273 sera (n=8), O) 4 weeks post 2x mRNA-1273.351 sera (n=9). Interactive versions of the landscapes in each of the panels are available online at https://acorg.github.io/mapping_SARS-CoV-2_antigenic_relationships_and_serological_responses.
Fig. 5
Fig. 5. Antigenic maps including laboratory-made mutants with substitutions at positions 417, 452, 484, and 501.
A) Variants with substitutions N501Y, E484K, E484Q, and L452R+E484K in the background of D614G; D614G+L452R is not shown since it was titrated against only D614G sera, so its position could not be determined. B) Variants with the T/N417K substitution in the background of P.1 and B.1.351 respectively, and K417N in the background of B.1.429 and B.1.617.1. C) BA.1 with the substitution A484K. The map in panel C is in 3D to highlight the antigenic differences between BA.1, BA.1+A484K, and BA.4/BA.5. The 2D version of panel C is shown in fig. S29. Arrows point from the antigenic position of the root virus to that of the laboratorygenerated variant. Interactive versions of the maps shown in each panel are available online at https://acorg.github.io/mapping_SARS-CoV-2_antigenic_relationships_and_serological_responses.
Fig. 6
Fig. 6. Effect of pairwise amino acid differences on reactivity to different serum groups.
This plot compares the average fold difference in titer between A) different pairs of variants that differ by only a single amino acid difference in the RBD, or B) that do not differ by any amino acids in the RBD, but differ in the NTD. Comparisons are grouped by serum group (panel columns) and corresponding RBD difference (panel rows). In each panel the circle represents the estimate for the average fold difference in titer between variant A and variant B, as named on the left-hand side of the plot, while lines extend to indicate 95% highest density interval (HDI) for this estimate. The black dashed line marks a fold difference in titer of 1 (no difference), while the colored dashed line indicates the average fold difference between all pairs of variants with that substitution in the RBD. Points and lines are colored according to the amino acid in the variant homologous to that serum group, at the position in the RBD where the pair of variants compared differ. Filled circles indicate where pairs of variants had no additional amino differences in the NTD region, often because one was generated as an artificial mutant. In contrast, open circles indicate pairs of variants with additional amino acid differences in the NTD region, in addition to the RBD amino acid difference listed. The estimate for B.1.617.2 sera fold differences between the B.1.617.2 and B.1.617.2 (AY.3)+E484Q variants (panel A 3rd column, 2nd row), which falls outside the plot, is −59.4 (95% HDI −117.1, −30.7). Details of how fold-difference estimates and highest density intervals were calculated are described in Materials and Methods. Figure S30 shows the same results against an expanded set of pairwise amino acid differences. Interactive scatterplots comparing titers against each pair of variants for each serum group are available online at https://acorg.github.io/mapping_SARS-CoV-2_antigenic_relationships_and_serological_responses.

References

    1. Weekly epidemiological update on COVID-19 – 25 May 2023, (available at https://www.who.int/publications/m/item/weekly-epidemiological-update-on...).
    1. Korber B., Fischer W. M., Gnanakaran S., Yoon H., Theiler J., Abfalterer W., Hengartner N., Giorgi E. E., Bhattacharya T., Foley B., Hastie K. M., Parker M. D., Partridge D. G., Evans C. M., Freeman T. M., de Silva T. I., Sheffield COVID-19 Genomics Group, McDanal C., Perez L. G., Tang H., Moon-Walker A., Whelan S. P., LaBranche C. C., Saphire E. O., Montefiori D. C., Tracking Changes in SARS-CoV-2 Spike: Evidence that D614G Increases Infectivity of the COVID-19 Virus. Cell. 182, 812–827.e19 (2020). - PMC - PubMed
    1. Hou Y. J., Chiba S., Halfmann P., Ehre C., Kuroda M., Dinnon K. H. 3rd, Leist S. R., Schäfer A., Nakajima N., Takahashi K., Lee R. E., Mascenik T. M., Graham R., Edwards C. E., Tse L. V., Okuda K., Markmann A. J., Bartelt L., de Silva A., Margolis D. M., Boucher R. C., Randell S. H., Suzuki T., Gralinski L. E., Kawaoka Y., Baric R. S., SARS-CoV-2 D614G variant exhibits efficient replication ex vivo and transmission in vivo. Science. 370, 1464–1468 (2020). - PMC - PubMed
    1. Weissman D., Alameh M.-G., de Silva T., Collini P., Hornsby H., Brown R., LaBranche C. C., Edwards R. J., Sutherland L., Santra S., Mansouri K., Gobeil S., McDanal C., Pardi N., Hengartner N., Lin P. J. C., Tam Y., Shaw P. A., Lewis M. G., Boesler C., Şahin U., Acharya P., Haynes B. F., Korber B., Montefiori D. C., D614G Spike Mutation Increases SARS CoV-2 Susceptibility to Neutralization. Cell Host Microbe. 29, 23–31.e4 (2021). - PMC - PubMed
    1. Tracking SARS-CoV-2 variants, (available at https://www.who.int/en/activities/tracking-SARS-CoV-2-variants).

Publication types