. 2022 Jul 4:13:848168.
doi: 10.3389/fimmu.2022.848168. eCollection 2022.

Increased Development of Th1, Th17, and Th1.17 Cells Under T1 Polarizing Conditions in Juvenile Idiopathic Arthritis

Affiliations

Increased Development of Th1, Th17, and Th1.17 Cells Under T1 Polarizing Conditions in Juvenile Idiopathic Arthritis

Anna E Patrick et al. Front Immunol. .

Abstract

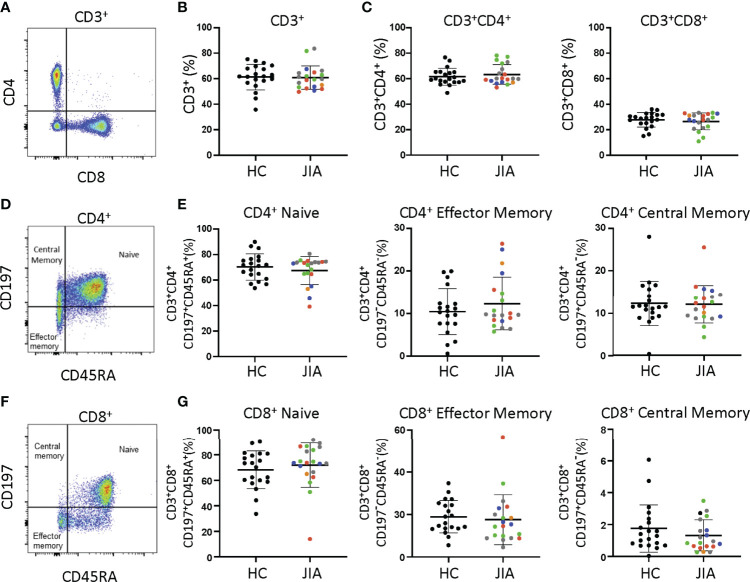
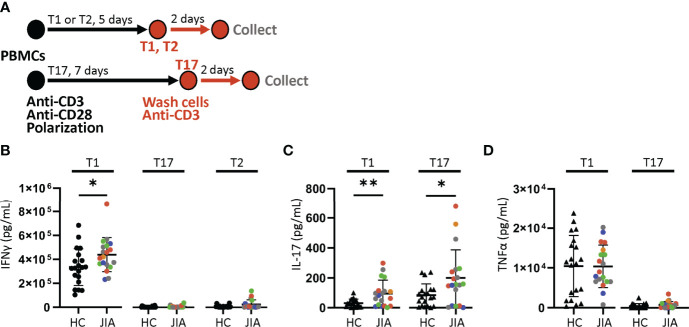
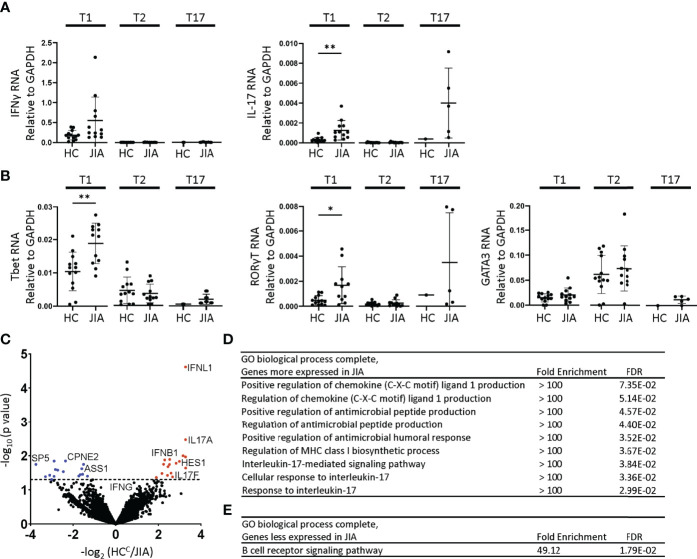
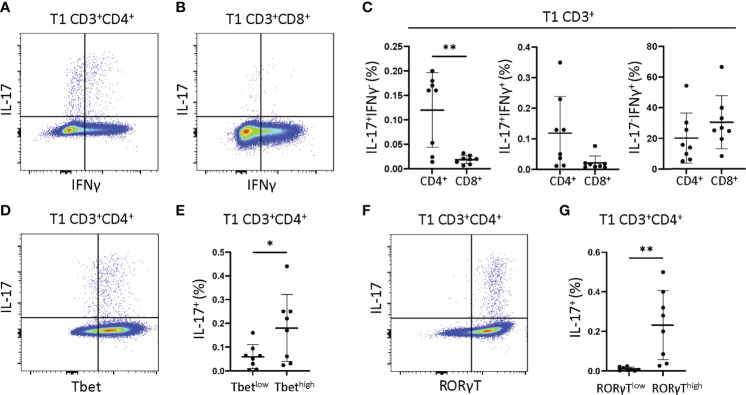
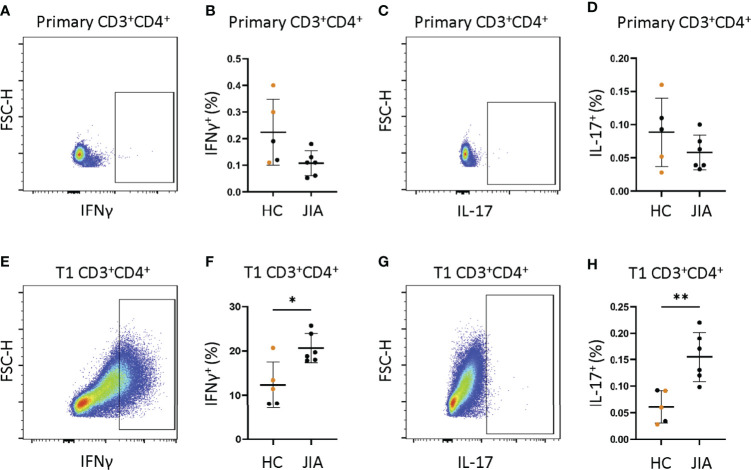
In juvenile idiopathic arthritis (JIA) inflammatory T cells and their produced cytokines are drug targets and play a role in disease pathogenesis. Despite their clinical importance, the sources and types of inflammatory T cells involved remain unclear. T cells respond to polarizing factors to initiate types of immunity to fight infections, which include immunity types 1 (T1), 2 (T2), and 3 (T17). Polarizing factors drive CD4+ T cells towards T helper (Th) cell subtypes and CD8+ T cells towards cytotoxic T cell (Tc) subtypes. T1 and T17 polarization are associated with autoimmunity and production of the cytokines IFNγ and IL-17 respectively. We show that JIA and child healthy control (HC) peripheral blood mononuclear cells are remarkably similar, with the same frequencies of CD4+ and CD8+ naïve and memory T cell subsets, T cell proliferation, and CD4+ and CD8+ T cell subsets upon T1, T2, and T17 polarization. Yet, under T1 polarizing conditions JIA cells produced increased IFNγ and inappropriately produced IL-17. Under T17 polarizing conditions JIA T cells produced increased IL-17. Gene expression of IFNγ, IL-17, Tbet, and RORγT by quantitative PCR and RNA sequencing revealed activation of immune responses and inappropriate activation of IL-17 signaling pathways in JIA polarized T1 cells. The polarized JIA T1 cells were comprised of Th and Tc cells, with Th cells producing IFNγ (Th1), IL-17 (Th17), and both IFNγ-IL-17 (Th1.17) and Tc cells producing IFNγ (Tc1). The JIA polarized CD4+ T1 cells expressed both Tbet and RORγT, with higher expression of the transcription factors associated with higher frequency of IL-17 producing cells. T1 polarized naïve CD4+ cells from JIA also produced more IFNγ and more IL-17 than HC. We show that in JIA T1 polarization inappropriately generates Th1, Th17, and Th1.17 cells. Our data provides a tool for studying the development of heterogeneous inflammatory T cells in JIA under T1 polarizing conditions and for identifying pathogenic immune cells that are important as drug targets and diagnostic markers.

Keywords: T cell; T helper cell (Th); Th1 polarization; Th1.17; Th17; interferon gamma (IFNγ); interleukin 17 (IL-17); juvenile idiopathic arthritis (JIA).


Conflict of interest statement

The authors declare that the research was conducted in the absence of any commercial or financial relationships that could be construed as a potential conflict of interest.

Figures

Figure 1
Figure 1
T cell subsets from child healthy control (HC) and JIA are the same. HC and JIA PBMCs analyzed with flow cytometry for CD3+, CD3+CD4+, and CD3+CD8+ cells and for naïve (CD197+CD45RA+), central memory (CD197+CD45RA-), and effector memory (CD197-CD45RA-) cell subsets. JIA are colored based on current use of methotrexate (green), biologic (blue), methotrexate and biologic (gray), prednisone (orange), and none or NSAID (red). (A) Representative flow cytometry plot of CD3+ cells. (B) Analysis of CD3+ cell frequency. (C) Analysis of CD3+CD4+ and CD3+CD8+ cell frequencies. (D) Representative flow cytometry plot of CD3+CD4+ cells. (E) Analysis of naïve, effector memory, and central memory frequency of CD3+CD4+ cells. (F) Representative flow cytometry plot of CD3+CD8+ cells. (G) Analysis of naïve, effector memory, and central memory frequency of CD3+CD8+ cells. HC (N=20) and JIA (N=20). Shown is mean with standard deviation. Analysis by Welch’s t-test. No significant differences.
Figure 2
Figure 2
Increased production of IFNγ and IL-17 from JIA polarized T cells. T1, T2, and T17 cells were polarized in vitro from child healthy control (HC) and JIA PBMCs. JIA are colored based on current use of methotrexate (green), biologic (blue), methotrexate and biologic (gray), prednisone (orange), and none or NSAID (red). (A) Schematic of polarization showing PBMCs treated with anti-CD3, anti-CD28 and polarization conditions for 5 days for T1 and T2 cells or 7 days for T17 cells. The polarization media is then removed, cells are washed, new media without polarization factors added, and activated with anti-CD3. After 2 days, the produced cytokines were analyzed by ELISA. (B) IFNγ produced by T1, T17, and T2 cells for HC and JIA with new diagnosis JIA denoted (red circle). (C) IL-17 produced by T1 and T17 cells for HC and JIA with new diagnosis JIA denoted (red circle). IL-17 was below detection for T2 cells. (D) TNFα produced by T1 and T17 cells for HC and JIA with new diagnosis JIA denoted (red circle). TNFα was below detection for T2 cells. HC (N=20) and JIA (N=19). Shown is mean with standard deviation. Analysis by Welch’s t-test *p < 0.05, **p < 0.01.
Figure 3
Figure 3
Altered gene expression and T1 biologic pathway activation in JIA. RNA expression in child healthy control (HC) and JIA T1, T2, and T17 cells using RT-PCR for (A) IFNγ, IL-17 and (B) Tbet, RORγT, and GATA3. JIA T1 and T2 (N=12), HC T1 and T2 (N=13). JIA T17 (N=5) and HC T17 (N=1). Analysis by Welch’s t-test with *p<0.05, **p<0.01 for T1 and T2 comparisons. (C) Volcano plot of differentially expressed genes in HC (N=3) and JIA (N=3) T1 cultures by RNA sequencing analyzed by DESeq2. Genes overexpressed or underexpressed in JIA with p-value <0.05 (above dashed line). PANTHER Overrepresentation Test from the GO Ontology database for genes (D) overexpressed or (E) underexpressed in JIA.
Figure 4
Figure 4
JIA T1 cells have single IFNγ+ and IL-17+ and dual IFNγ+IL-17+ cells that express Tbet and RORγT. JIA T1 cells were assessed with flow cytometry to identify IFNγ+ and IL-17+ cell subsets. Representative flow cytometry plot from JIA T1 cells showing IFNγ and IL-17 positive cells and gating for (A) CD3+CD4+ cells and (B) CD3+CD8+ cells. (C) JIA T1 CD3+ cell frequency of CD4+ and CD8+ cells that are IFNγ-IL-17+, IFNγ+IL-17+, and IFNγ+IL-17-. (D) Representative flow cytometry plot from JIA T1 CD3+CD4+ cells showing IL-17 and Tbet. (E) JIA T1 CD3+CD4+ cells showing frequency of IL-17 positive cells in Tbetlow and Tbethigh subsets. (F) Representative flow cytometry plot from JIA T1 CD3+CD4+ cells showing IL-17 and RORγT. (G) JIA T1 CD3+CD4+ cells showing frequency of IL-17 positive cells in RORγTlow and RORγThigh subsets. Shown is mean with standard deviation. Analysis by Welch’s t-test with *p<0.05, **p<0.01.
Figure 5
Figure 5
JIA naïve CD4+ cells become IFNγ and IL-17 producers under T1 polarizing conditions. Naïve CD4+ cells JIA (n=6) and HC (n=3 adult (orange) and 2 child healthy controls (black)) were analyzed by flow cytometry for production of IFNγ and IL-17 in primary cells and T1 polarized cells. (A) Representative flow cytometry plot from JIA primary naïve CD4+ cells showing IFNγ positive cells. (B) Primary naïve CD4+ cells frequency of IFNγ positive cells in HC and JIA. (C) Representative flow cytometry plot from JIA primary naïve CD4+ cells showing IL-17 positive cells. (D) Primary naïve CD4+ cells frequency of IL-17 positive cells in HC and JIA. (E) Representative flow cytometry plot from JIA T1 polarized naïve CD4+ cells showing IFNγ positive cells. (F) T1 polarized naïve CD4+ cells frequency of IFNγ positive cells in HC and JIA. (G) Representative flow cytometry plot from JIA T1 polarized naïve CD4+ cells showing IL-17 positive cells. (H) T1 polarized naïve CD4+ cells frequency of IL-17 positive cells in HC and JIA. Shown is mean with standard deviation. Analysis by Welch’s t-test with *p<0.05, **p<0.01.

Similar articles

Cited by

References

    1. Oberle EJ, Harris JG, Verbsky JW. Polyarticular Juvenile Idiopathic Arthritis - Epidemiology and Management Approaches. Clin Epidemiol (2014) 6:379–93. doi: 10.2147/CLEP.S53168 - DOI - PMC - PubMed
    1. Hinze C, Gohar F, Foell D. Management of Juvenile Idiopathic Arthritis: Hitting the Target. Nat Rev Rheumatol (2015) 11(5):290–300. doi: 10.1038/nrrheum.2014.212 - DOI - PubMed
    1. Guzman J, Oen K, Huber AM, Watanabe Duffy K, Boire G, Shiff N, et al. . The Risk and Nature of Flares in Juvenile Idiopathic Arthritis: Results From the ReACCh-Out Cohort. Ann Rheum Dis (2016) 75(6):1092–8. doi: 10.1136/annrheumdis-2014-207164 - DOI - PubMed
    1. Guzman J, Oen K, Tucker LB, Huber AM, Shiff N, Boire G, et al. . The Outcomes of Juvenile Idiopathic Arthritis in Children Managed With Contemporary Treatments: Results From the ReACCh-Out Cohort. Ann Rheum Dis (2015) 74(10):1854–60. doi: 10.1136/annrheumdis-2014-205372 - DOI - PubMed
    1. Brunner HI, Schanberg LE, Kimura Y, Dennos A, Co DO, Colbert RA, et al. . New Medications Are Needed for Children With Juvenile Idiopathic Arthritis. Arthritis Rheumatol (2020) 72(11):1945–51. doi: 10.1002/art.41390 - DOI - PMC - PubMed

Substances