. 2022 Jul 4:13:901111.
doi: 10.3389/fimmu.2022.901111. eCollection 2022.

White Spot Syndrome Virus Triggers a Glycolytic Pathway in Shrimp Immune Cells (Hemocytes) to Benefit Its Replication

Affiliations

White Spot Syndrome Virus Triggers a Glycolytic Pathway in Shrimp Immune Cells (Hemocytes) to Benefit Its Replication

Yen Siong Ng et al. Front Immunol. .

Abstract

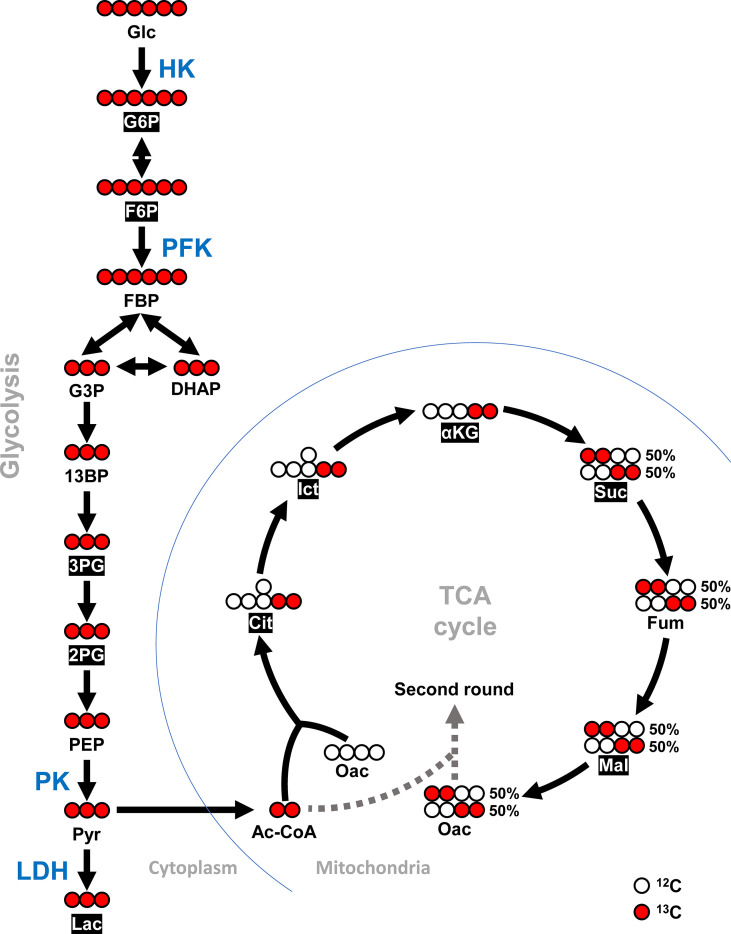
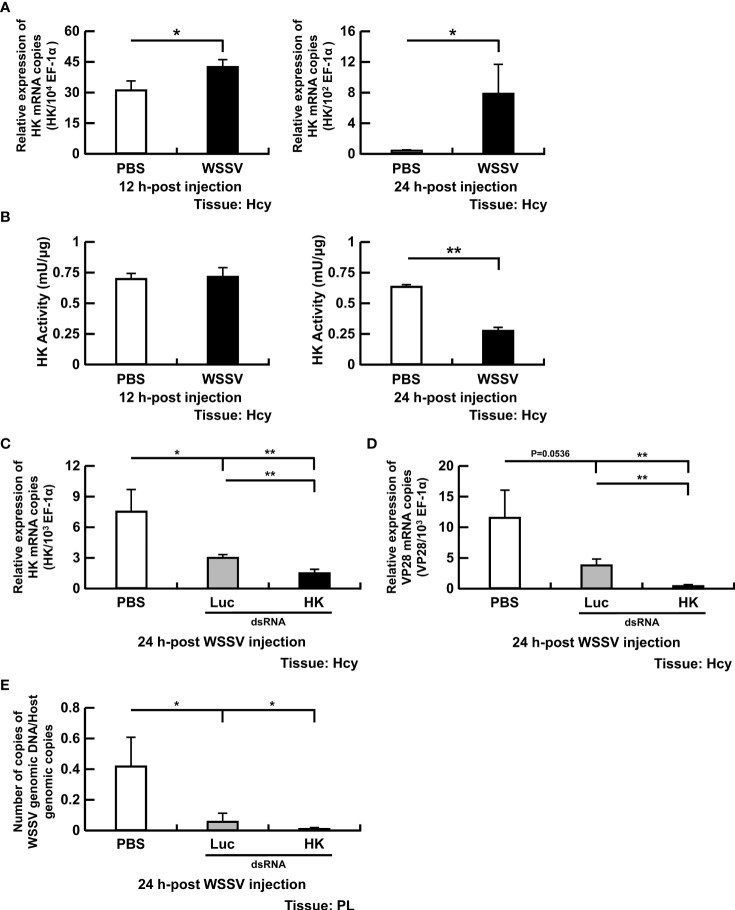
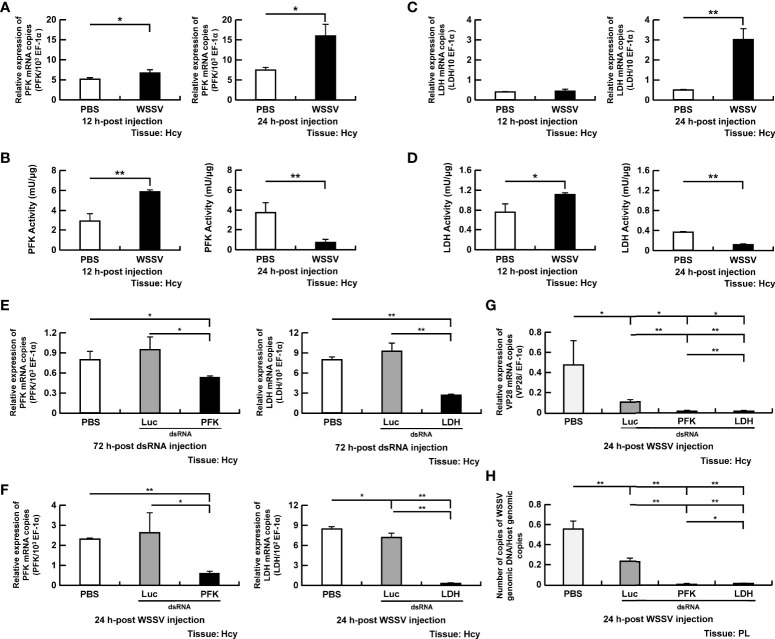
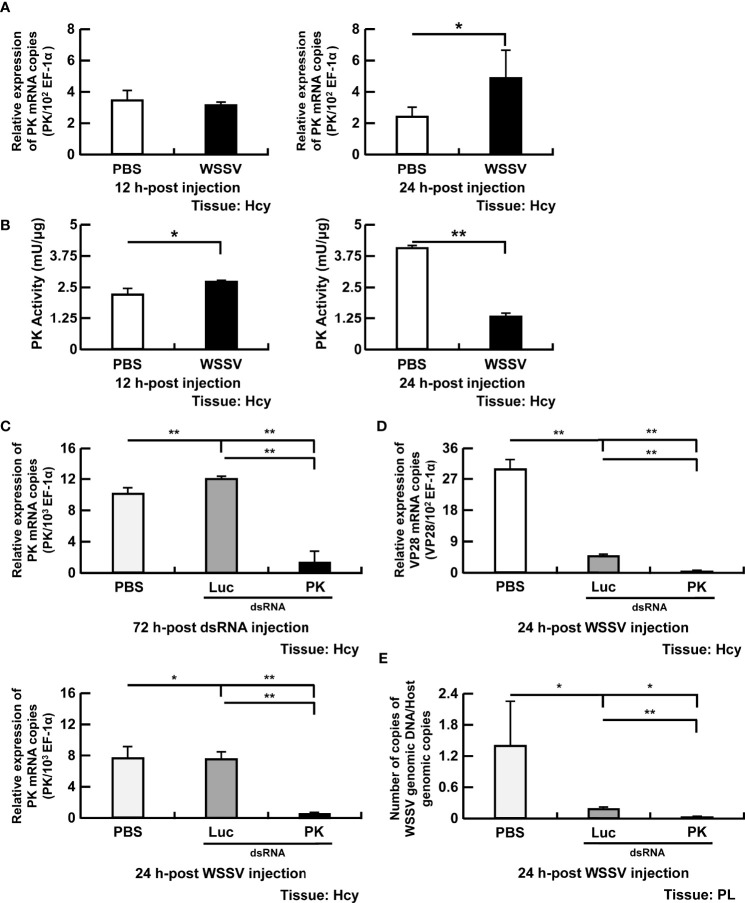
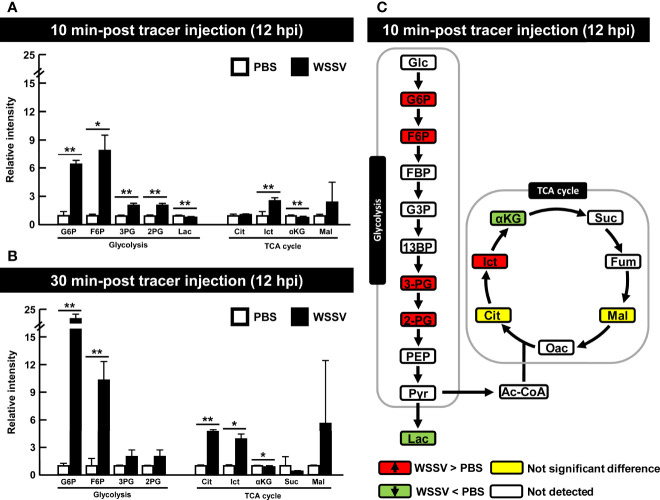
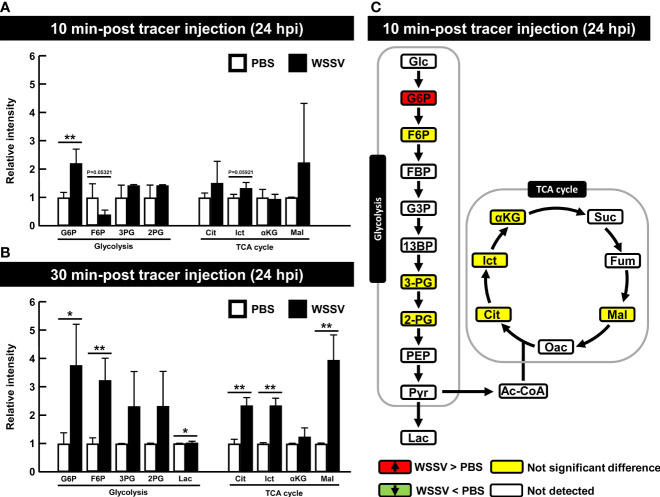
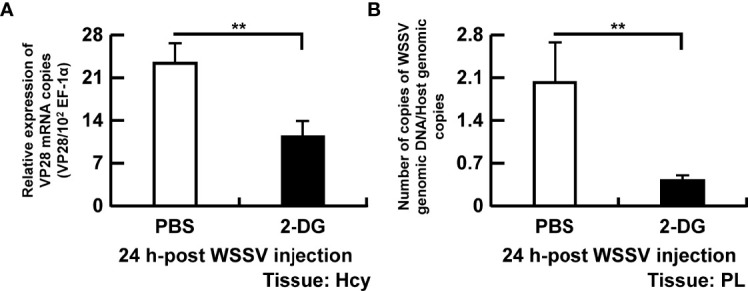
White spot syndrome virus (WSSV) is the causative agent of a shrimp disease that inflicts in huge economic losses in shrimp-farming industry. WSSV triggers aerobic glycolysis in shrimp immune cells (hemocytes), but how this virus regulates glycolytic enzymes or pathway is yet to be characterized. Therefore, mRNA levels and activity of four important glycolytic enzymes, Hexokinase (HK), Phosphofructokinase (PFK), Pyruvate kinase (PK), and Lactate dehydrogenase (LDH), were measured in WSSV-infected shrimp hemocytes. Gene expression of HK and PFK, but not LDH or PK, was increased at the viral genome replication stage (12 hpi); furthermore, activity of these enzymes, except HK, was concurrently increased. However, there was no increased enzyme activity at the viral late stage (24 hpi). In vivo dsRNA silencing and glycolysis disruption by 2-DG further confirmed the role of glycolysis in virus replication. Based on tracing studies using stable isotope labeled glucose, glycolysis was activated at the viral genome replication stage, but not at the viral late stage. This study demonstrated that WSSV enhanced glycolysis by activating glycolytic enzyme at the viral genome replication stage, providing energy and biomolecules for virus replication.

Keywords: glycolysis; hexokinase; lactate dehydrogenase; phosphofructokinase; pyruvate kinase; stable isotope tracing; white shrimp; white spot syndrome virus.


Conflict of interest statement

The authors declare that the research was conducted in the absence of any commercial or financial relationships that could be construed as a potential conflict of interest.

Figures

Figure 1
Figure 1
Schematic diagram of [U-13C] glucose entering TCA cycle via glycolysis. Detected 13C metabolites in this study are shown in white font within black boxes. Red circles represent carbon-13 (13C) and white circles represent carbon-12 (12C). This diagram was adapted and modified from McDonald et al. (23) and Courtney et al. (24). For metabolites, Glc, Glucose; G6P, Glucose-6-phosphate; F6P, Fructose-6-phosphate; FBP, Fructose 1,6-biphosphate; G3P, Glyceraldehyde-3-phosphate; DHAP, Dihydroxyacetone phosphate; 13BP, 1,3-Bisphosphoglycerate; 3PG, 3-Phosphoglycerate; 2PG, 2-Phosphoglycerate; PEP, Phosphoenolpyruvate; Pyr, Pyruvate; Lac, Lactate; Ac-CoA, Acetyl-CoA; Cit, Citrate; Ict, Isocitrate; αKG, α-Ketoglutarate; Suc, Succinate; Fum, Fumarate; Mal, Malate; and Oac, Oxaloacetate. For enzymes, HK, Hexokinase; PFK, Phosphofructokinase; PK, Pyruvate kinase; and LDH, Lactate dehydrogenase.
Figure 2
Figure 2
Participation of HK in WSSV replication. (A, B) The mRNA levels and enzyme activity of HK in shrimp hemocytes during WSSV infection. (C) For HK dsRNA silencing, gene expression of HK in shrimp hemocytes was analyzed by real-time PCR at 24 h post WSSV injection. (D, E) Effects of gene silencing of HK on expression of the WSSV structural gene VP28 and WSSV genome copy numbers at 24 h post WSSV injection. Groups treated with PBS only or with non-specific luciferase (Luc) dsRNA were used as control groups. WSSV genome copy numbers was 484-fold decreased in HK dsRNA group in relative to Luc dsRNA group. Each bar represents the mean ± SD. Asterisks indicate differences between indicated groups (*p < 0.05; **p < 0.01). Hcy: Hemocytes; and PL, Pleopods.
Figure 3
Figure 3
Participation of PFK and LDH in WSSV replication (A, B) The mRNA levels and enzyme activity of PFK in shrimp hemocytes during WSSV infection. (C, D) The mRNA levels and enzyme activity of LDH in shrimp hemocytes during WSSV infection. (E) For PFK and LDH dsRNA silencing, gene expression of PFK and LDH in shrimp hemocytes was analyzed by real-time PCR at 72 h post injection of the corresponding dsRNA and before WSSV challenge. (F) Gene expression of the above genes was measured again in dsRNA-treated shrimp at 24 h post WSSV infection. (G H) The effect of gene silencing of PFK and LDH on the expression of the WSSV structural gene VP28 and WSSV genome copy numbers at 24 h post WSSV injection. Groups treated with PBS only or with non-specific luciferase (Luc) dsRNA were used as control groups. WSSV genome copy numbers were 79-fold and 18-fold decreased in PFK and LDH dsRNA group respectively, compared to Luc dsRNA group. Each bar represents the mean ± SD. Asterisks indicate differences between the indicated groups (*p < 0.05; **p < 0.01). Hcy, Hemocytes, PL, Pleopods.
Figure 4
Figure 4
Participation of PK in WSSV replication. (A, B) The mRNA levels and enzyme activity of PK in shrimp hemocytes during WSSV infection. (C) For PK dsRNA silencing, gene expression of PK in shrimp hemocytes was analyzed by real-time PCR at 72 h post injection of the PK dsRNA and before WSSV challenge. PK gene expression was measured again in dsRNA-treated shrimp at 24 h post WSSV injection. (D, E) Effects of gene silencing of PK on expression of the WSSV structural gene VP28 and WSSV genome copy numbers at 24 h post WSSV injection. Groups treated with PBS only or with non-specific luciferase (Luc) dsRNA were used as control groups. WSSV genome copy numbers was 225-fold decreased in PK dsRNA group in relative to Luc dsRNA group. Each bar represents the mean ± SD. Asterisks indicate differences between the indicated groups (*p < 0.05; **p < 0.01). Hcy, Hemocytes; and PL, Pleopods.
Figure 5
Figure 5
WSSV activated glycolysis at the viral genome replication stage (12 hpi). At 12h after challenge with WSSV or PBS, shrimp were injected with [U-13C] glucose and hemocytes were collected after (A) 10 min or (B) 30 min of tracer injection. Metabolomic data were generated with LC-ESI-Q-TOF-MS. Fold change of each 13C metabolites in WSSV group compared to the corresponding 13C metabolites in PBS group was calculated. Each bar represents the mean ± SD. Asterisks indicate differences between WSSV and PBS groups (*p < 0.05; **p < 0.01). (C) Overview of changes of 13C metabolites in WSSV-infected shrimp (12 hpi) at 10 min post [U-13C] glucose injection. Changes in the WSSV group relative to the corresponding PBS control were rated as a significant increase (Red), no significant difference (Yellow), a significant decrease (Green), or not detected (White). Abbreviations are the same as those used in Figure 1 .
Figure 6
Figure 6
WSSV-infected hemocytes had inactivated glycolysis at the viral late stage (24 hpi) At 24 h after challenge with WSSV or PBS, shrimp were injected with [U-13C] glucose and hemocytes were collected after (A) 10 min or (B) 30 min of tracer injection. Metabolomic data were generated with LC-ESI-Q-TOF-MS. Fold change of each 13C metabolites in WSSV group compared to the corresponding 13C metabolites in PBS group was calculated. Each bar represents the mean ± SD. Asterisks indicate differences between WSSV and PBS groups (*p < 0.05; **p < 0.01). (C) Overview of changes of 13C metabolites in WSSV-infected shrimp (24 hpi) at 10 min post [U-13C] glucose injection. Changes in the WSSV group relative to the corresponding PBS control were rated as a significant increase (Red), no significant difference (Yellow), a significant decrease (Green), or not detected (White). Abbreviations are as in Figure 1 .
Figure 7
Figure 7
Disruption of glycolysis hinders WSSV replication. To determine the importance of glycolysis in WSSV replication, shrimp were injected with 0.5 mg/g of 2-DG twice before the WSSV challenge and the analysis done 24 h after WSSV challenge. (A) Gene expression of WSSV structural gene VP28 in shrimp hemocytes. (B) WSSV genome copy numbers quantified in pleopods. WSSV genome copy numbers was 5-fold decreased in the 2-DG injected group compared to the PBS injected group. Each bar represents the mean ± SD. Asterisks indicate differences between WSSV and PBS groups (**p < 0.01). Hcy, Hemocytes; and PL, Pleopods.

Similar articles

Cited by

References

    1. Thaker SK, Ch’ng J, Christofk HR. Viral Hijacking of Cellular Metabolism. BMC Biol (2019) 17:59. doi: 10.1186/s12915-019-0678-9 - DOI - PMC - PubMed
    1. Sanchez EL, Lagunoff M. Viral Activation of Cellular Metabolism. Virol (2015) 479-480:609–18. doi: 10.1016/j.virol.2015.02.038 - DOI - PMC - PubMed
    1. Eisenreich W, Rudel T, Heesemann J, Goebel W. How Viral and Intracellular Bacterial Pathogens Reprogram the Metabolism of Host Cells to Allow Their Intracellular Replication. Front Cell Infect Microbiol (2019) 9:42. doi: 10.3389/fcimb.2019.00042 - DOI - PMC - PubMed
    1. Boodhoo N, Kamble N, Sharif S, Behboudi S. Glutaminolysis and Glycolysis are Essential for Optimal Replication of Marek’s Disease Virus. J Virol (2020) 94:e01680-19. doi: 10.1128/JVI.01680-19 - DOI - PMC - PubMed
    1. Findlay JS, Ulaeto D. Semliki Forest Virus and Sindbis Virus, But Not Vaccinia Virus, Require Glycolysis for Optimal Replication. J Gen Virol (2015) 96:2693–6. doi: 10.1099/jgv.0.000226 - DOI - PubMed

Publication types

Substances

LinkOut - more resources