

TLR7 Activation Accelerates Cardiovascular Pathology in a Mouse Model of Lupus
- PMID: 35860280
- PMCID: PMC9289616
- DOI: 10.3389/fimmu.2022.914468
TLR7 Activation Accelerates Cardiovascular Pathology in a Mouse Model of Lupus
Abstract
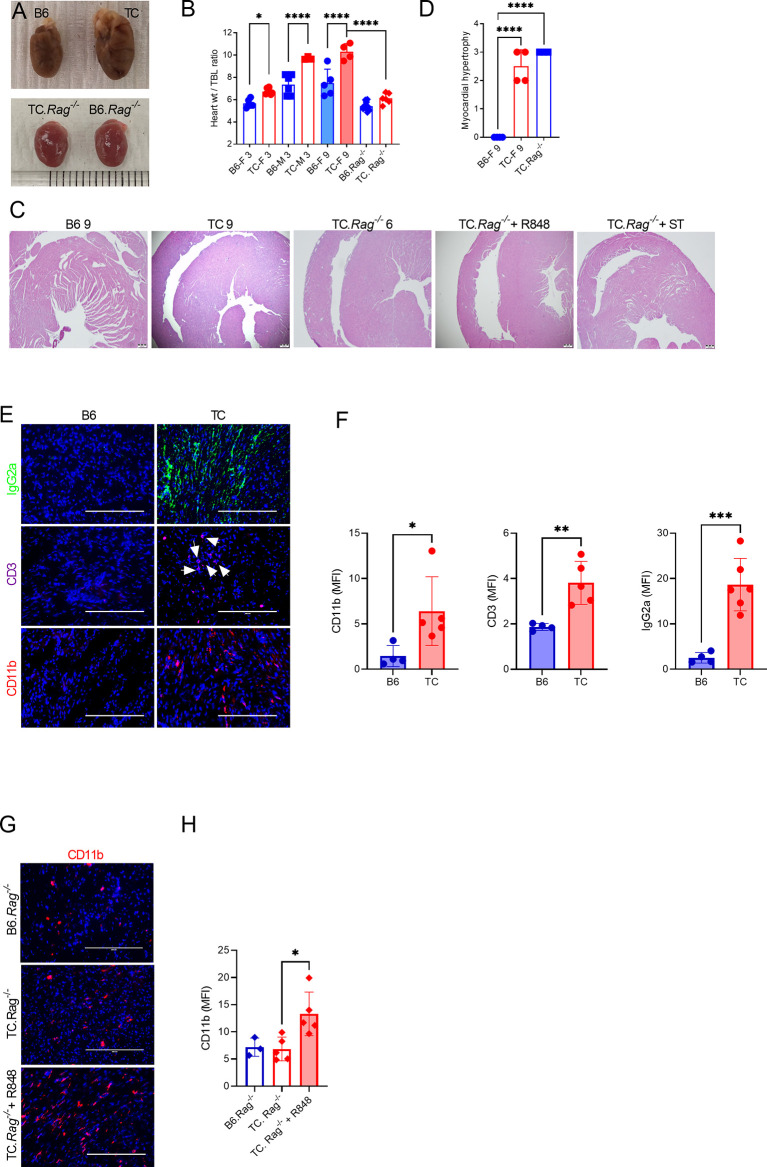
We report a novel model of lupus-associated cardiovascular pathology accelerated by the TLR7 agonist R848 in lupus-prone B6.Sle1.Sle2.Sle3 (TC) mice. R848-treated TC mice but not non-autoimmune C57BL/6 (B6) controls developed microvascular inflammation and myocytolysis with intracellular vacuolization. This histopathology was similar to antibody-mediated rejection after heart transplant, although it did not involve complement. The TC or B6 recipients of serum or splenocytes from R848-treated TC mice developed a reactive cardiomyocyte hypertrophy, which also presents spontaneously in old TC mice as well as in TC.Rag-/- mice that lack B and T cells. Each of these cardiovascular lesions correspond to abnormalities that have been reported in lupus patients. Lymphoid and non-lymphoid immune cells as well as soluble factors contribute to lupus-associated cardiovascular lesions in TC mice, which can now be dissected using this model with and without R848 treatment.
Keywords: TLR7; autoimmunity; cardiovascular disease; lupus; mouse models.
Copyright © 2022 Elshikha, Teng, Kanda, Li, Choi, Abboud, Terrell, Fredenburg and Morel.
Conflict of interest statement
The authors declare that the research was conducted in the absence of any commercial or financial relationships that could be construed as a potential conflict of interest.
Figures


Similar articles
-
TLR7/TLR8 activation and susceptibility genes synergize to breach gut barrier in a mouse model of lupus.Front Immunol. 2023 Jul 6;14:1187145. doi: 10.3389/fimmu.2023.1187145. eCollection 2023. Front Immunol. 2023. PMID: 37483626 Free PMC article.
-
BANK1 Regulates IgG Production in a Lupus Model by Controlling TLR7-Dependent STAT1 Activation.PLoS One. 2016 May 26;11(5):e0156302. doi: 10.1371/journal.pone.0156302. eCollection 2016. PLoS One. 2016. PMID: 27228057 Free PMC article.
-
B cell autophagy mediates TLR7-dependent autoimmunity and inflammation.Autophagy. 2015;11(7):1010-24. doi: 10.1080/15548627.2015.1052206. Autophagy. 2015. PMID: 26120731 Free PMC article.
-
TLR7 Agonism Accelerates Disease and Causes a Fatal Myeloproliferative Disorder in NZM 2410 Lupus Mice.Front Immunol. 2020 Jan 10;10:3054. doi: 10.3389/fimmu.2019.03054. eCollection 2019. Front Immunol. 2020. PMID: 31998321 Free PMC article.
-
Dysregulated Lymphoid Cell Populations in Mouse Models of Systemic Lupus Erythematosus.Clin Rev Allergy Immunol. 2017 Oct;53(2):181-197. doi: 10.1007/s12016-017-8605-8. Clin Rev Allergy Immunol. 2017. PMID: 28500565 Review.
Cited by
-
Tlr9 expression protects against Tlr7-dependent exocrine gland and systemic disease manifestations in primary Sjögren's disease in a sex-biased manner.J Autoimmun. 2025 Jul 30;156:103467. doi: 10.1016/j.jaut.2025.103467. Online ahead of print. J Autoimmun. 2025. PMID: 40743682 Free PMC article.
-
A Novel Preclinical Murine Model of Systemic Lupus Erythematosus-Like Cardiovascular Disease.ACR Open Rheumatol. 2024 Dec;6(12):891-899. doi: 10.1002/acr2.11744. Epub 2024 Oct 4. ACR Open Rheumatol. 2024. PMID: 39364830 Free PMC article.
-
Cardiac and vascular complications in lupus: Is there a role for sex?Front Immunol. 2023 Mar 29;14:1098383. doi: 10.3389/fimmu.2023.1098383. eCollection 2023. Front Immunol. 2023. PMID: 37063843 Free PMC article. Review.
-
Pharmacologic inhibition of glycolysis prevents the development of lupus by altering the gut microbiome in mice.iScience. 2023 Jun 14;26(7):107122. doi: 10.1016/j.isci.2023.107122. eCollection 2023 Jul 21. iScience. 2023. PMID: 37416482 Free PMC article.
-
TLR7/TLR8 activation and susceptibility genes synergize to breach gut barrier in a mouse model of lupus.Front Immunol. 2023 Jul 6;14:1187145. doi: 10.3389/fimmu.2023.1187145. eCollection 2023. Front Immunol. 2023. PMID: 37483626 Free PMC article.
References
-
- Puntmann VO, D'Cruz D, Smith Z, Pastor A, Choong P, Voigt T, et al. . Native Myocardial T1 Mapping by Cardiovascular Magnetic Resonance Imaging in Subclinical Cardiomyopathy in Patients With Systemic Lupus Erythematosus. Circulation Cardiovasc Imaging (2013) 6:295–301. doi: 10.1161/circimaging.112.000151 - DOI - PubMed
MeSH terms
Substances
Grants and funding
LinkOut - more resources
Full Text Sources