. 2022 Jul 4:13:838780.
doi: 10.3389/fimmu.2022.838780. eCollection 2022.

SARS-CoV-2 Spike- and Nucleoprotein-Specific Antibodies Induced After Vaccination or Infection Promote Classical Complement Activation

Affiliations

SARS-CoV-2 Spike- and Nucleoprotein-Specific Antibodies Induced After Vaccination or Infection Promote Classical Complement Activation

Rachel E Lamerton et al. Front Immunol. .

Abstract

Antibodies specific for the spike glycoprotein (S) and nucleocapsid (N) SARS-CoV-2 proteins are typically present during severe COVID-19, and induced to S after vaccination. The binding of viral antigens by antibody can initiate the classical complement pathway. Since complement could play pathological or protective roles at distinct times during SARS-CoV-2 infection we determined levels of antibody-dependent complement activation along the complement cascade. Here, we used an ELISA assay to assess complement protein binding (C1q) and the deposition of C4b, C3b, and C5b to S and N antigens in the presence of antibodies to SARS-CoV-2 from different test groups: non-infected, single and double vaccinees, non-hospitalised convalescent (NHC) COVID-19 patients and convalescent hospitalised (ITU-CONV) COVID-19 patients. C1q binding correlates strongly with antibody responses, especially IgG1 levels. However, detection of downstream complement components, C4b, C3b and C5b shows some variability associated with the subject group from whom the sera were obtained. In the ITU-CONV, detection of C3b-C5b to S was observed consistently, but this was not the case in the NHC group. This is in contrast to responses to N, where median levels of complement deposition did not differ between the NHC and ITU-CONV groups. Moreover, for S but not N, downstream complement components were only detected in sera with higher IgG1 levels. Therefore, the classical pathway is activated by antibodies to multiple SARS-CoV-2 antigens, but the downstream effects of this activation may differ depending the disease status of the subject and on the specific antigen targeted.

Keywords: COVID-19; SARS-CoV-2; antibodies; complement; vaccine.


Conflict of interest statement

The authors declare that the research was conducted in the absence of any commercial or financial relationships that could be construed as a potential conflict of interest.

Figures

Figure 1
Figure 1
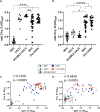
Anti-S, but not anti-N antibody responses differ between NHC and ITU-CONV patients. Using an ELISA against 0.1ug S (A, C) or N (B, D) with HRP-conjugated IgGAM or IgG1 secondary antibodies, GAM and IgG1 levels were assessed in the following subject groups: COVID-19 negatives (NEG, n ≥20), COVID-19 naïve one month post first BNT162b2 vaccine (VACC, n = 9), COVID-19 naïve one month post second BNT162b2 vaccine (DOUBLE VACC, n = 19), COVID-19 positive non-hospitalised convalescents (NHC, n ≥ 19) and COVID-19 positive convalescents who required ITU treatment (ITU-CONV, n ≥ 18) Kruskal-Wallis with Dunn’s multiple comparisons test was used to test significance. a indicates that the four groups bracketed (VACC, DOUBLE VACC, NHC and ITU-CONV) were individually significantly different to the NEG group; b indicates that NHC and ITU-CONV are independently significantly different to NEG, VACC and DOUBLE VACC. ***p < 0.001, **p < 0.01, *p < 0.05. Bars represent median values for each group.
Figure 2
Figure 2
C1q binding to S and N correlates with IgG1 responses. Using an ELISA against 0.1ug S (A) or N (B) with an anti-C1q secondary antibody, followed by an HRP-conjugated tertiary, and the ELAST amplification kit, C1q binding was measured. Correlations of IgG1 OD and C1q OD against S (C) and N (D). NEG, n = 22. VACC, n = 9. DOUBLE VACC n = 19. NHC, n ≥ 21. ITU-CONV n = 20. Kruskal-Wallis with Dunn’s multiple comparisons test was used. a indicates that the four groups bracketed were individually significantly different to the NEG group; b indicates that NHC and ITU-CONV are independently significantly different to NEG and DOUBLE VACC. ****p < 0.0001, ***p <0.001 **p < 0.01, *p <0.05. Bars represent median values for each group. Correlations were determined using the Spearman’s rank correlation test (r and p values presented).
Figure 3
Figure 3
C4b, C3b and C5b show antigen and subject status-dependent variability. Using an ELISA against 0.1ug S (A) or N (B) with either anti-C4b, C3b or C5b secondary antibody, followed by an HRP-conjugated tertiary, downstream complement binding was measured. NEG, n = 22. VACC, n = 9. DOUBLE VACC, n = 19. NHC, n = 22. ITU-CONV n = 20. Kruskal-Wallis with Dunn’s multiple comparisons test was used. a and b indicate that the groups bracketed were individually significantly different to the NEG group; c indicates that NHC and ITU-CONV are independently significantly different to NEG, VACC and DOUBLE VACC; d indicates that DOUBLE VACC, NHC and ITU-CONV are all significantly different to NEG; e indicates that NHC and ITU-CONV are both significantly different to DOUBLE VACC. ****p < 0.0001, ***p < 0.001, **p < 0.01, *p < 0.05. Bars represent median values for each group.
Figure 4
Figure 4
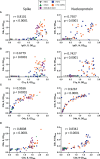
Threshold levels of IgG1 associate with the detection of C4b. (A) XY scatter plots for C4b responses and IgG1 responses, (B) C4b and C1q, (C) C3b and C4b and (D) C5b and C3b against S (left) or N (right). XY pairs, n ≥ 91, each point represents one serum. Correlations were determined using the Spearman's rank correlation test (r and p values presented).
Figure 5
Figure 5
Complement activation by sera with low levels of IgM to S and N. (A) Left hand panel shows the IgM levels plotted against levels of C1q for S (left hand panel; results for 91 sera presented from NEG, VACC, DOUBLE VACC, NHC and ITU-CONV donors). The IgG1 levels for sera presented in the blue box (IgMloC1qhi) or red box (IgMloC1qlo) are shown in the central graph and for IgG3 in the right hand graph (n ≥ 18 for each group). Each coloured dot represents one sera from the corresponding coloured box. (B) As for a, but the anti-N response is presented. (C, D), as for (A, B) respectively but with the results for C3b binding shown rather than C1q. Correlations were determined using the Spearman’s rank correlation test (r and p values presented). Mann-Whitney was used to test significance in the IgG1 and IgG3 column graphs, where ****p < 0.0001 and ***p < 0.001. Bars represent median values for each group.

References

    1. Docherty AB, Harrison EM, Green CA, Hardwick HE, Pius R, Norman L, et al. Features of 20133 UK Patients in Hospital With Covid-19 Using the ISARIC WHO Clinical Characterisation Protocol: Prospective Observational Cohort Study. BMJ-British Med J (2020) 369:12. doi: 10.1136/bmj.m1985 - DOI - PMC - PubMed
    1. Petrilli CM, Jones SA, Yang J, Rajagopalan H, O'Donnell L, Chernyak Y, et al. Factors Associated With Hospital Admission and Critical Illness Among 5279 People With Coronavirus Disease 2019 in New York City: Prospective Cohort Study. BMJ-British Med J (2020) 369:15. doi: 10.1136/bmj.m1966 - DOI - PMC - PubMed
    1. Shields AM, Faustini SE, Perez-Toledo M, Jossi S, Allen JD, Al-Taei S, et al. Serological Responses to SARS-CoV-2 Following non-Hospitalised Infection: Clinical and Ethnodemographic Features Associated With the Magnitude of the Antibody Response. BMJ Open Respir Res (2021) 8(1):e000872. doi: 10.1136/bmjresp-2020-000872 - DOI - PMC - PubMed
    1. Walls AC, Park YJ, Tortorici MA, Wall A, McGuire AT, Veesler D. Structure, Function, and Antigenicity of the SARS-CoV-2 Spike Glycoprotein. Cell (2020) 181(2):281–92. doi: 10.1016/j.cell.2020.02.058 - DOI - PMC - PubMed
    1. Shields AM, Faustini SE, Kristunas CA, Cook AM, Backhouse C, Dunbar L, et al. COVID-19: Seroprevalence and Vaccine Responses in UK Dental Care Professionals. J Dental Res (2021) 100(11):1220–7. doi: 10.1177/00220345211020270 - DOI - PMC - PubMed

Publication types