

Vegetation Formation in Staphylococcus Aureus Endocarditis Inversely Correlates With RNAIII and sarA Expression in Invasive Clonal Complex 5 Isolates
- PMID: 35860377
- PMCID: PMC9289551
- DOI: 10.3389/fcimb.2022.925914
Vegetation Formation in Staphylococcus Aureus Endocarditis Inversely Correlates With RNAIII and sarA Expression in Invasive Clonal Complex 5 Isolates
Abstract
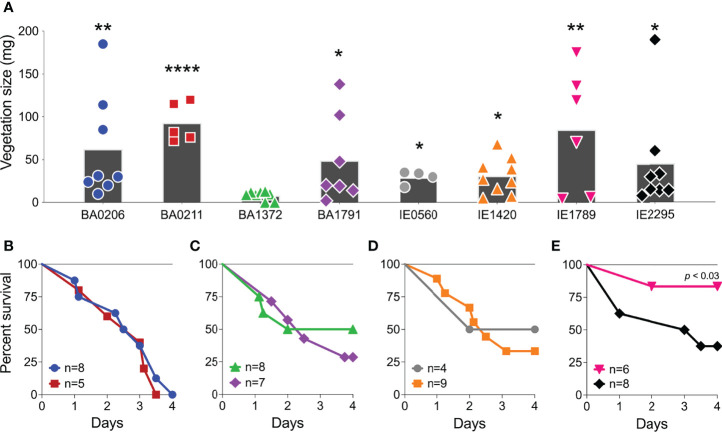
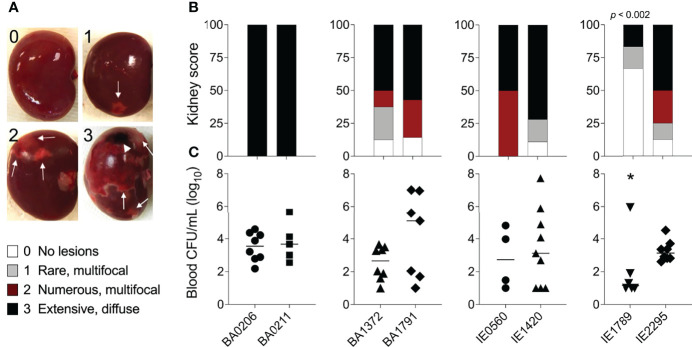
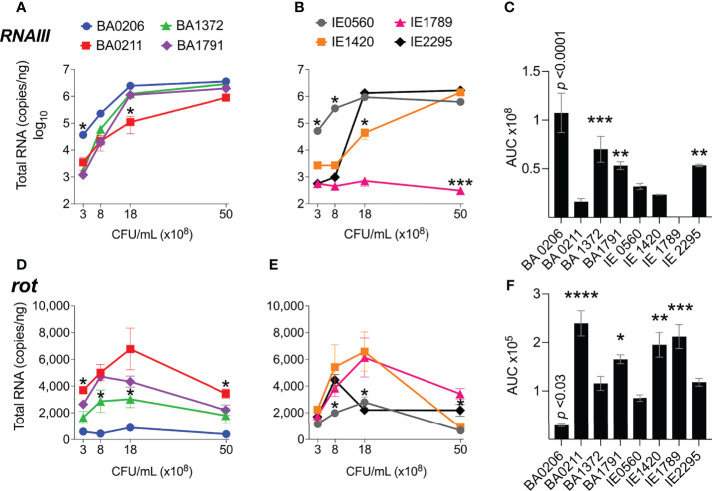
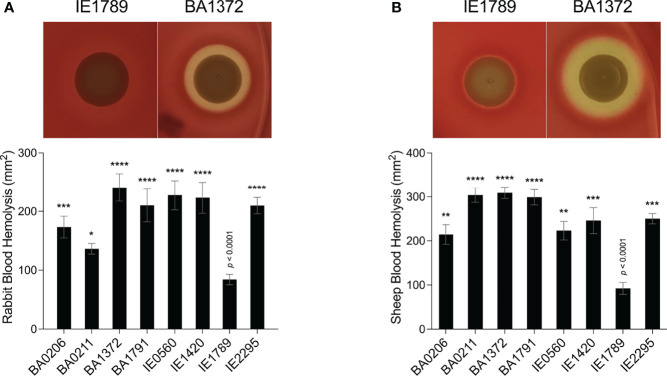
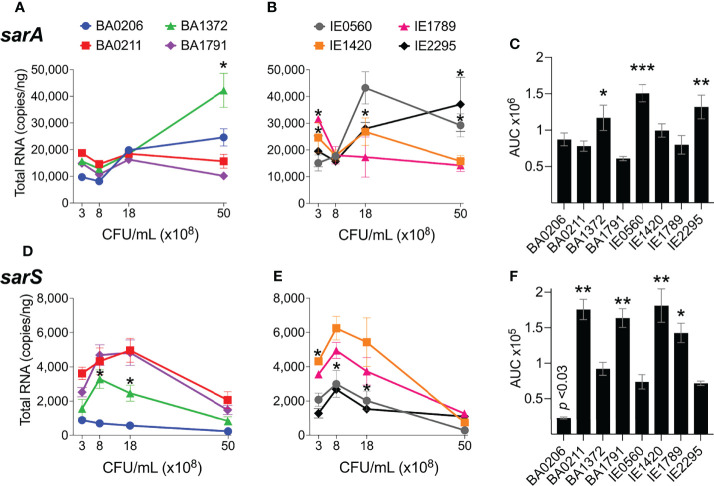
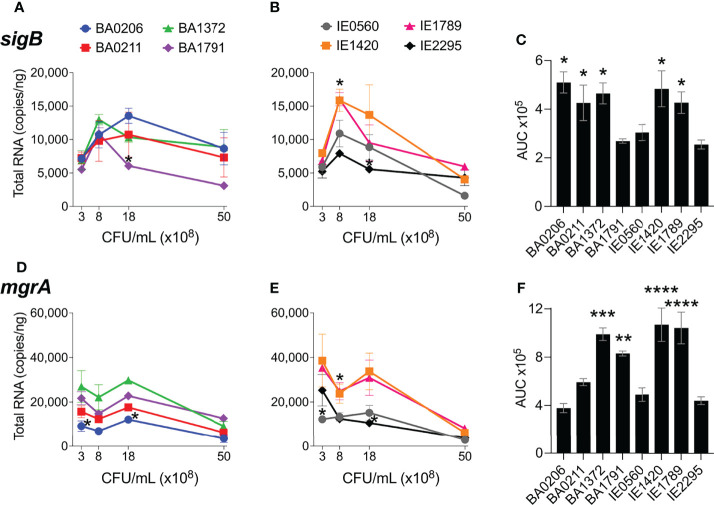
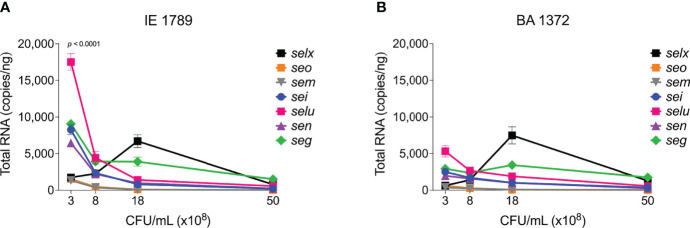
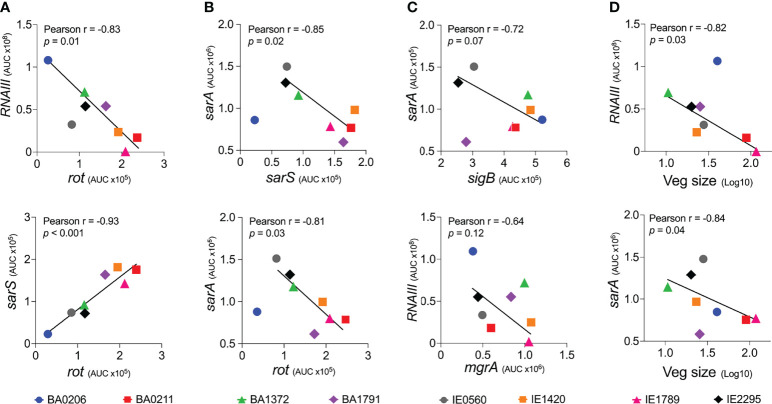
Infective endocarditis (IE) is one of the most feared and lethal diseases caused by Staphylococcus aureus. Once established, the infection is fast-progressing and tissue destructive. S. aureus of the clonal complex 5 (CC5) commonly cause IE yet are severely understudied. IE results from bacterial colonization and formation of tissue biofilms (known as vegetations) on injured or inflamed cardiac endothelium. S. aureus IE is promoted by adhesins, coagulases, and superantigens, with the exotoxins and exoenzymes likely contributing to tissue destruction and dissemination. Expression of the large repertoire of virulence factors required for IE and sequelae is controlled by complex regulatory networks. We investigated the temporal expression of the global regulators agr (RNAIII), rot, sarS, sarA, sigB, and mgrA in 8 invasive CC5 isolates and established intrinsic expression patterns associated with IE outcomes. We show that vegetation formation, as tested in the rabbit model of IE, inversely correlates with RNAIII and sarA expression during growth in Todd-Hewitt broth (TH). Large vegetations with severe sequelae arise from strains with high-level expression of colonization factors but slower transition towards expression of the exotoxins. Overall, strains proficient in vegetation formation, a hallmark of IE, exhibit lower expression of RNAIII and sarA. Simultaneous high expression of RNAIII, sarA, sigB, and mgrA is the one phenotype assessed in this study that fails to promote IE. Thus, RNAIII and sarA expression that provides for rheostat control of colonization and virulence genes, rather than an on and off switch, promote both vegetation formation and lethal sepsis.
Keywords: AGR; CC5; RNAIII; SarA; endocarditis; staphylococcus aureus.
Copyright © 2022 Kinney, Stach, Kulhankova, Brown and Salgado-Pabón.
Conflict of interest statement
KK is currently an employee of Integrated DNA Technologies, which sells reagents used or like those used in this manuscript. The remaining authors declare that the research was conducted in the absence of any commercial or financial relationships that could be constructed as a potential conflict of interest.
Figures
Similar articles
-
Coordinated and differential control of aureolysin (aur) and serine protease (sspA) transcription in Staphylococcus aureus by sarA, rot and agr (RNAIII).Int J Med Microbiol. 2006 Oct;296(6):365-80. doi: 10.1016/j.ijmm.2006.02.019. Epub 2006 Jun 19. Int J Med Microbiol. 2006. PMID: 16782403
-
Relationship of agr expression and function with virulence and vancomycin treatment outcomes in experimental endocarditis due to methicillin-resistant Staphylococcus aureus.Antimicrob Agents Chemother. 2011 Dec;55(12):5631-9. doi: 10.1128/AAC.05251-11. Epub 2011 Oct 3. Antimicrob Agents Chemother. 2011. PMID: 21968365 Free PMC article.
-
Activation and transcriptional interaction between agr RNAII and RNAIII in Staphylococcus aureus in vitro and in an experimental endocarditis model.J Infect Dis. 2002 Sep 1;186(5):668-77. doi: 10.1086/342046. Epub 2002 Aug 9. J Infect Dis. 2002. PMID: 12195354
-
The SarA protein family of Staphylococcus aureus.Int J Biochem Cell Biol. 2008;40(3):355-61. doi: 10.1016/j.biocel.2007.10.032. Epub 2007 Nov 13. Int J Biochem Cell Biol. 2008. PMID: 18083623 Free PMC article. Review.
-
Alexa Fluor 680-NH-CO-CH2-S-CH2-Phe-Pro-Arg-CH2-prothrombin.2012 Mar 15 [updated 2012 May 15]. In: Molecular Imaging and Contrast Agent Database (MICAD) [Internet]. Bethesda (MD): National Center for Biotechnology Information (US); 2004–2013. 2012 Mar 15 [updated 2012 May 15]. In: Molecular Imaging and Contrast Agent Database (MICAD) [Internet]. Bethesda (MD): National Center for Biotechnology Information (US); 2004–2013. PMID: 22624172 Free Books & Documents. Review.
Cited by
-
Role of sodium pyruvate in maintaining the survival and cytotoxicity of Staphylococcus aureus under high glucose conditions.Front Microbiol. 2023 Jun 19;14:1209358. doi: 10.3389/fmicb.2023.1209358. eCollection 2023. Front Microbiol. 2023. PMID: 37405167 Free PMC article.
-
Aortic and Mitral Valve Endocarditis-Simply Left-Sided Endocarditis or Different Entities Requiring Individual Consideration?-Insights from the CAMPAIGN Database.J Clin Med. 2024 Sep 30;13(19):5841. doi: 10.3390/jcm13195841. J Clin Med. 2024. PMID: 39407901 Free PMC article.
References
-
- Andrey D. O., Jousselin A., Villanueva M., Renzoni A., Monod A., Barras C., et al. (2015). Impact of the Regulators SigB, Rot, SarA and SarS on the Toxic Shock Tst Promoter and TSST-1 Expression in Staphylococcus Aureus . PloS One 10, e0135579–e0135579. doi: 10.1371/journal.pone.0135579 - DOI - PMC - PubMed
-
- Bastien S., Meyers S., Salgado-Pabón W., Giulieri S., Rasigade J.-P., Liesenborghs L., et al. (2022). All Staphylococcus Aureus Bacteraemia Strains Have the Potential to Cause Infective Endocarditis: Results of GWAS and Experimental Animal Studies. bioRxiv. doi: 10.1101/2022.05.16.491111 - DOI - PMC - PubMed
-
- Bergin S. P., Holland T. L., Fowler V. G., Tong S. Y. C. (2017). “Bacteremia, Sepsis, and Infective Endocarditis Associated With Staphylococcus Aureus,” in Current Topics in Microbiology and Immunology. Eds. Bagnoli F., Rappuoli R., Grandi G. (Cham: Springer International Publishing; ), 263–296. doi: 10.1007/82_2015_5001 - DOI - PubMed
-
- Bertling A., Niemann S., Hussain M., Holbrook L., Stanley R. G., Brodde M. F., et al. (2012). Staphylococcal Extracellular Adherence Protein Induces Platelet Activation by Stimulation of Thiol Isomerases. Arterioscler. Thromb. Vasc. Biol. 32, 1979–1990. doi: 10.1161/ATVBAHA.112.246249 - DOI - PubMed
Publication types
MeSH terms
Substances
Grants and funding
LinkOut - more resources
Full Text Sources
Medical
Miscellaneous