. 2022 Jun 22:29:176-188.
doi: 10.1016/j.omtn.2022.06.010. eCollection 2022 Sep 13.

Investigating discovery strategies and pharmacological properties of stereodefined phosphorodithioate LNA gapmers

Affiliations

Investigating discovery strategies and pharmacological properties of stereodefined phosphorodithioate LNA gapmers

Jörg Duschmalé et al. Mol Ther Nucleic Acids. .

Abstract

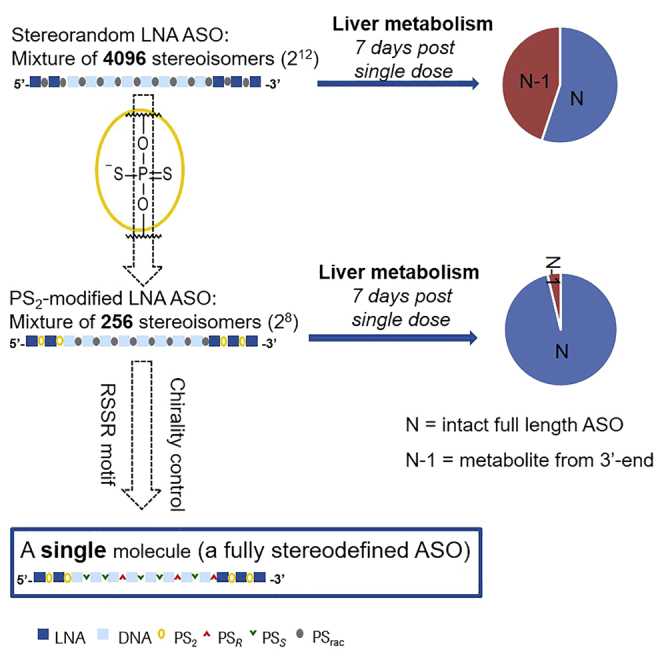
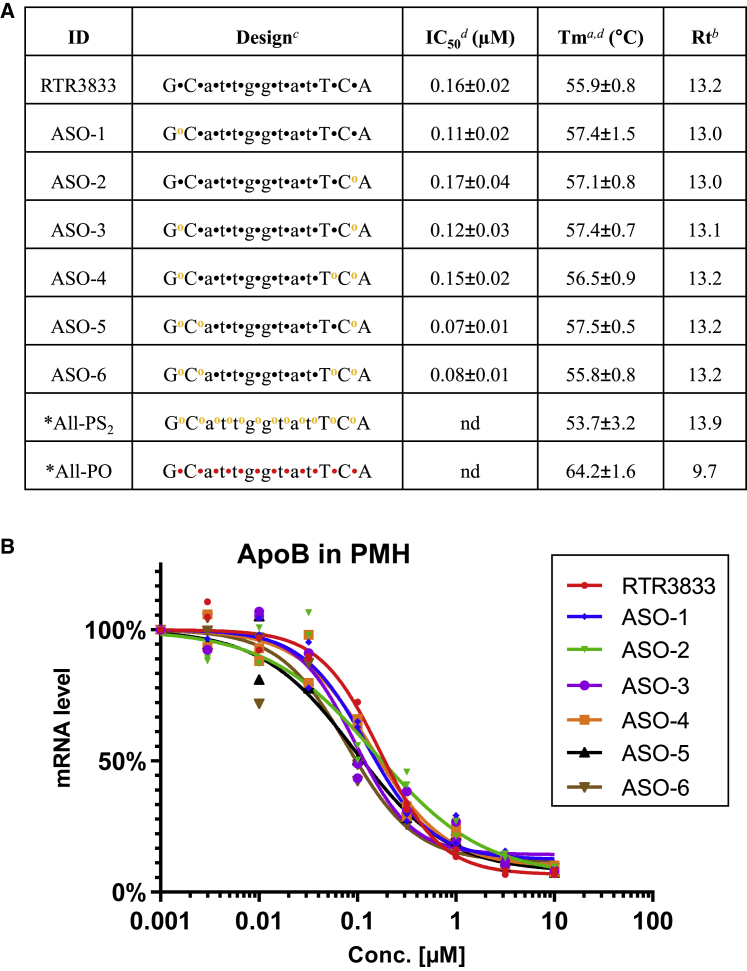
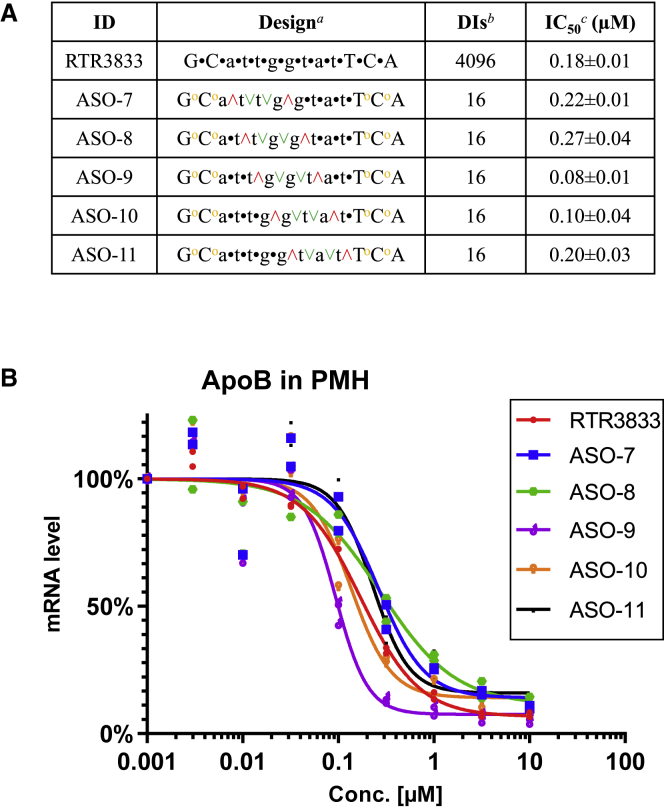
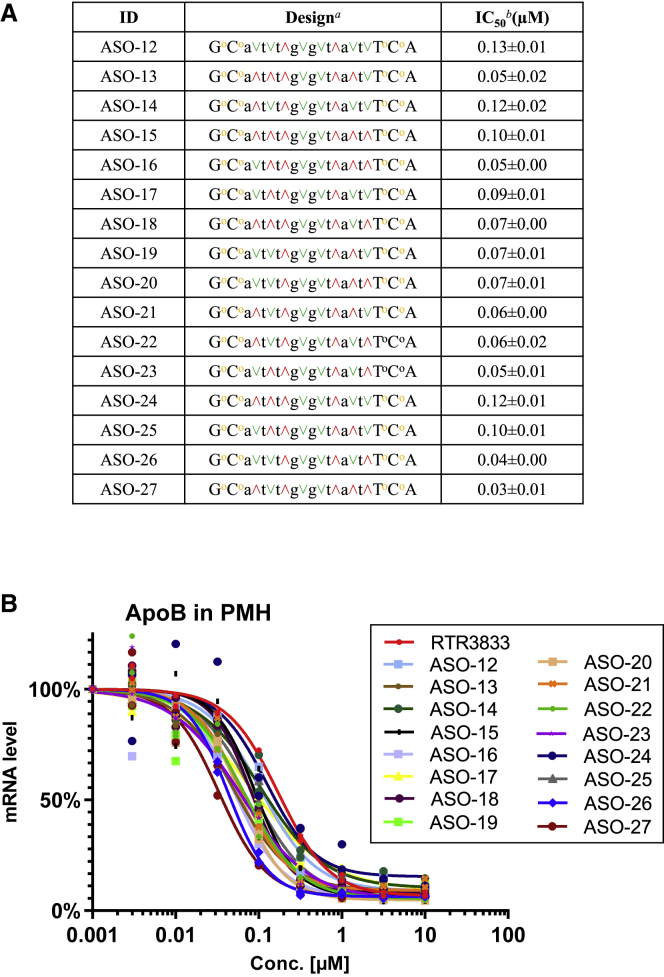
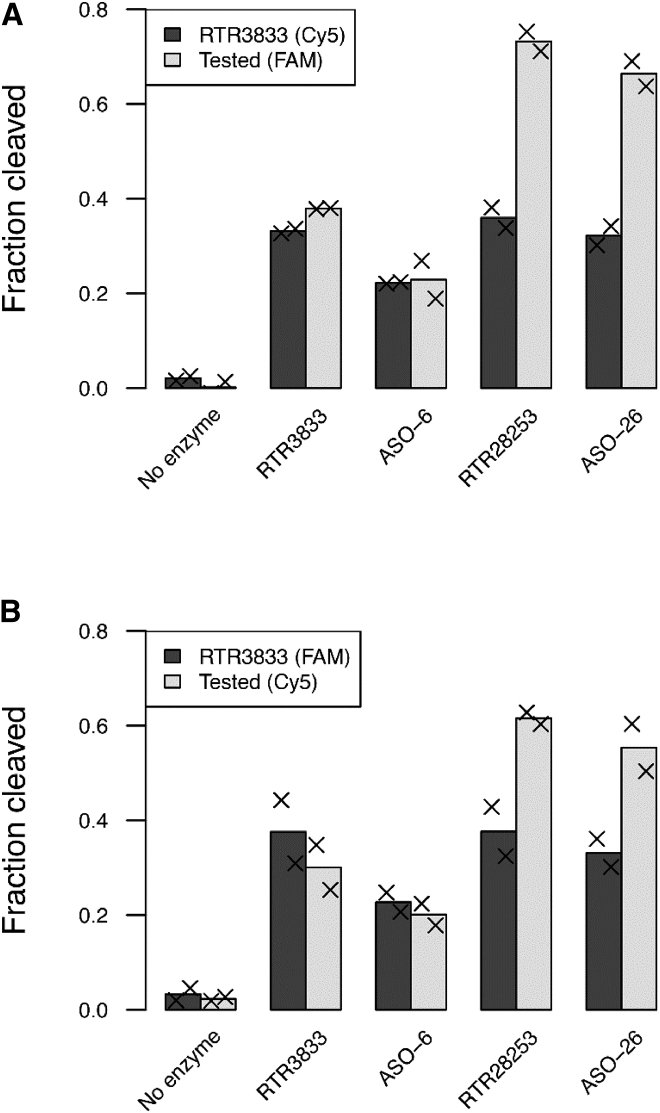
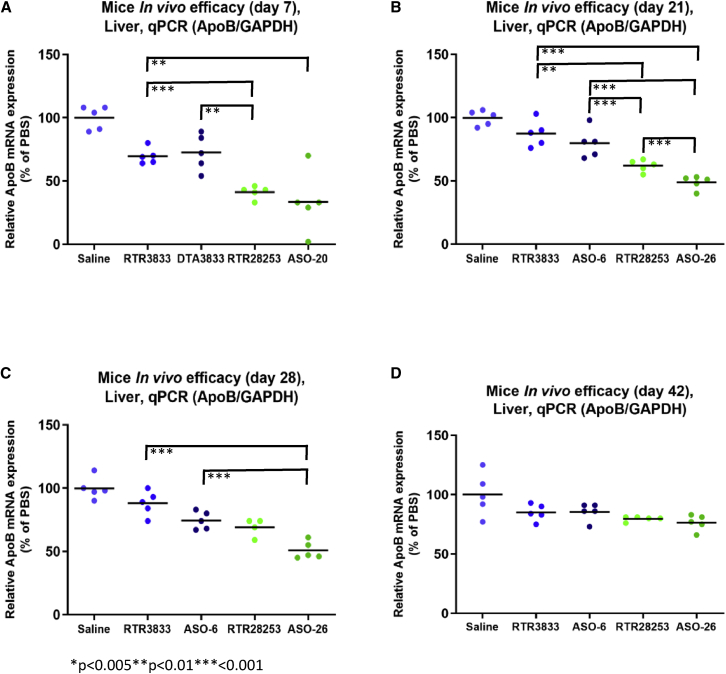
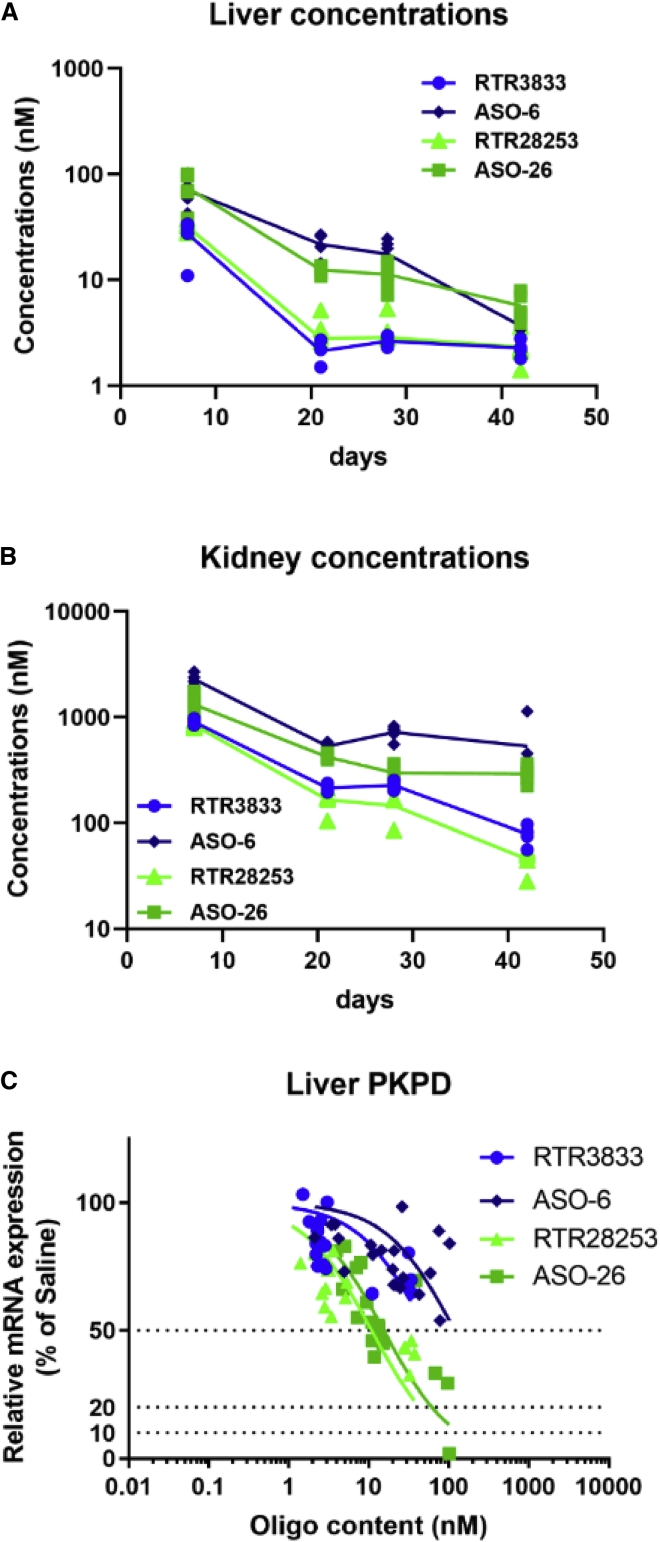
The introduction of sulfur into the phosphate linkage of chemically synthesized oligonucleotides creates the stereocenters on phosphorus atoms. Researchers have valued the nature of backbone stereochemistry and early on investigated drug properties for the individual stereocenters in dimers or short oligomers. Only very recently, it has become possible to synthesize fully stereodefined antisense oligonucleotides in good yield and purity. Non-bridging phosphorodithioate (PS2) introduces second sulfur into the phosphorothioate linkage to remove the chirality of phosphorus atom. Here, we describe the application of symmetrical non-bridging PS2 linkages in the context of stereodefined locked nucleic acids (LNAs) antisense oligonucleotides with the goal of reducing chiral complexity and, ultimately, resulting in single molecules. In addition, we propose a rather simple strategy to rapidly identify stereodefined gapmers, combining PS2 and a preferred stereochemistry motif (RSSR), which supports RNase-H-mediated target knockdown. Pharmacological efficacy and metabolic stability are investigated systematically using ApoB as a target sequence, where in vivo data correlate well to what is observed in vitro.

Keywords: MT: oligonucleotides: therapies and applications; antisense oligonucleotides; discovery strategies; locked nucleic acids; pharmacological properties; phosphorodithioates; stereodefined phosphorodithioates; symmetry.


Conflict of interest statement

J.D. is a member of a shareholder group with pooled voting rights of Roche as well as one of their representatives on the board of directors. J.W. is an academic collaborator. All the rest of the authors are or were employees of F. Hoffmann-La Roche AG.

Figures

None
Graphical abstract
Figure 1
Figure 1
In vitro ApoB mRNA target reduction in primary mouse hepatocytes (PMHs) after 72 h of gapmer ASOs exposure Reduction of target ApoB mRNA was quantified by qRT-PCR. All experiments are carried out in triplicates. (A) Design, antisense activity, Tm (melting temperature), and Rt (retention time) are shown. Positions of phosphorodithioate (PS2) (yellow o) are shown while the rest of ASO is stereorandom PS modified. ASOs marked with asterisk (∗) were tested in a different experiment following the same screening condition. aMelting temperature to complementary RNA (Tm) is shown; complementary RNA for Tm measurement is as follows: UGAAUACCAAUGC. bRP-HPLC retention time (Rt) is shown. cUpper case designates LNA nucleotide and lower case designates DNA nucleotide, with symbols designating stereorandom PS (•), PS2 (yellow o), and phosphate (red •). dStandard deviation (±) is shown; nd, not determined. (B) Dose-response curves for reducing ApoB mRNA in PMHs are shown.
Figure 2
Figure 2
In vitro safety profile of phosphorodithioates by caspase 3/7 activation and LDH secretion (A) In vitro safety profile of PS2 in HepG2 cells 24 h after transient transfection at 100 nM concentration determined by caspase 3/7 activation. Bars (%V) represent mean of the relative caspase activity of tested compounds to the vehicle control (culture medium). Negative control in green bar and positive control in red bar are included. (B) In vitro safety profile of PS2 in primary mouse hepatocytes determined by LDH secretion after 3 days of gymnotic uptake with negative (green) and positive (red) controls tested at 30 μM is shown. Bars (% control) represent mean of the relative secreted LDH of tested compounds to the vehicle control (culture medium).
Figure 3
Figure 3
In vitro ApoB mRNA target reduction in primary mouse hepatocytes (PMHs) after 72 h of gapmer ASOs exposure Reduction of target ApoB mRNA was quantified by qRT-PCR. All experiments are carried out in triplicate. (A) Design, diastereoisomers (DIs), and antisense activity are shown. Positions of PS2 (yellow o) and RSSR motif (red ˄, green ˅, green ˅, red ˄) are shown, while the rest of ASO is stereorandom PS modified. aUpper case designates LNA nucleotide, lower case designates DNA nucleotide, and symbols designate stereorandom PS (•), PS2 (yellow o), R configuration (red ˄), and S configuration (green ˅). bDIs designates diastereoisomers. cStandard deviation (±) is shown. (B) Dose-response curves for reducing ApoB mRNA in PMHs are shown.
Figure 4
Figure 4
In vitro ApoB mRNA target reduction in primary hepatocytes (PMHs) after 72 h of gapmer ASOs exposure Reduction of target ApoB mRNA was quantified by qRT-PCR. All experiments are carried out in triplicate. (A) Design and antisense activity are shown. Positions of PS2 (yellow o) and stereochemistry of each phosphorothioate linkage (red ˄ and green ˅) are shown. aUpper case designates LNA nucleotide, lower case designates DNA nucleotide, and symbols designate PS2 (yellow o), R configuration (red ˄), and S configuration (green ˅). bStandard deviation (±) is shown. (B) Dose-response curves for reducing ApoB mRNA in PMHs are shown.
Figure 5
Figure 5
RNA cleavage extent in the RNase H cleavage competition assay Fraction of RNA cleaved in each reaction for RNA hybridized with parent compound RTR3833 (dark gray) and for a tested compound (label on x axis; light gray). Left (A) and right (B) plot relate to swapped fluorophore labeling. Bars represent mean of the fractions cleaved for replicates; x symbols indicate individual observation (paired t test based on all four replicates and corrected with Holm’s method: p = 0.03 for both RTR28253 and ASO-26; no significant difference between RNA cleavage extents induced by RTR3833 and ASO-6). RTR3833: G•C•a•t•t•g•g•t•a•t•T•C•A. ASO-6: GoCoa•t•t•g•g•t•a•t•ToCoA. RTR28253: G˄C˄a˅t˅t˄g˅g˅t˄a˅t˄T˅C˅A. ASO-26: GoCoa˅t˅t˄g˅g˅t˄a˅t˄ToCoA. Upper case designates LNA nucleotide, lower case designates DNA nucleotide, and symbols designate R configuration (red ˄), S configuration (green ˅), PS2 linkage (o), and phosphorothioate linkage (•).
Figure 6
Figure 6
In vivo target knockdown in the liver at four different time points (day 7, 21, 28, and 42) C57BL/6JBomTac female mice (n = 5/group) are singly dosed with 1 mg/kg by intravenous administration. Animals were sacrificed at (A) day 7, (B) day 21, (C) day 28, and (D) day 42. Livers were harvested, and reduction of target ApoB mRNA in the liver was quantified by qRT-PCR relative to GAPDH. One animal in cohort RTR28253/day 28 had to be anesthetized due to exaggerated pharmacology. Statistically significant (one-way ANOVA) data are indicated. ∗∗p < 0.01; ∗∗∗p < 0.001.
Figure 7
Figure 7
Tissue exposure and PK/PD Drug concentrations measured in liver (A) and kidney (B) PK/PD relationship for all four drug candidates (C). C57BL/6JBomTac female mice (n = 5/group) are singly dosed with 1 mg/kg by intravenous administration. Animals were sacrificed at day 7, day 21, day 28, and day 42. Livers and kidneys were harvested, and ASO concentrations were measured by hELISA. y axis represents drug concentration (nM, nmols/kg tissue) in liver and kidney separately.
Figure 8
Figure 8
Metabolite formation in liver and kidney after 7 days of drug administration C57BL/6JBomTac female mice (n = 5/group) are singly dosed with 1 mg/kg by intravenous administration. Liver and kidney were sampled at day 7. The data were measured by LC-MS/MS. Color codes represent the fragmented metabolites. RTR3833: 5′-GCatggtatTCA-3′ ASO-6: 5′-GCatggtatTCA-3′. RTR28253: 5′-GCatggtatTCA-3′. ASO-26: 5′-GCatggtatTCA-3′. Upper case designates LNA nucleotide, lower case designates DNA nucleotide, and symbols designate R configuration (red ˄), S-configuration (green ˅), PS2 linkage ( o), and phosphorothioate linkage (•).

Similar articles

Cited by

References

    1. Nguyen L.A., He H., Pham-Huy C. Chiral drugs: an overview. Int. J. Biomed. Sci. 2006;2:85–100. - PMC - PubMed
    1. Hagedorn P.H., Persson R., Funder E.D., Albaek N., Diemer S.L., Hansen D.J., Moller M.R., Papargyri N., Christiansen H., Hansen B.R., et al. Locked nucleic acid: modality, diversity, and drug discovery. Drug Discov. Today. 2018;23:101–114. - PubMed
    1. Stec W.J., Grajkowski A., Koziolkiewicz M., Uznanski B. Novel route to oligo(deoxyribonucleoside phosphorothioates). Stereocontrolled synthesis of P-chiral oligo(deoxyribonucleoside phosphorothioates) Nucleic Acids Res. 1991;19:5883–5888. - PMC - PubMed
    1. Guga P., Stec W.J. Synthesis of phosphorothioate oligonucleotides with stereodefined phosphorothioate linkages. Curr. Protoc. Nucleic Acid Chem. 2003;Chapter 4:Unit 4.17. - PubMed
    1. Knouse K.W., DeGruyter J.N., Schmidt M.A., Zheng B., Vantourout J.C., Kingston C., Mercer S.E., Mcdonald I.M., Olson R.E., Zhu Y., et al. Unlocking P(V): reagents for chiral phosphorothioate synthesis. Science. 2018;361:1234–1238. - PMC - PubMed

LinkOut - more resources