

Comparative Genomic and Phylogenetic Analysis of Chloroplast Genomes of Hawthorn (Crataegus spp.) in Southwest China
- PMID: 35860470
- PMCID: PMC9289535
- DOI: 10.3389/fgene.2022.900357
Comparative Genomic and Phylogenetic Analysis of Chloroplast Genomes of Hawthorn (Crataegus spp.) in Southwest China
Abstract
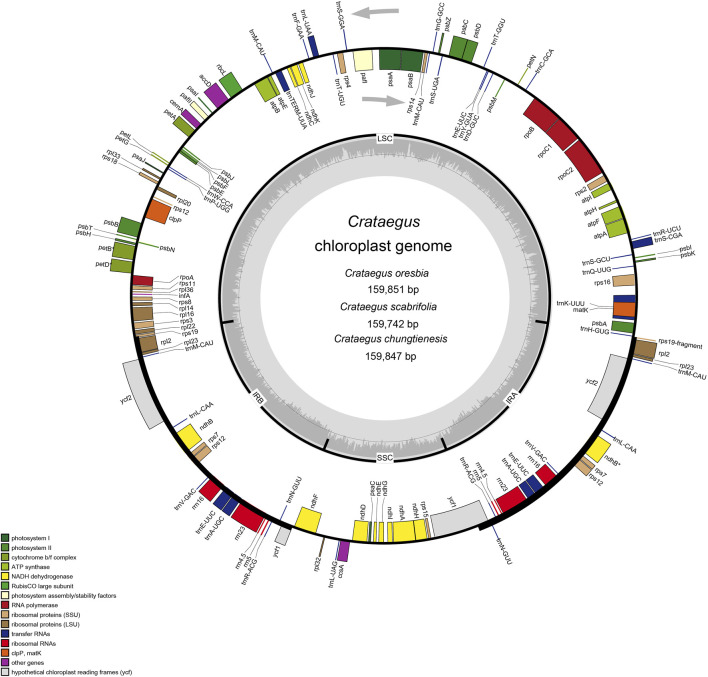
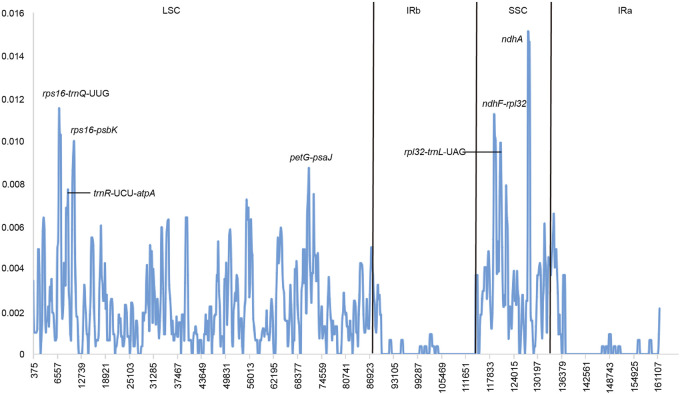
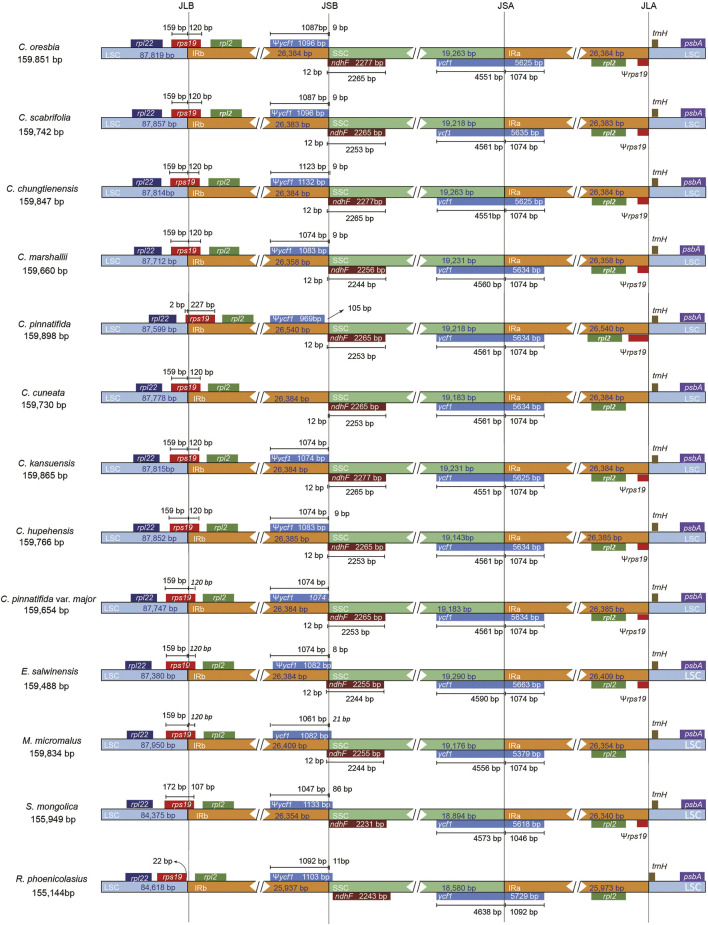
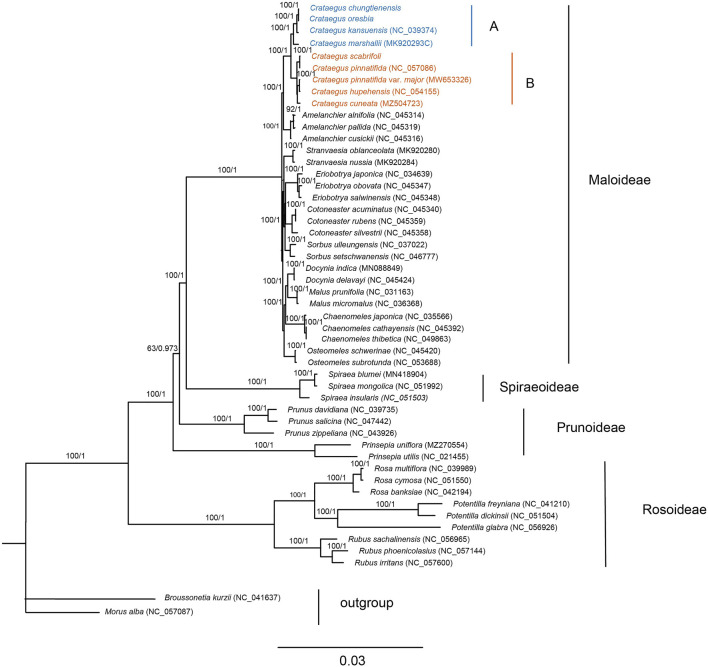
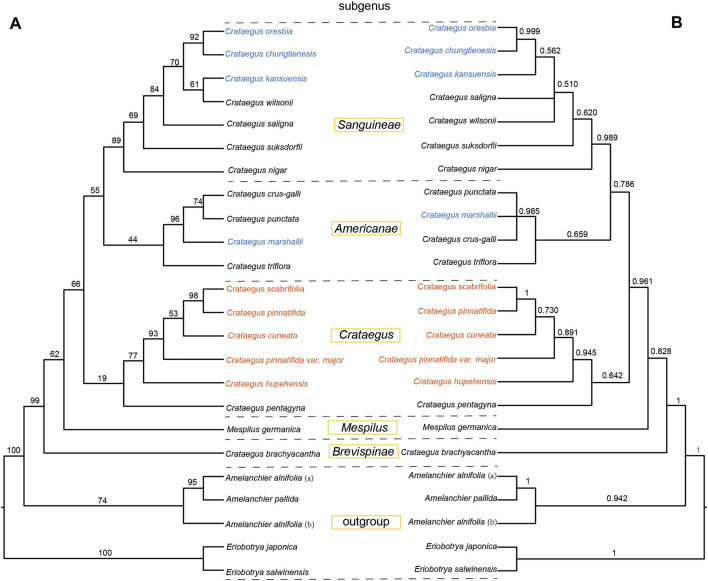
The hawthorns (Crataegus spp.) are widely distributed and famous for their edible and medicinal values. There are ∼18 species and seven varieties of hawthorn in China distributed throughout the country. We now report the chloroplast genome sequences from C. scabrifolia, C. chungtienensis and C. oresbia, from the southwest of China and compare them with the previously released six species in Crataegus and four species in Rosaceae. The chloroplast genome structure of Crataegus is typical and can be divided into four parts. The genome sizes are between 159,654 and 159,898bp. The three newly sequenced chloroplast genomes encode 132 genes, including 85 protein-coding genes, 37 tRNA genes, and eight rRNA genes. Comparative analysis of the chloroplast genomes revealed six divergent hotspot regions, including ndhA, rps16-trnQ-UUG, ndhF-rpl32, rps16-psbK, trnR-UCU-atpA and rpl32-trnL-UAG. According to the correlation and co-occurrence analysis of repeats with indels and SNPs, the relationship between them cannot be ignored. The phylogenetic tree constructed based on the complete chloroplast genome and intergenic region sequences indicated that C. scabrifolia has a different origin from C. chungtienensis and C. oresbia. We support the placement of C. hupehensis, C. cuneata, C. scabrifolia in C. subg. Crataegus and C. kansuensis, C. oresbia, C. kansuensis in C. subg. Sanguineae. In addition, based on the morphology, geographic distribution and phylogenetic relationships of C. chungtienensis and C. oresbia, we speculate that these two species may be the same species. In conclusion, this study has enriched the chloroplast genome resources of Crataegus and provided valuable information for the phylogeny and species identification of this genus.
Keywords: Crataegus spp.; chloroplast genome; comparative analysis; hawthorn; phylogenetic analysis.
Copyright © 2022 Wu, Luo, Zhang, Yang, Crabbe, Zhang and Li.
Conflict of interest statement
The authors declare that the research was conducted in the absence of any commercial or financial relationships that could be construed as a potential conflict of interest.
Figures
Similar articles
-
A systematic comparison of eight new plastome sequences from Ipomoea L.PeerJ. 2019 Mar 11;7:e6563. doi: 10.7717/peerj.6563. eCollection 2019. PeerJ. 2019. PMID: 30881765 Free PMC article.
-
The complete chloroplast genome of Crataegus scabrifolia (Franch.) Rehd (Rosaceae), a medicinal and edible plant in Southwest China.Mitochondrial DNA B Resour. 2023 Jan 8;8(1):81-85. doi: 10.1080/23802359.2022.2160668. eCollection 2023. Mitochondrial DNA B Resour. 2023. PMID: 36643811 Free PMC article.
-
Identification and phylogenetic analysis of five Crataegus species (Rosaceae) based on complete chloroplast genomes.Planta. 2021 Jun 28;254(1):14. doi: 10.1007/s00425-021-03667-4. Planta. 2021. PMID: 34180013
-
Characterization of the complete chloroplast genome sequences of six Dalbergia species and its comparative analysis in the subfamily of Papilionoideae (Fabaceae).PeerJ. 2022 Jul 1;10:e13570. doi: 10.7717/peerj.13570. eCollection 2022. PeerJ. 2022. PMID: 35795179 Free PMC article.
-
Comparative genomic and phylogenetic analyses of mitochondrial genomes of hawthorn (Crataegus spp.) in Northeast China.Int J Biol Macromol. 2024 Jun;272(Pt 1):132795. doi: 10.1016/j.ijbiomac.2024.132795. Epub 2024 Jun 1. Int J Biol Macromol. 2024. PMID: 38830497
Cited by
-
Insights into Phylogeny, Taxonomy, Origins and Evolution of Crataegus and Mespilus, Based on Comparative Chloroplast Genome Analysis.Genes (Basel). 2025 Feb 7;16(2):204. doi: 10.3390/genes16020204. Genes (Basel). 2025. PMID: 40004533 Free PMC article.
-
The complete Chloroplast genome of Stachys geobombycis and comparative analysis with related Stachys species.Sci Rep. 2024 Apr 12;14(1):8523. doi: 10.1038/s41598-024-59132-1. Sci Rep. 2024. PMID: 38609472 Free PMC article.
-
The complete chloroplast genome sequence of Vincetoxicum mongolicum (Apocynaceae), a perennial medicinal herb.Genet Mol Biol. 2023 Jun 2;46(2):e20220303. doi: 10.1590/1678-4685-GMB-2022-0303. eCollection 2023. Genet Mol Biol. 2023. PMID: 37272836 Free PMC article.
-
Comparative chloroplast genomes of Argentina species: genome evolution and phylogenomic implications.Front Plant Sci. 2024 Apr 30;15:1349358. doi: 10.3389/fpls.2024.1349358. eCollection 2024. Front Plant Sci. 2024. PMID: 38766467 Free PMC article.
-
Plastome-based subgenus-level phylogenetic backbone of hawthorns: insights into the maternal position and taxonomic synopsis of Crataegusshandongensis (Rosaceae, Maleae).PhytoKeys. 2025 Feb 12;252:87-108. doi: 10.3897/phytokeys.252.136506. eCollection 2025. PhytoKeys. 2025. PMID: 39981217 Free PMC article.
References
-
- Abdullah, Mehmood F., Shahzadi I., Ali Z., Islam M., Naeem M., et al. (2020). Correlations Among Oligonucleotide Repeats, Nucleotide Substitutions, and Insertion-Deletion Mutations in Chloroplast Genomes of Plant Family Malvaceae. J. Syst. Evol. 59, 388–402. 10.1111/jse.12585 - DOI
LinkOut - more resources
Full Text Sources
Miscellaneous