. 2022 Jul 4:12:893206.
doi: 10.3389/fonc.2022.893206. eCollection 2022.

The Cellular and Molecular Landscape of Synchronous Pediatric Sialoblastoma and Hepatoblastoma

Affiliations

The Cellular and Molecular Landscape of Synchronous Pediatric Sialoblastoma and Hepatoblastoma

Ran Yang et al. Front Oncol. .

Abstract

Sialoblastoma (SBL) is an infrequent embryonal malignant tumor originating from the salivary gland, resembling primitive salivary gland anlage, whereas hepatoblastoma (HB) is the most common pediatric liver malignancy. The simultaneous occurrence of both tumors is extremely rare. Here we reported a case of a 6-month-old infant diagnosed with synchronous SBL and HB. The patient received neoadjuvant chemotherapy followed by surgical resection. Fresh tissues of both tumors were collected before and after chemotherapy, which were further profiled by whole exome sequencing (WES) and single-cell RNA sequencing (scRNA-seq). WES analysis revealed potential somatic driver mutation PIK3CA p.Glu454Lys for SBL and canonical mutation CTNNB1 p.Ser45Pro for HB. No shared somatic variants or common copy number alterations were found between SBL and HB primary tumor samples. Though scRNA-seq, single-cell atlases were constructed for both tumors. SBL may recapitulate a pre-acinar stage in the development of salivary gland, including basaloid, duct-like, myoepithelial-like, and cycling phenotypes. In the meantime, HB was composed of tumor cells resembling different stages of the liver, including hepatocyte-like, hepatic progenitor-like, and hepatoblast-like cells. After chemotherapy, both tumors were induced into a more mature phenotype. In terms of transcriptional signatures, SBL and HB showed enhanced expression of epithelial markers KRT8, KRT18, and essential embryo development genes SDC1, MDK, indicating the disruption of normal embryo epithelium development. Finally, heterozygous deleterious germline mutation BLM and FANCI were identified which could predispose the patient to higher cancer risk. It partially explained the reason for the co-occurrence of SBL and HB. Taken together, we provided valuable resources for deciphering cellular heterogeneity and adaptive change of tumor cells after chemotherapy for synchronous SBL and HB, providing insights into the mechanisms leading to synchronous pediatric tumors.

Keywords: embryonal neoplasm; genetic predisposition to cancer; hepatoblastoma; sialoblastoma; single cell analysis.


Conflict of interest statement

The authors declare that the research was conducted in the absence of any commercial or financial relationships that could be construed as a potential conflict of interest.

Figures

Figure 1
Figure 1
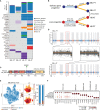
The occurrence of two synchronous pediatric tumors. (A) Diagrams of the study design and sample workflow (Created with BioRender.com). Fresh tumor specimens were collected at the timepoint of surgical biopsy and tumor resection. (B) CT images and H&E staining of SBL before and after neoadjuvant chemotherapy. (C) CT images and H&E staining of HB before and after neoadjuvant chemotherapy. CT, Computed tomography; H&E, hematoxylin and eosin; SBL, sialoblastoma; HB, hepatoblastoma; PT, primary tumor; AT, tumor after treatment.
Figure 2
Figure 2
The genomic and transcriptomic landscape of SBL. (A) Oncoplot outlining the distribution of mutations across 4 tumor samples. The color indicated different variant types. (B) Phylogenetic tree diagram showing key somatic mutations as well as shared mutated genes and copy number alterations. (C) Lollipop plot showing the hot spot mutation of PI3KCA p.E542K. Boxes represent functional domains. p85B, p85 binding domain; RBD, Ras binding domain. (D) Scatter plots showing copy number alterations in SBL PT and AT samples. (E) tSNE visualization of 22,107 cells from SBL colored by cell types (left) and density of sample distribution(middle). The right panel shows the proportions of different cell types in SBL PT and AT samples. tSNE, t-distributed stochastic neighbor embedding. (F) Dot plot for expression of cell-type-specific markers in SBL. The color indicated the scaled mean expression of marker genes, and the size indicated the proportion of cells expressing marker genes. SBL, sialoblastoma; HB, hepatoblastoma; PT, primary tumor; AT, tumor after treatment.
Figure 3
Figure 3
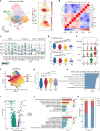
The intratumoral heterogeneity within SBL tumor cells. (A) UMAP visualization of 20,111 tumor cells from SBL colored by clusters (left) and density of sample distribution(right). UMAP, uniform manifold approximation and projection. (B) Heatmap displaying the Pearson correlation coefficients calculated between average gene expressions of tumor clusters. (C) Violin plots showing the expression distribution of selected genes involved in cell cycle genes, Wnt signaling pathway, and markers specific to duct, myoepithelial, basal and acinar cells in SBL tumor expression programs. (D) UMAP visualization of 20,111 tumor cells from SBL based on Scenic regulon AUC scores. AUC, area under the ROC Curve. (E) UMAP visualization of specific transcription factor expression and regulon activity. For four transcription factors: (left) histogram of AUC values, together with the chosen cutoff (red dashed line); (middle)the cells with AUC value over the cutoff value are shown in purple, where the regulon is considered active; (right) the expression of the transcription factor is shown. (F) UMAP visualization of murine embryo and postnatal salivary gland datasets curated from GSE150327.Colors indicated different cell types used for Garnett classifier training. (G) Bar plot indicating the percentage of tumor subtypes corresponding to 9 developing cell types. Tumor cells were assigned to different identities predicted by Garnett. (H) Bar plot indicating the percentage of tumor subtypes in SBL PT and AT samples. (I) Volcano plot showing differentially expressed genes between PT (green dots) and RT tumor cells (blue dots). The names of selected important genes are indicated in the plots. (J) Bar chart showing the enrichment of GO terms, based on top50 upregulated genes in PT or AT malignant cells. GO, gene ontology. (K) GSEA enrichment plot of expression signatures of Hallmark_G2M checkpoint in SBL PT malignant cells. (L) GSEA enrichment plot of expression signatures of GO_Morphogenesis of embryonic epithelium in SBL AT malignant cells. SBL, sialoblastoma; PT, primary tumor; AT, tumor after treatment.
Figure 4
Figure 4
The genomic and transcriptomic landscape of HB (A) Lollipop plot showing CTNNB1 p.S45P mutation. Boxes represented functional domains. VCL, interaction with VCL; ARM, Armadillo/beta-catenin-like repeats; SCRIB, interaction with SCRIB. (B) Lollipop plot showing ZMIZ2 in-frame deletion. Boxes represented functional domains. Zf-MIZ, Zinc finger MIZ domain. (C) Scatter plots showing copy number alterations in HB PT and AT samples. (D) UMAP visualization of 21,450 cells from HB colored by cell types (left) and density of sample distribution(middle). Right panel showing the percentage of different cell types in HB PT and AT samples. (E) Dot plot for expression of cell-type-specific markers in HB. The color indicated scaled mean expression of marker genes, and the size indicated the proportion of cells expressing marker genes. HB, hepatoblastoma; PT, primary tumor; AT, tumor after treatment.
Figure 5
Figure 5
The intratumoral heterogeneity within HB malignant cells. (A) UMAP visualization of 3,085 tumor cells from HB colored by clusters (left) and density of sample distribution(right). (B) Heatmap displaying the Pearson correlation coefficients calculated between average gene expressions of tumor clusters. (C) Violin plots showing the expression distribution of selected genes involved in cell cycle genes, and markers specific to mature hepatocytes, hepatoblasts, and mesenchymal cells in HB tumor subtypes. (D) Boxplots showing the expression score of HB C1 and C2 group gene sets curated from Cairo et al. in HB tumor subtypes. *P < 0.05, **P < 0.01, ***P < 0.001, ****P < 0.0001, two-sided Wilcoxon test. (E) Violin plots showing the expression of four-gene signature curated from Hooks et al. in HB tumor subtypes. (F) UMAP visualization of CytoTRACE values of HB malignant cells. (G) Boxplots showing CytoTRACE values in HB tumor subtypes. *P < 0.05, **P < 0.01, ***P < 0.001, ****P < 0.0001, two-sided Wilcoxon test. (H) GSEA analysis of genes correlated with high CytoTRACE values (associated with immaturity). (I) Volcano plot showing differentially expressed genes between HB PT (green dots) and RT tumor cells (blue dots). The names of selected important genes are indicated in the plots. (J) Bar chart showing the enrichment of GO terms, based on top50 upregulated genes in PT or AT malignant cells. (K) Bar plot indicating the percentage of tumor subtypes in HB PT and AT samples. HB, hepatoblastoma; PT, primary tumor; AT, tumor after treatment.
Figure 6
Figure 6
Transcriptional similarities between SBL and HB malignant cells. (A) Venn diagram displaying shared signature genes between SBL and HB malignant cells. (B) Heatmap showing the expression of shared genes and selected top20 unique signature genes in SBL and HB malignant cells. (C) Bar chart showing the enrichment of GO terms, based on shared signature genes between SBL and HB malignant cells. (D) Bar chart showing the enrichment of KEGG terms, based on shared signature genes between SBL and HB malignant cells. (E) IGV screenshot (upper) and DNA sequence chromatogram of Sanger sequencing (bottom) demonstrating BLM c.G2293A, pV765I germline mutation. (F) IGV screenshot (upper) and DNA sequence chromatogram of Sanger sequencing (bottom) demonstrating FANCI c.G2113A, pE96K germline mutation. SBL, sialoblastoma; HB, hepatoblastoma; PT, primary tumor; DEG, differentially expressed gene.

References

    1. Di Micco R, Prufer F, Bruder E, Schifferli A, Gurtler N. Sialoblastoma of the Submandibular Gland: A Distinct Entity? Eur J Pediatr (2019) 178(8):1301–4. doi: 10.1007/s00431-019-03411-x - DOI - PubMed
    1. Worasakwutiphong S. Sialoblastoma of the Cheek: A Case Report and Review of the Literature. Mol Clin Oncol (2016) 4:925. doi: 10.3892/mco.2016.1060 - DOI - PMC - PubMed
    1. Saffari Y, Blei F, Warren SM, Milla S, Greco MA. Congenital Minor Salivary Gland Sialoblastoma: A Case Report and Review of the Literature. Fetal Pediatr Pathol (2011) 30(1):32–9. doi: 10.3109/15513815.2010.502961 - DOI - PubMed
    1. Irace AL, Adil EA, Archer NM, Silvera VM, Perez-Atayde A, Rahbar R. Pediatric Sialoblastoma: Evaluation and Management. Int J Pediatr Otorhinolaryngol (2016) 87:44–9. doi: 10.1016/j.ijporl.2016.04.037 - DOI - PubMed
    1. Saravakos P, Hartwein J, Fayyazi A. Sialoblastoma of the Parotid Gland in a 13-Year-Old Girl With Multiple Recurrences and Long-Term Follow-Up. Head Neck-J Sci Specialties Head Neck (2016) 38(1):E13–E5. doi: 10.1002/hed.24084 - DOI - PubMed