

Development and Psychometric Testing of a New Short-Form of the Premenstrual Symptoms Questionnaire (PSQ-S)
- PMID: 35860717
- PMCID: PMC9292817
- DOI: 10.2147/IJWH.S369151
Development and Psychometric Testing of a New Short-Form of the Premenstrual Symptoms Questionnaire (PSQ-S)
Abstract
Purpose: The Premenstrual Symptoms Questionnaire (PSQ) is a patient-reported outcome measurement tool for premenstrual symptoms. Although the PSQ is a very useful tool with 14 items to screen for a wide variety of premenstrual symptoms, not everyone will respond to all the questions. Fewer questions would be less burdensome on the respondents. We aimed to develop and analyze the psychometric properties of a short-form of the PSQ (PSQ-S).
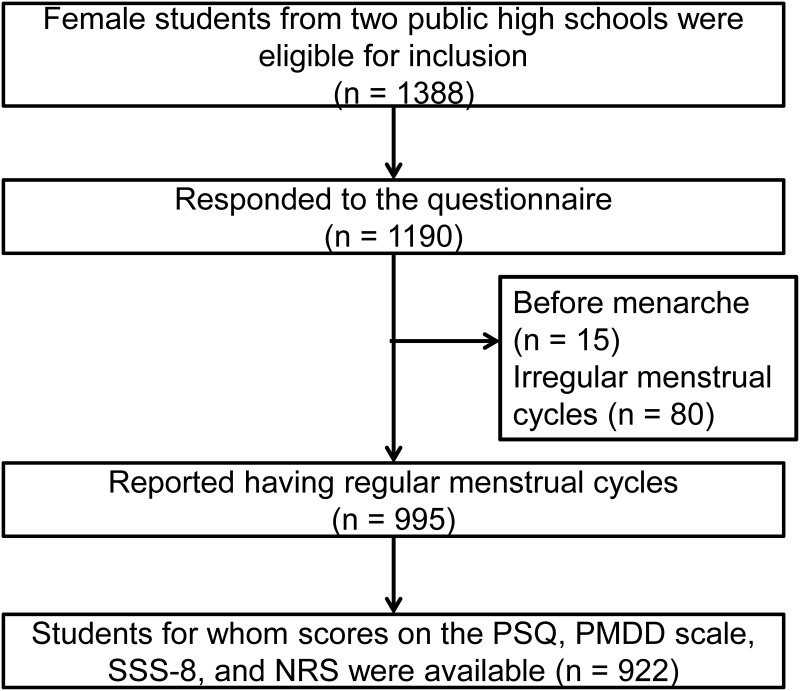
Patients and methods: The study participants were from an earlier study with a sample of 1388 female students. We reanalyzed data collected from 922 students with regular menstrual cycles who completed the PSQ, premenstrual dysphoric disorder (PMDD) scale, Somatic Symptom Scale-8 (SSS-8), and numerical rating scale (NRS) for menstrual pain. First, we selected nine items for the PSQ-S based on the results of the corrected item-total correlation analysis. The PSQ-S was then analyzed for reliability and validity using the classical test theory. Moreover, item response theory was applied to test the psychometric properties of the PSQ-S.
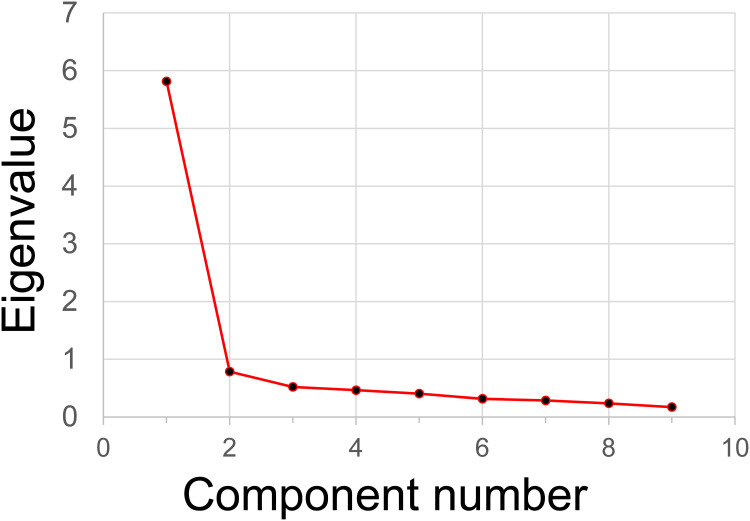
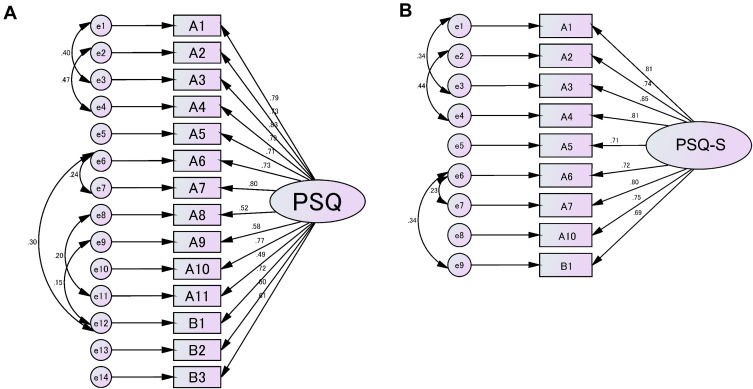
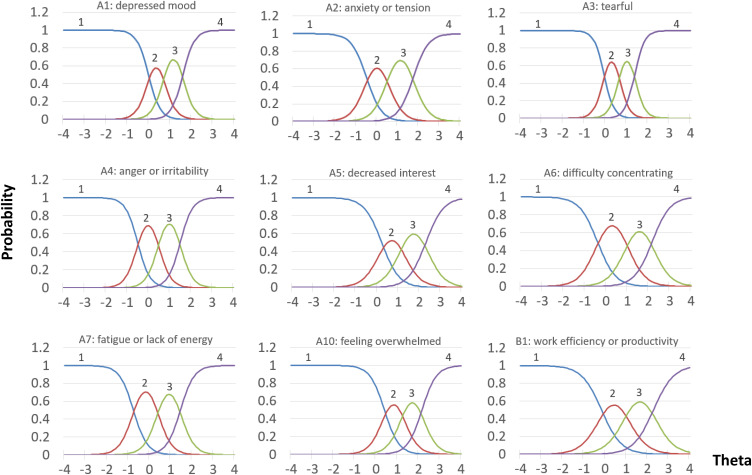
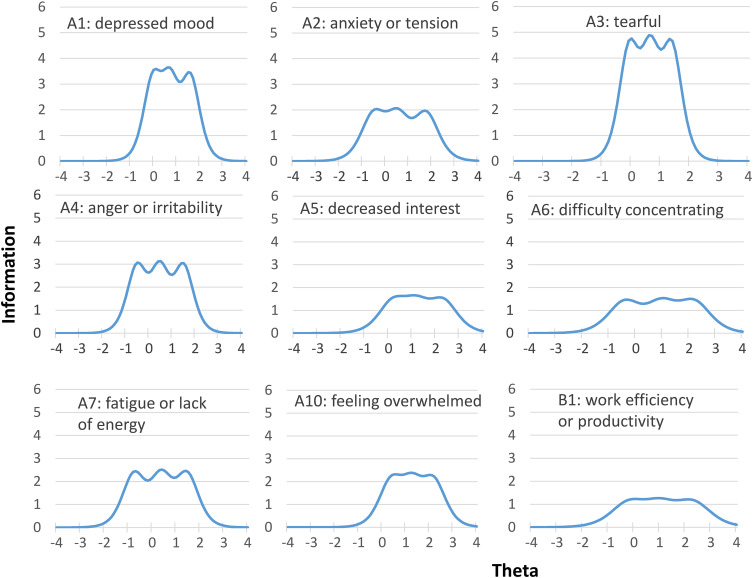
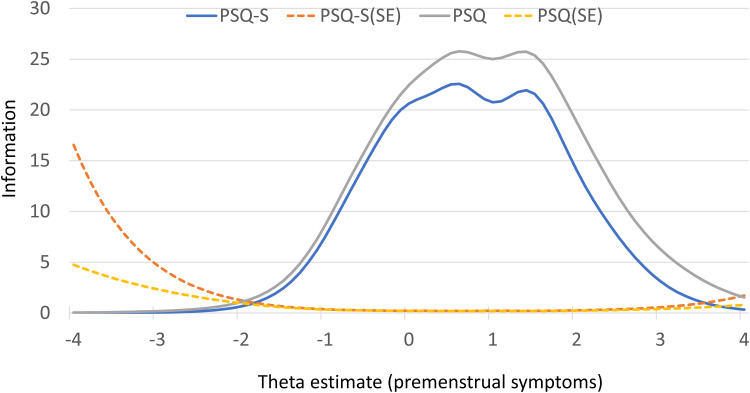
Results: Cronbach's α for the PSQ-S score was 0.93. Principal component factor analysis revealed a one-factor model. Confirmatory factor analysis showed that the one-factor model was a good fit. The PSQ-S total score was strongly correlated with the PSQ total score, PMDD scale score, and SSS-8 score (r=0.978, 0.854, and 0.648, respectively) and moderately correlated with the NRS (r=0.437). Item response theory analyses showed that the constructs and items of the PSQ-S had satisfactory discrimination, difficulty parameters, item information curves, and test information curves. Receiver operating characteristic curve analysis revealed a cut-off score of ≥22 for suspected premenstrual disorders based on the total PSQ-S score.
Conclusion: The PSQ-S, consisting of nine items from the PSQ, had sufficient reliability and validity and could be a convenient assessment tool for premenstrual symptoms in routine clinical practice.
Keywords: item response theory; menstruation; premenstrual disorders; validity testing.
© 2022 Takeda et al.
Conflict of interest statement
Prof. Dr. Takashi Takeda reports personal fees from Tsumura Co., Ltd., personal fees from Otsuka Pharmaceutical Co., Ltd., personal fees from Bayer Pharma Co., Ltd., outside the submitted work. The authors report no other conflicts of interest in this work.
Figures
Similar articles
-
Validation of the premenstrual symptoms questionnaire among Mongolian nursing school students.BMC Womens Health. 2024 Dec 23;24(1):661. doi: 10.1186/s12905-024-03492-3. BMC Womens Health. 2024. PMID: 39710668 Free PMC article.
-
Psychometric Testing of the Premenstrual Symptoms Questionnaire and the Association Between Perceived Injustice and Premenstrual Symptoms: A Cross-Sectional Study Among Japanese High School Students.Int J Womens Health. 2020 Sep 25;12:755-763. doi: 10.2147/IJWH.S269392. eCollection 2020. Int J Womens Health. 2020. PMID: 33061664 Free PMC article.
-
Psychometric Testing of the Japanese Version of the Daily Record of Severity of Problems Among Japanese Women.Int J Womens Health. 2021 Mar 29;13:361-367. doi: 10.2147/IJWH.S301260. eCollection 2021. Int J Womens Health. 2021. PMID: 33833588 Free PMC article.
-
The Chinese version of the Perceived Stress Questionnaire: development and validation amongst medical students and workers.Health Qual Life Outcomes. 2020 Mar 13;18(1):70. doi: 10.1186/s12955-020-01307-1. Health Qual Life Outcomes. 2020. PMID: 32169070 Free PMC article.
-
A patient-reported experience measure for community pharmacy including development of a short-form: The perceived service quality scale.Res Social Adm Pharm. 2022 Aug;18(8):3369-3378. doi: 10.1016/j.sapharm.2021.11.011. Epub 2021 Nov 27. Res Social Adm Pharm. 2022. PMID: 34857482 Review.
Cited by
-
Validation of the premenstrual symptoms questionnaire among Mongolian nursing school students.BMC Womens Health. 2024 Dec 23;24(1):661. doi: 10.1186/s12905-024-03492-3. BMC Womens Health. 2024. PMID: 39710668 Free PMC article.
-
Development and psychometric assessment of a health action process approach (HAPA) inventory for home nutritional behavior among postoperative gastric cancer patients.Asia Pac J Oncol Nurs. 2024 Aug 8;11(10):100569. doi: 10.1016/j.apjon.2024.100569. eCollection 2024 Oct. Asia Pac J Oncol Nurs. 2024. PMID: 39286530 Free PMC article.
-
Investigating the psychometric properties of the Premenstrual Symptoms Screening Tool (PSST) among Bangladeshi adolescent girls.BMC Psychiatry. 2025 Jul 1;25(1):606. doi: 10.1186/s12888-025-06678-7. BMC Psychiatry. 2025. PMID: 40597011 Free PMC article.
-
Psychometric properties of patient-reported outcome measures to assess premenstrual syndrome/premenstrual dysphoric disorder in japanese: a systematic review using the COSMIN methodology.J Patient Rep Outcomes. 2025 Jun 20;9(1):71. doi: 10.1186/s41687-025-00910-4. J Patient Rep Outcomes. 2025. PMID: 40540119 Free PMC article.
References
-
- American Psychiatric Association. Diagnostic and Statistical Manual of Mental Disorders. 5th ed. Arlington (VA): American Psychiatric Association; 2013.
LinkOut - more resources
Full Text Sources
