Integrated analysis of plasma and urine reveals unique metabolomic profiles in idiopathic inflammatory myopathies subtypes
- PMID: 35860906
- PMCID: PMC9530549
- DOI: 10.1002/jcsm.13045
Integrated analysis of plasma and urine reveals unique metabolomic profiles in idiopathic inflammatory myopathies subtypes
Abstract
Objectives: Idiopathic inflammatory myopathies (IIM) are a class of autoimmune diseases with high heterogeneity that can be divided into different subtypes based on clinical manifestations and myositis-specific autoantibodies (MSAs). However, even in each IIM subtype, the clinical symptoms and prognoses of patients are very different. Thus, the identification of more potential biomarkers associated with IIM classification, clinical symptoms, and prognosis is urgently needed.
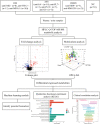
Methods: Plasma and urine samples from 79 newly diagnosed IIM patients (mean disease duration 4 months) and 52 normal control (NC) samples were analysed by high-performance liquid chromatography of quadrupole time-of-flight mass spectrometry (HPLC-Q-TOF-MS)/MS-based untargeted metabolomics. Orthogonal partial least-squares discriminate analysis (OPLS-DA) were performed to measure the significance of metabolites. Pathway enrichment analysis was conducted based on the KEGG human metabolic pathways. Ten machine learning (ML) algorithms [linear support vector machine (SVM), radial basis function SVM, random forest, nearest neighbour, Gaussian processes, decision trees, neural networks, adaptive boosting (AdaBoost), Gaussian naive Bayes and quadratic discriminant analysis] were used to classify each IIM subtype and select the most important metabolites as potential biomarkers.
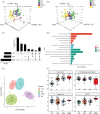
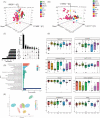
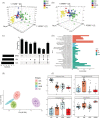
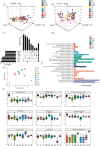
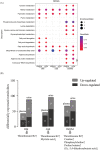
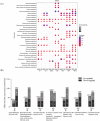
Results: OPLS-DA showed a clear separation between NC and IIM subtypes in plasma and urine metabolic profiles. KEGG pathway enrichment analysis revealed multiple unique and shared disturbed metabolic pathways in IIM main [dermatomyositis (DM), anti-synthetase syndrome (ASS), and immune-mediated necrotizing myopathy (IMNM)] and MSA-defined subtypes (anti-Mi2+, anti-MDA5+, anti-TIF1γ+, anti-Jo1+, anti-PL7+, anti-PL12+, anti-EJ+, and anti-SRP+), such that fatty acid biosynthesis was significantly altered in both plasma and urine in all main IIM subtypes (enrichment ratio > 1). Random forest and AdaBoost performed best in classifying each IIM subtype among the 10 ML models. Using the feature selection methods in ML models, we identified 9 plasma and 10 urine metabolites that contributed most to separate IIM main subtypes and MSA-defined subtypes, such as plasma creatine (fold change = 3.344, P = 0.024) in IMNM subtype and urine tiglylcarnitine (fold change = 0.351, P = 0.037) in anti-EJ+ ASS subtype. Sixteen common metabolites were found in both the plasma and urine samples of IIM subtypes. Among them, some were correlated with clinical features, such as plasma hypogeic acid (r = -0.416, P = 0.005) and urine malonyl carnitine (r = -0.374, P = 0.042), which were negatively correlated with the prevalence of interstitial lung disease.
Conclusions: In both plasma and urine samples, IIM main and MSA-defined subtypes have specific metabolic signatures and pathways. This study provides useful clues for understanding the molecular mechanisms, searching potential diagnosis biomarkers and therapeutic targets for IIM.
Keywords: Biomarkers; Idiopathic inflammatory myopathies; Machine learning algorithm; Metabolomics.
© 2022 The Authors. Journal of Cachexia, Sarcopenia and Muscle published by John Wiley & Sons Ltd on behalf of Society on Sarcopenia, Cachexia and Wasting Disorders.
Conflict of interest statement
The authors have declared no conflicts of interest.
Figures

Similar articles
-
Metabolic profiling of patients with different idiopathic inflammatory myopathy subtypes reveals potential biomarkers in plasma.Clin Exp Med. 2023 Nov;23(7):3417-3429. doi: 10.1007/s10238-023-01073-6. Epub 2023 Apr 27. Clin Exp Med. 2023. PMID: 37103652 Free PMC article.
-
Myositis-specific autoantibodies in clinical practice: Improving the performance of the immunodot.Semin Arthritis Rheum. 2022 Aug;55:151998. doi: 10.1016/j.semarthrit.2022.151998. Epub 2022 Mar 29. Semin Arthritis Rheum. 2022. PMID: 35427882
-
Autoantigenic properties of the aminoacyl tRNA synthetase family in idiopathic inflammatory myopathies.J Autoimmun. 2023 Jan;134:102951. doi: 10.1016/j.jaut.2022.102951. Epub 2022 Dec 2. J Autoimmun. 2023. PMID: 36470210
-
Autoantibodies in idiopathic inflammatory myopathies: Clinical associations and laboratory evaluation by mono- and multispecific immunoassays.Autoimmun Rev. 2019 Mar;18(3):293-305. doi: 10.1016/j.autrev.2018.10.004. Epub 2019 Jan 11. Autoimmun Rev. 2019. PMID: 30639643 Review.
-
Classification of idiopathic inflammatory myopathies: pathology perspectives.Curr Opin Neurol. 2019 Oct;32(5):704-714. doi: 10.1097/WCO.0000000000000740. Curr Opin Neurol. 2019. PMID: 31369423 Review.
Cited by
-
Untargeted NMR Metabolomics Reveals Alternative Biomarkers and Pathways in Alkaptonuria.Int J Mol Sci. 2022 Dec 13;23(24):15805. doi: 10.3390/ijms232415805. Int J Mol Sci. 2022. PMID: 36555443 Free PMC article.
-
Machine Learning Framework for Ovarian Cancer Diagnostics Using Plasma Lipidomics and Metabolomics.Int J Mol Sci. 2025 Jul 10;26(14):6630. doi: 10.3390/ijms26146630. Int J Mol Sci. 2025. PMID: 40724878 Free PMC article.
-
Oviduct Glycoprotein 1 (OVGP1) Diagnoses Polycystic Ovary Syndrome (PCOS) Based on Machine Learning Algorithms.ACS Omega. 2024 Dec 3;9(50):49054-49063. doi: 10.1021/acsomega.4c03111. eCollection 2024 Dec 17. ACS Omega. 2024. PMID: 39713694 Free PMC article.
-
Machine learning-based identification of the novel circRNAs circERBB2 and circCHST12 as potential biomarkers of intracerebral hemorrhage.Front Neurosci. 2022 Nov 29;16:1002590. doi: 10.3389/fnins.2022.1002590. eCollection 2022. Front Neurosci. 2022. PMID: 36523430 Free PMC article.
-
From data to diagnosis: how machine learning is revolutionizing biomarker discovery in idiopathic inflammatory myopathies.Brief Bioinform. 2023 Nov 22;25(1):bbad514. doi: 10.1093/bib/bbad514. Brief Bioinform. 2023. PMID: 38243695 Free PMC article. Review.
References
-
- Liu D, Zuo X, Luo H, Zhu H. The altered metabolism profile in pathogenesis of idiopathic inflammatory myopathies. Semin Arthritis Rheum 2020;50:627–635. - PubMed
Publication types
MeSH terms
Substances
Grants and funding
LinkOut - more resources
Full Text Sources
Medical
Miscellaneous

