. 2023 Apr 1;108(4):1053-1067.
doi: 10.3324/haematol.2021.280542.

Patients with hypercortisolemic Cushing disease possess a distinct class of hematopoietic progenitor cells leading to erythrocytosis

Affiliations

Patients with hypercortisolemic Cushing disease possess a distinct class of hematopoietic progenitor cells leading to erythrocytosis

Lilian Varricchio et al. Haematologica. .

Abstract

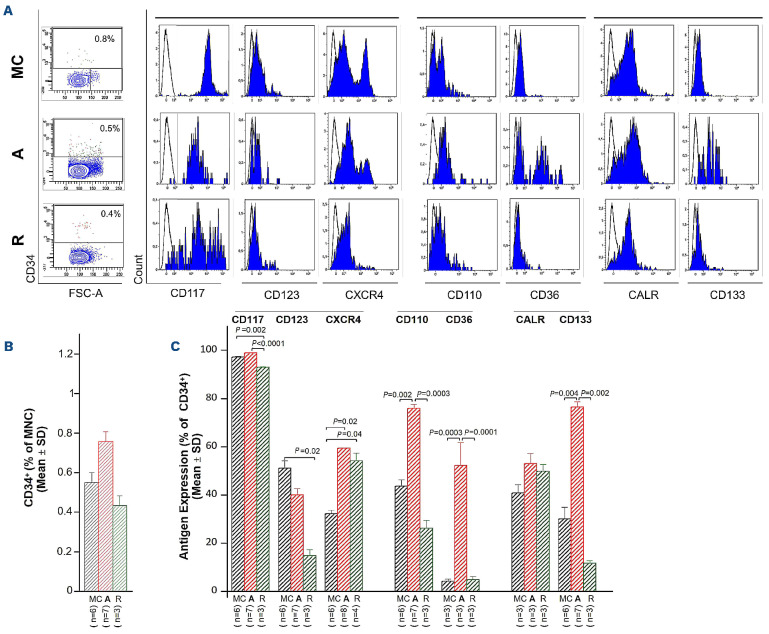
Although human cell cultures stimulated with dexamethasone suggest that the glucocorticoid receptor (GR) activates stress erythropoiesis, the effects of GR activation on erythropoiesis in vivo remain poorly understood. We characterized the phenotype of a large cohort of patients with Cushing disease, a rare condition associated with elevated cortisol levels. Results from hypercortisolemic patients with active Cushing disease were compared with those obtained from eucortisolemic patients after remission and from volunteers without the disease. Patients with active Cushing disease exhibited erythrocytosis associated with normal hemoglobin F levels. In addition, their blood contained elevated numbers of GR-induced CD163+ monocytes and a unique class of CD34+ cells expressing CD110, CD36, CD133 and the GR-target gene CXCR4. When cultured, these CD34+ cells generated similarly large numbers of immature erythroid cells in the presence and absence of dexamethasone, with raised expression of the GR-target gene GILZ. Of interest, blood from patients with Cushing disease in remission maintained high numbers of CD163+ monocytes and, although their CD34+ cells had a normal phenotype, these cells were unresponsive to added dexamethasone. Collectively, these results indicate that chronic exposure to excess glucocorticoids in vivo leads to erythrocytosis by generating erythroid progenitor cells with a constitutively active GR. Although remission rescues the erythrocytosis and the phenotype of the circulating CD34+ cells, a memory of other prior changes is maintained in remission.


Figures

Figure 1.
Figure 1.
Patients with active Cushing disease have higher hematocrit, hemoglobin level, and platelet and white blood cell counts than patients in remission. (A) Photograph of blood tubes from one representative patient with active Cushing disease and one matched control (MC). (B) Hematocrit, hemoglobin levels and platelet counts for the whole cohort of patients with Cushing disease with active disease or in remission included in the clinical database (unpaired, left panel, and paired, right panel). (C) Hematocrit, hemoglobin levels and platelet counts of the MC and patients with active Cushing disease included in the study. (D) White blood cell counts for patients with active-phase or remission-phase Cushing disease and the MC included in the study. The number of patients included in each analysis is indicated by n. P values were calculated in (B) and (C) by a t test and in (D) by the Tukey multiple comparisons test. A: patients with active Cushing disease; R: patients with Cushing disease in remission; MC: matched controls (matched for age, weight and sex) without Cushing disease; Hct: hematocrit (%); Hb: hemoglobin (g/dL); Plt: platelet count (x109/L); WBC: white blood cell count.
Figure 2.
Figure 2.
Although the frequency of total monocytes in blood from Cushing patients (with active disease or in remission) and from matched controls is similar, the frequency of monocytes expressing CD163, which is induced by glucocorticoids in patients with Cushing disease, is greater than in matched controls. (A) Neutrophil, eosinophil, basophil, monocyte and lymphocyte counts in the blood from patients with Cushing disease (active and in remission) and matched controls (MC) included in the study. (B, C) Percentages of CD14+ cells and CD14+ cells expressing CD163 or CD169 in the blood from Cushing patients (active and in remission) and MC. Representative flow cytometry data are presented in (B) and the mean (± standard deviation) of multiple determinations are presented in (C). The number of patients included in each analysis is indicated by n. P values were calculated by the Tukey multiple comparisons test and those statistically significant are indicated in the panel. WBC: white blood cells; A: patients with active Cushing disease; R: patients with Cushing disease in remission; MC: matched controls (matched for age, weight and sex) without Cushing disease.
Figure 3.
Figure 3.
Patients with Cushing disease express overall normal levels of fetal hemoglobin. (A) High performance liquid chromatography determination of globin chain levels in red blood cells from representative patients with active Cushing disease and Cushing disease in remissions and matched controls (each graph represents a separate subject, as indicated; patients are identified with the same alpha-numerical code indicated in Table 1). (B, C) Average ratios of α/b-like and γ/β-like globins in red blood cells from active-phase and remission-phase patients and matched controls. P values were calculated by the Tukey multiple comparisons test. A: patients with active Cushing disease; R: patients with Cushing disease in remission; MC: matched controls (matched for age, weight and sex) without Cushing disease.
Figure 4.
Figure 4.
The blood from patients with active Cushing disease contains normal numbers of CD34+ cells that express a stresslike phenotype characterized by high cell surface levels of the glucocorticoid receptor target gene CXCR4, of CD110, CD36 and of the stem cell marker CD133. (A) Representative forward side scatter and CD34 staining of mononuclear cells from the blood of one representative Cushing disease patient with active disease and one in remission as well as the cells from a matched control (MC) are presented on the left. Cells in the CD34+ gate were then analyzed for expression of CD117, CD123, CXCR4, CD110, CD36, CALR and CD133, and the results presented as histograms in gray on the right. The numbers within the plots indicate the frequency of the cell populations within the gate. The blue histograms indicate the signal from irrelevant isotype-matched controls analyzed in parallel. (B) Frequency of CD34+ cells in the mononuclear blood cells from multiple active-phase and remission-phase patients and MC. (C) Frequency of CD34+ cells expressing CD117, CD123, CXCR4, CD110, CD36, CALR and CD133 from active-phase and remission-phase patients and MC. The number of different individuals included in the various groups is indicated by n. P values were calculated with the Tukey multiple comparisons test and those statistically significant are indicated in the panels. A: patients with active Cushing disease; R: patients with Cushing disease in remission; MC: matched controls (matched for age, weight and sex) without Cushing disease); FSC: forward scatter; MNC: mononuclear cells; SD: standard deviation.
Figure 5.
Figure 5.
Erythroid progenitor cells from patients with active Cushing disease generate similarly high numbers of erythroblasts in cultures stimulated or not with dexamethasone. (A) Total numbers of erythroblasts generated by day 10 by erythoid progenitor cells from matched controls (MC), patients with active Cushing disease and patients with Cushing disease in remission cultured with or without dexamethasone, as indicated. The total number of erythroblasts was calculated by multiplying the total number of cells in each culture by the corresponding percentage of cells with the CD235a/CD36 phenotype determined by fluorescence activated cell sorting. (B) Flow cytometry analyses for CD235a/CD36 expression of cells generated at day 10 by CD34+ cells from representative active- and remission-phase Cushing patients and MC. CD235a/CD36 staining divides erythroid cells in to CD235aneg/CD36pos (gate 1, proerythroblasts, purple), CD235alow/CD36pos (gate 2, basophilic erythroblasts, light green), and CD235amedium/CD36pos (gate 3, polychromatophilic erythroblasts, dark green) and CD235apos/CD36pos (gate 4, orthochromatic erythroblasts, light blue), as reported. Non-erythroid cells are CD235negCD36neg (dark blue) and are mainly lymphocytes. Results are presented as counterplots which allow for a better distinction of the clusters of the individual cell populations. (C) Frequency of cells in gates 1, 2, 3 and 4 generated by day 10 by CD34+ cells from MC and active-phase and remission-phase Cushing patients cultured with or without dexamethasone (the same color code as in panel B). Note that erythroblasts from MC are already mostly mature at day 10 in cultures without dexamethasone. By contrast, at day 10 similar numbers of immature erythroblasts are observed in cultures with or without dexamethasone from active-phase and remission-phase patients. The number of different individuals included in the various groups is indicated by n. Statistical analyses between cultures with or without dexamethasone in the same group were performed by a paired t test and statistically significant values are indicated in the panel. Statistical analyses among groups was performed by the Tukey multiple comparisons test as appropriate. Results of the statistical analyses are as follows. (A) Paired t test: MC without dexamethasone vs. MC with dexamethasone, P=0.001; active- or remission-phase Cushing patient with or without dexamethasone, not statistically different. Tukey multiple comparisons test: MC with dexamethasone vs. remission-phase patient with dexamethasone, P=0.0003 and vs. remission-phase patient without dexamethasone, P=0.0002; MC without dexamethasone vs. remission-phase patient with dexamethasone, P=0.03 and vs. remission-phase patient without dexamethasone, P=0.02; active-phase patient with dexamethasone vs. remission-phase patient with dexamethasone, P=0.03 and vs. remission-phase patient without dexamethasone, P=0.02; active phase patient without dexamethasone vs. remission-phase patient without dexamethasone, P=0.04. All the other comparisons were not statistically different. (C) Paired t-test: gates 1 and 3 for MC with or without dexamethasone, P=0.02 for both; gates for active-phase and remission-phase patients with and without dexamethasone are not statistically different. Tukey multiple comparisons test: no statistically significant differences among gates for MC vs. active-phase patients or vs. remission-phase patients with or without dexamethasone. Erys: erythroblasts; SEM: standard error of mean; Dex: dexamethasone; A: patients with active Cushing disease; R: patients with Cushing disease in remission; MC: matched controls (matched for age, weight and sex) without Cushing disease; FITC; fluorescein isothiocyanate; APC: allophycocyanin.
Figure 6.
Figure 6.
Erythroblasts from patients with active Cushing disease contain normal levels of total glucocorticoid receptor (GR), which is poorly phosphorylated in the inactive cytoplasmic-retained S203 form, and express high levels of the S211 form and of the GR-target gene GILZ in cultures with and without dexamethasone. (A) Western blot analyses for total GRα and its nuclear (GRαS211) and cytoplasmic (GRαS203) forms, as well of the GR target gene GILZ of erythroblasts generated at day 10 by representative patients with active Cushing disease or disease in remission and matched controls (MC) (each number a different donor) in culture with and without (active-phase patients only) dexamethasone. The position of the molecular weight markers is indicated on the left. (B) Content of total GRα, GRαS203, GRαS211 and GRαS203 with respect to that of GAPDH in erythroblasts generated from cells from active- and remission-phase patients and from MC cultured with dexamethasone. (C) Stoichiometry levels of GRαS203 and GRαS211 in cells from active- and remission-phase patients and from MC cultured with dexamethasone. (D) Stoichiometry levels of GRαS203 and GRαS211 and levels of GILZ with respect to those of GRαS211 in cultures of cells from active-phase patients cultured with or without dexamethasone. In (B-D), results are expressed as box charts with minimum and maximum values observed in multiple individuals in each group. P values among groups were calculated by the Tukey multiple comparisons test in (B) and (C) and by a paired t test in (D). The number of individuals included in each group is indicated by n. A: patients with active Cushing disease; R: patients with Cushing disease in remission; MC: matched controls (matched for age, weight and sex), without Cushing disease; na: not available; Dex: dexamethasone.

Comment in

References

    1. Bauer A, Tronche F, Wessely O, et al. The glucocorticoid receptor is required for stress erythropoiesis. Genes Dev. 1999;13(22):2996-3002. - PMC - PubMed
    1. Tajima Y, Moore MAS, Soares V, Ono M, Kissel H, Besmer P. Consequences of exclusive expression in vivo of kit-ligand lacking the major proteolytic cleavage site. Proc Natl Acad Sci U S A. 1998;95(20):11903-11908. - PMC - PubMed
    1. Varricchio L, Tirelli V, Masselli E, et al. The expression of the glucocorticoid receptor in human erythroblasts is uniquely regulated by KIT ligand: implications for stress erythropoiesis. Stem Cells Dev. 2012;21(15):2852-2865. - PMC - PubMed
    1. Ogawa M, Grush OC, O’Dell RF, Hara H, MacEachern MD. Circulating erythropoietic precursors assessed in culture: characterization in normal men and patients with hemoglobinopathies. Blood. 1977;50(6):1081-1092. - PubMed
    1. Migliaccio G, Di Pietro R, di Giacomo V, et al. In vitro mass production of human erythroid cells from the blood of normal donors and of thalassemic patients. Blood Cells Mol Dis. 2002;28(2):169-180. - PubMed

Publication types

MeSH terms