. 2022 Sep 2;38(17):4088-4099.
doi: 10.1093/bioinformatics/btac519.

Predicting and explaining the impact of genetic disruptions and interactions on organismal viability

Affiliations

Predicting and explaining the impact of genetic disruptions and interactions on organismal viability

Bader F Al-Anzi et al. Bioinformatics. .

Abstract

Motivation: Existing computational models can predict single- and double-mutant fitness but they do have limitations. First, they are often tested via evaluation metrics that are inappropriate for imbalanced datasets. Second, all of them only predict a binary outcome (viable or not, and negatively interacting or not). Third, most are uninterpretable black box machine learning models.

Results: Budding yeast datasets were used to develop high-performance Multinomial Regression (MN) models capable of predicting the impact of single, double and triple genetic disruptions on viability. These models are interpretable and give realistic non-binary predictions and can predict negative genetic interactions (GIs) in triple-gene knockouts. They are based on a limited set of gene features and their predictions are influenced by the probability of target gene participating in molecular complexes or pathways. Furthermore, the MN models have utility in other organisms such as fission yeast, fruit flies and humans, with the single gene fitness MN model being able to distinguish essential genes necessary for cell-autonomous viability from those required for multicellular survival. Finally, our models exceed the performance of previous models, without sacrificing interpretability.

Availability and implementation: All code and processed datasets used to generate results and figures in this manuscript are available at our Github repository at https://github.com/KISRDevelopment/cell_viability_paper. The repository also contains a link to the GI prediction website that lets users search for GIs using the MN models.

Supplementary information: Supplementary data are available at Bioinformatics online.


Figures

Fig. 1.
Fig. 1.
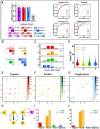
Performance of computational models when predicting the impact of single gene disruption on budding yeast viability. (A) Models’ performance as measured by overall BA on both the development dataset (solid color) and test dataset (hatched color), confusion matrices on the test dataset and per-class ROC on the test dataset (with the corresponding AUC-ROC values). The purple, red, blue and gray colors correspond to the S-Full, S-Refined, S-MN and null models, respectively. Error bars in the development set BA plots (solid color) correspond to SDs. The lack of error bars on test dataset BA results (hatched color) is due to the models being tested on a single withheld test dataset. Asterisks represent Bonferroni-corrected P-values, P < 0.05C (*), P < 0.01C (**), P < 0.001C (***), and P <0.0001C (****), where C = 6, and asterisk colors correspond to the models being compared. (B and C) Differences in the distributions of input features used in the S-Refined and S-MN models across the three single mutant fitness classes. (B) A heatmap representing the prevalence of a given sGO term in the lethal (L), reduced growth (R) and normal growth (N) output classes. The heatmap is sorted along the prevalence in the L class. The values inside the cells correspond to the class distribution for each term. (C and D) Violin plots showing the distribution in each output class of the LID and percent amino acid identity, with an illustration of these input features in the upper portion of each panel. The circle in each violin corresponds to the median value and the thick black line corresponds to the interquartile range (middle 50% of observations). Asterisks in (B) and (C) represent the Bonferroni-corrected reliability of the Kruskal–Wallis test with C = 3 (A color version of this figure appears in the online version of this article.)
Fig. 2.
Fig. 2.
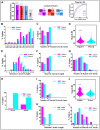
Performance of computational models when predicting double gene knockout GIs in the budding yeast. (A) Models’ performance on the development and test sets as measured by overall BA, confusion matrices and per-class AUC-ROC. The purple, red, blue and gray colors correspond to the D-Full, D-Refined, D-MN and null models, respectively. In all panels, the output classes are negative (−), neutral (N), positive (+) and suppression (S). Statistical analysis (error bars and asterisks) is similar to Figure 1 with the asterisk color reflecting the model being compared. (BG) Differences in the distributions of input features used in the D-Refined and D-MN models across the four double gene knockout GI classes. (B) Matrices showing rows and columns which correspond to the single mutant fitness of the first and second gene in a pair: lethal (L), reduced growth (R) and normal (N). Each cell in a table shows the relative frequency of a particular pair of single mutant fitness classes in a GI class. (C) The distributions of the shortest path lengths separating proteins encoded by the target gene pairs in each GI class as compared to the average shortest path length between any protein pair in the PPI network (gray dashed line). (D) Violin plot showing the distribution of sum LID of proteins encoded by the target gene pairs in each of the four output classes. Statistical tests and symbols in the violin plot are similar to Figure 1. (E–G). The prevalence of sGO term pairs in a given GI class in matrix format. In each matrix, the cell color intensity indicates how often the sGO term of gene A (rows) appears with the sGO term of gene B (columns). The tick marks correspond to specific sGO terms: kinase activity (1), protein targeting (2) and chromosome (3). For a magnified version which includes the full labels of the sGO terms, see Supplementary Figure S6. (H) Cartoon of possible GIs combinations that can occur between genes in molecular complexes and pathways. The arrow represents negative (red), positive (green) and suppression (blue) GIs between genes that belong to the same molecular complex (left panel), between genes that belong to different molecular complexes (α and β) but are on the same pathway as indicated by the black arrow, and between genes that belong to different molecular complexes and pathways (right panel). For each complex (I) and pathway (J), we compute the distributions of within-complex (solid bars) and across-complex (textured bars) interactions over the four output classes. Asterisks correspond to P-value levels of two-sided t-test (A color version of this figure appears in the online version of this article.)
Fig. 3.
Fig. 3.
Performance of computational models predicting triple gene knockout negative GIs in the budding yeast. (A) Models’ performance on the development and test sets as measured by the same metrics in Figures 1 and 2. The purple, red, blue and gray colors correspond to the T-Full, T-Refined, T-MN and null models, respectively. In all panels, the output classes are negative (−) and neutral (N). Statistical analysis (error bars and asterisks) is similar to Figure 1. (BG) Differences in the distributions of the input features used in the T-Refined model in the negative (magenta) and neutral (cyan) triple gene knockout GI classes. (B) Shows the percentages for each possible combination of single mutant fitness readings. Each tick along the x-axis shows the number of lethal (L), reduced growth (R) and normal genes (N) in the combination. (C) The 10 combinations in (A) are pooled into two categories: combinations where the number of genes with normal single mutant fitness is less than 2 and combinations where the number is greater than or equal to 2. (D) Violin plot showing the distribution of the sum LID of the proteins in the two classes. (E) Distributions of the SCL connecting the protein triplets in each class. (F) The data in E are combined into two categories: the first contains protein triplets that are connected by less than eight steps, while the other contains protein triplets connected by more than eight steps. (G) The number of sGO terms shared by proteins in the triplets in each class. A triplet is deemed to share an sGO term if at least two genes in the triplet are associated with the given sGO term. Asterisks correspond to the significance of Chi-squared test comparing the negative (magenta) and neutral (cyan) feature distributions. (H) The percentage of gene triplets encoding proteins in the same molecular complex (Within) or from different molecular complexes (Across) that cause negative GI (magenta) or neutral GI (cyan). (IL) feature distributions of gene triplets encoding proteins in the same molecular complex (Within, magenta color) or different molecular complexes (Across, cyan color). (I) Triplets containing at most one normal gene (N < 2) or at least two normal genes (N ≥ 2). (J) Violin plot showing the distribution of the sum LID of the proteins encoded by gene triplets in the two categories. (K) Percentage of triplets connected by a circuit of less than eight steps (<8) or at least eight steps (≥8). (L) Percentage of triplets sharing 0, 1, 2, 3, 4 and 5 sGO terms (A color version of this figure appears in the online version of this article.)
Fig. 4.
Fig. 4.
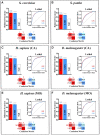
Performance of binary S-Refined and S-MN models when predicting single gene knockouts with CA or MO lethality in (A) S. cerevisiae, (B) S. pombe, (C) H. sapiens (cellular autonomous), (D) D. melanogaster (cellular autonomous), (E) H. sapiens (multiorganismal), and (F) D. melanogaster (multiorganismal). Statistical analysis (error bars and asterisks) is similar to Figure 1 with the asterisk color reflecting the model being compared
Fig. 5.
Fig. 5.
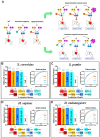
Performance of the D-Refined and D-MN models when predicting GIs in S. cerevisiae, S. pombe, H. sapiens and D. melanogaster. (A) Representation of schemes used to generate GIs in a hypothetical signaling pathway controlling fruit fly eye development. Gene A is in a positive signaling relationship with gene C (red arrow), gene B is in an inhibitory relationship with gene C (blue line) and gene C sends a signal that promotes eye development. In this example, a transgene is used to express either dominant negative or hyperactive forms of gene A specifically in the eye: the dominant negative gene A reduces pathway signaling which produces mildly rough eyes, while the hyperactive form causes a reduced eye with abnormal pigmentation. Both transgenes can be used either in a haploinsufficiency screen in which one copy of gene B or C is removed (gray circles), or overexpression screen in which gene B is overexpressed. Thickness of arrows and lines reflects changes in signaling levels. (BE) Performance of the D-Refined (red), D-Refined with no sGO (orange), D-MN (blue), D-MN with no sGO (cyan) and null GI model (white) when predicting interacting (I) versus neutral (N) on the S. cerevisiae (B), S. pombe (C), H. sapiens (D) and D. melanogaster (E) GI datasets. Statistical analysis (error bars and asterisks) is similar to Figure 1A with the asterisk color reflecting the model being compared (A color version of this figure appears in the online version of this article.)

Similar articles

Cited by

  • Complex synthetic lethality in cancer.
    Ryan CJ, Devakumar LPS, Pettitt SJ, Lord CJ. Ryan CJ, et al. Nat Genet. 2023 Dec;55(12):2039-2048. doi: 10.1038/s41588-023-01557-x. Epub 2023 Nov 30. Nat Genet. 2023. PMID: 38036785 Review.

References

    1. Al-Aamri A. et al. (2019) Analyzing a co-occurrence gene-interaction network to identify disease-gene association. BMC Bioinformatics., 20, 70. 10.1186/s12859-019-2634-7 - DOI - PMC - PubMed
    1. Alanis-Lobato G., Cannistraci,C.V. and Ravasi,T. (2013) Exploitation of genetic interaction network topology for the prediction of epistatic behavior. Genomics, 102(4), 202–208. 10.1016/j.ygeno.2013.07.010 - DOI - PubMed
    1. Alberts B. et al. (2002). Molecular Biology of the Cell. Garland Science, New York.
    1. Babu M.M. et al. (2004) Structure and evolution of transcriptional regulatory networks. Curr. Opin. Struct. Biol., 14, 283–291. - PubMed
    1. Bandyopadhyay S. et al. (2008) Functional maps of protein complexes from quantitative genetic interaction data. PLoS Comput. Biol., 4, e1000065. 10.1371/journal.pcbi.1000065 - DOI - PMC - PubMed

Publication types