

Microstructural Alterations in Projection and Association Fibers in Neonatal Hypoxia-Ischemia
- PMID: 35861468
- PMCID: PMC10324281
- DOI: 10.1002/jmri.28366
Microstructural Alterations in Projection and Association Fibers in Neonatal Hypoxia-Ischemia
Abstract
Background: Diffusion MRI (dMRI) is known to be sensitive to hypoxic-ischemic encephalopathy (HIE). However, existing dMRI studies used simple diffusion tensor metrics and focused only on a few selected cerebral regions, which cannot provide a comprehensive picture of microstructural injury.
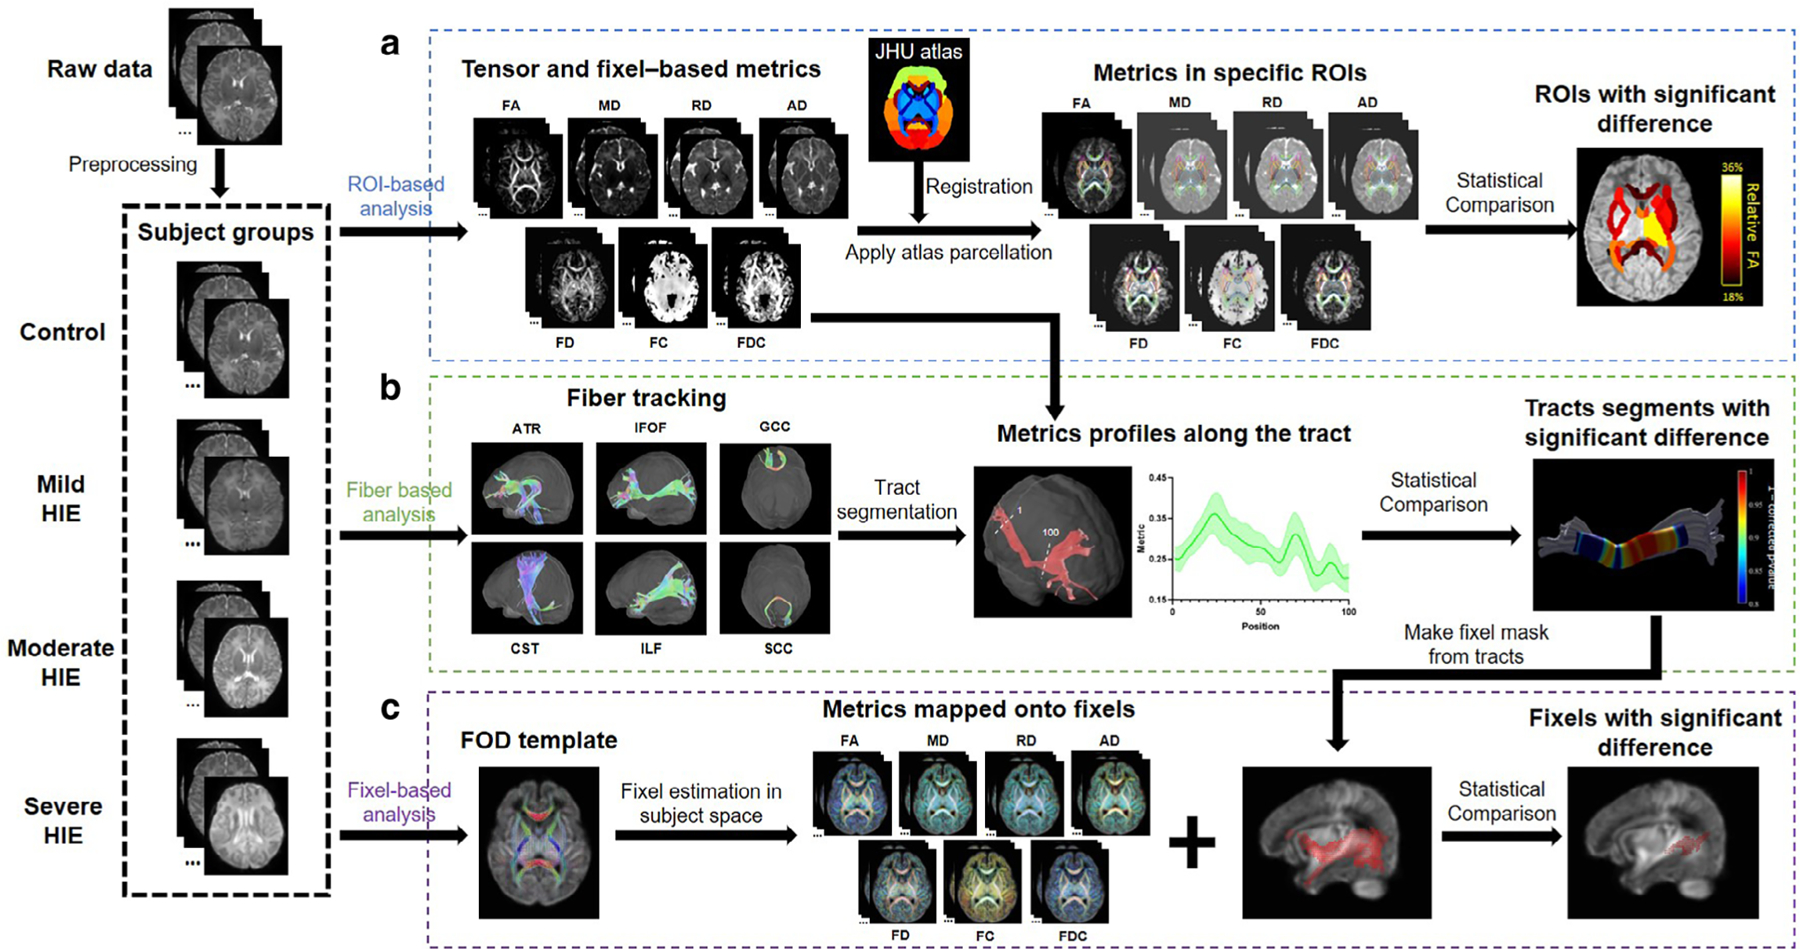
Purpose: To systematically characterize the microstructural alterations in mild, moderate, and severe HIE neonates compared to healthy neonates with advanced dMRI using region of interest (ROI), tract, and fixel-based analyses.
Study type: Prospective.
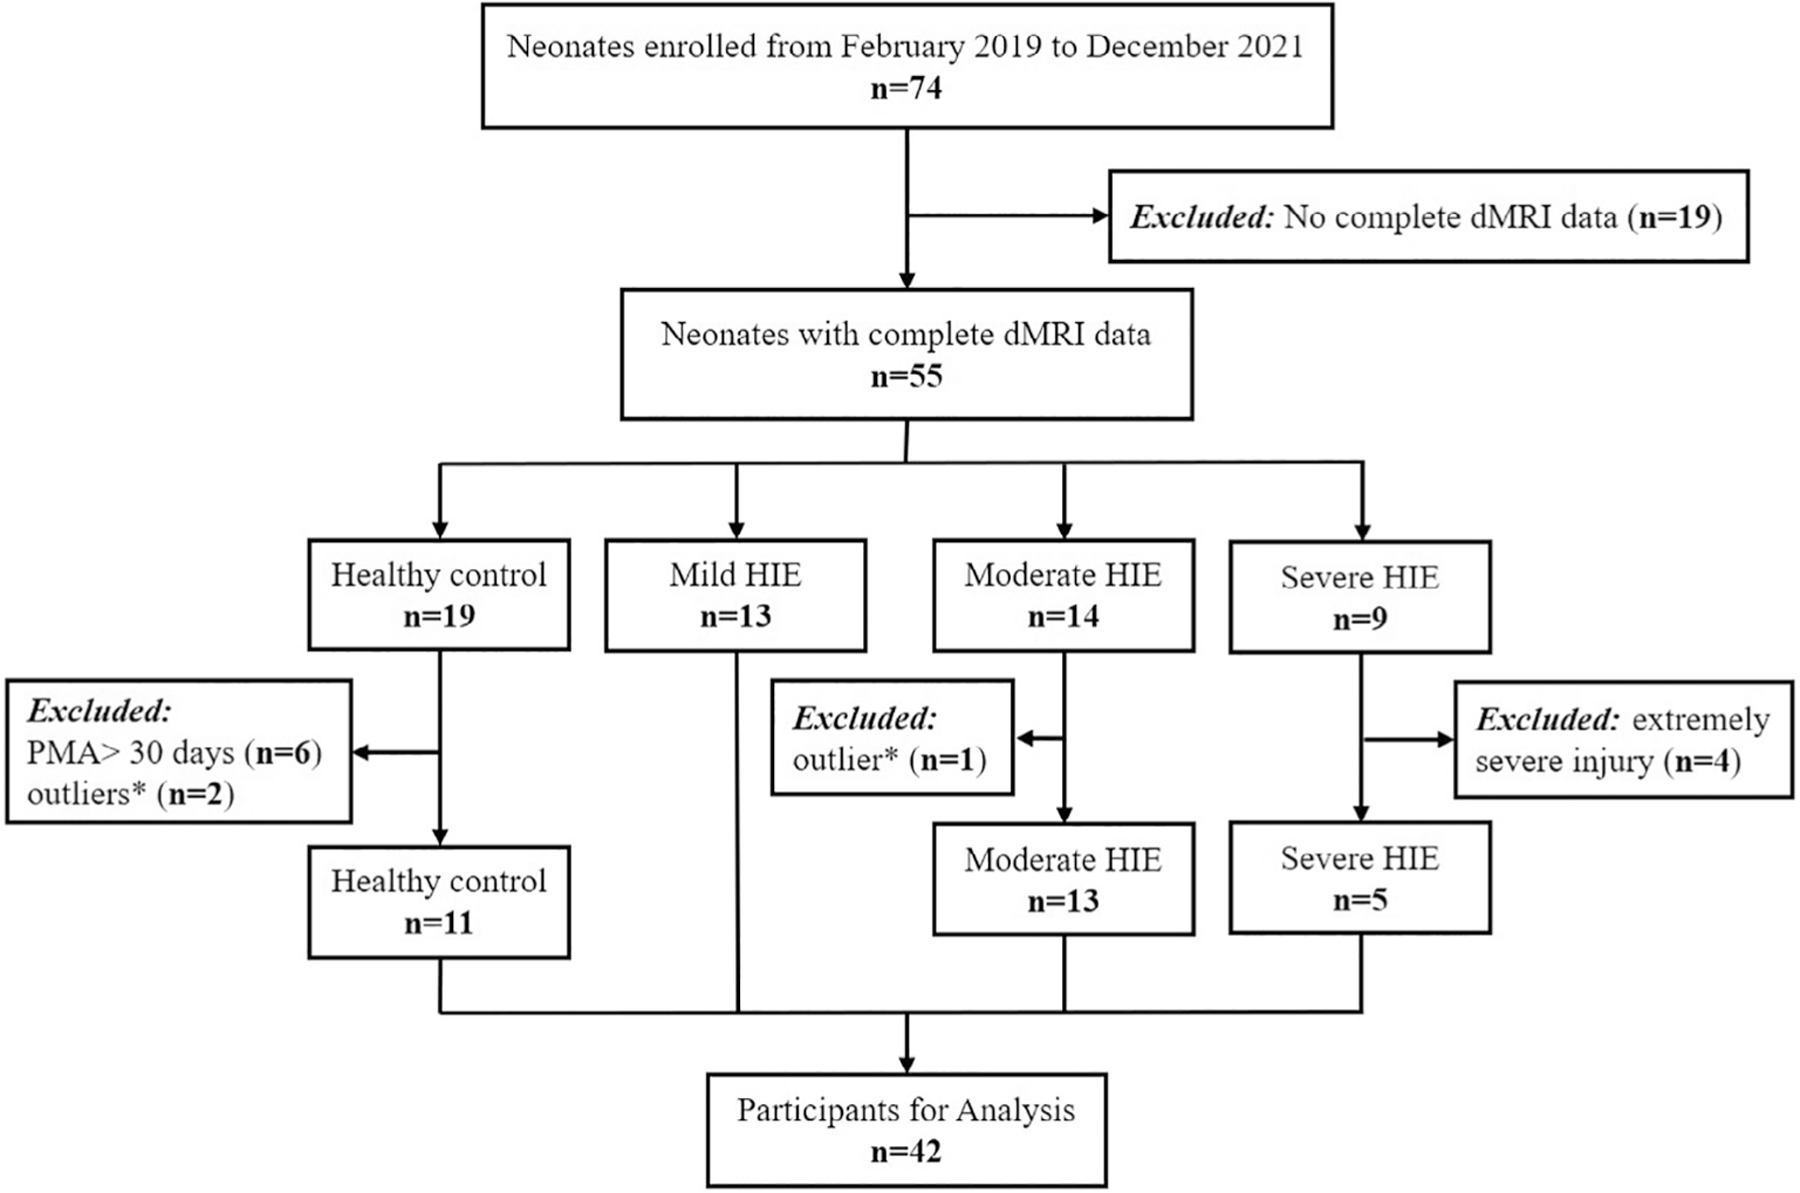
Population: A total of 42 neonates (24 males and 18 females).
Field strength/sequence: 3-T, diffusion-weighted echo-planar imaging.
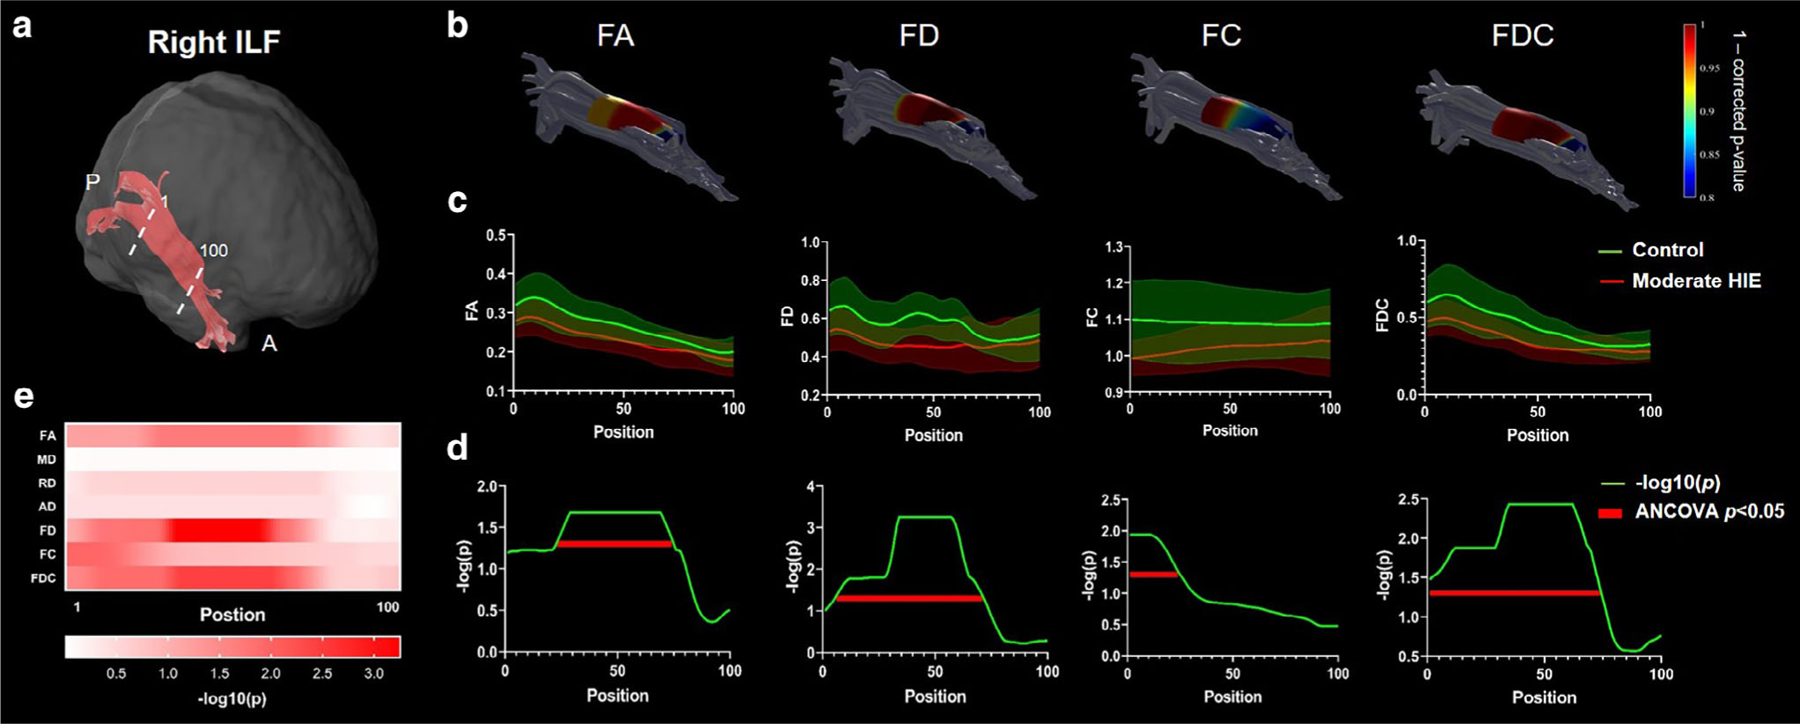
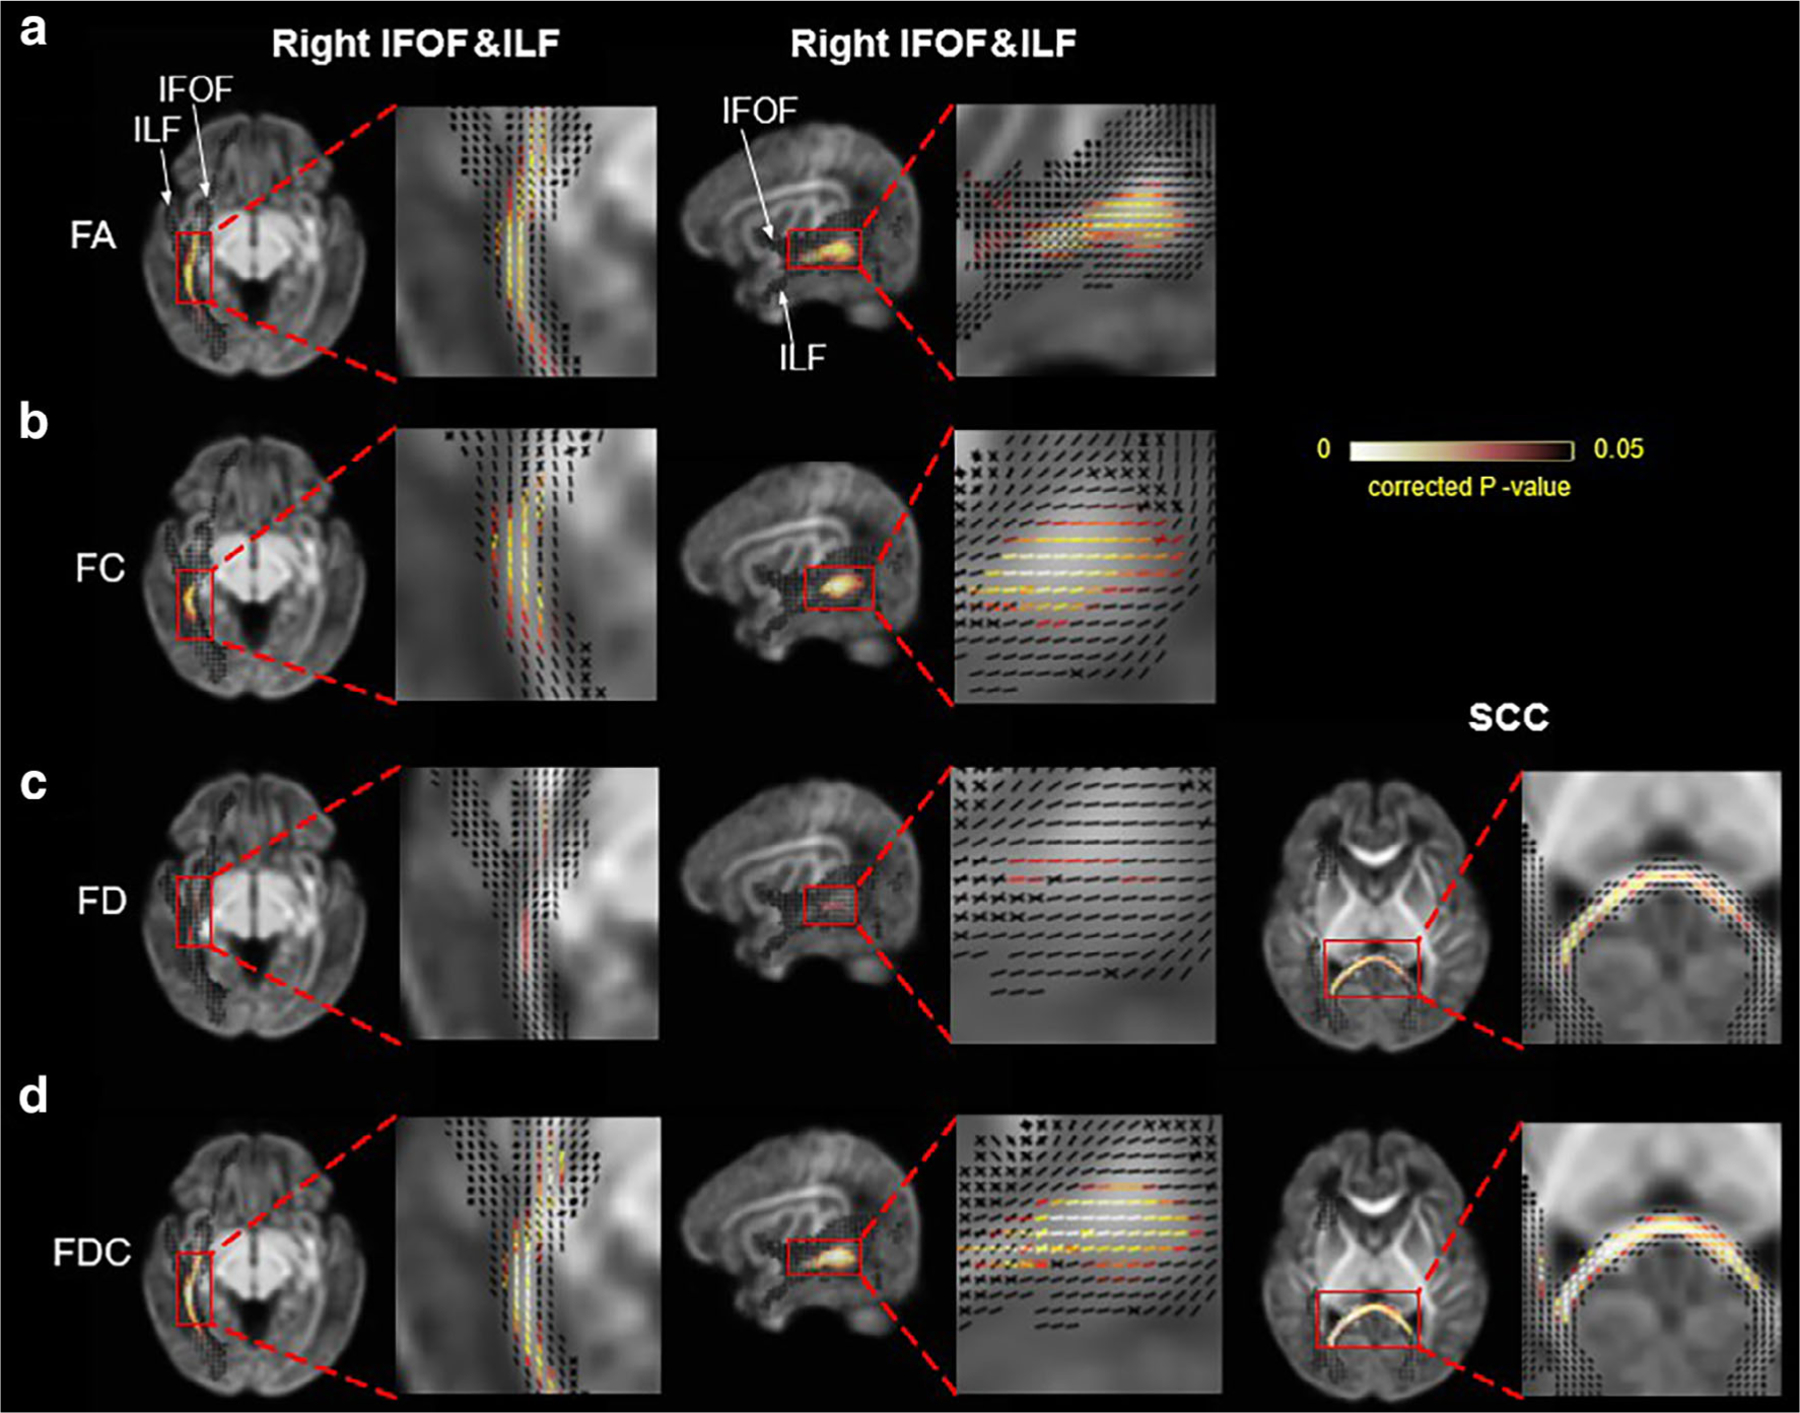
Assessment: Fractional anisotropy (FA), mean diffusivity (MD), radial diffusivity (RD), axial diffusivity (AD), fiber density (FD), fiber cross-section (FC), and fiber density and cross-section (FDC) were calculated in 40 ROIs and 6 tracts. Fixel-based analysis was performed to assess group differences in individual fiber components within a voxel (fixel).
Statistical tests: One-way analysis of covariance (ANCOVA) to compare dMRI metrics among severe/moderate/mild HIE and control groups and general linear model for fixel-wise group differences (age, sex, and body weight as covariates). Adjusted P value < 0.05 was considered statistically significant.
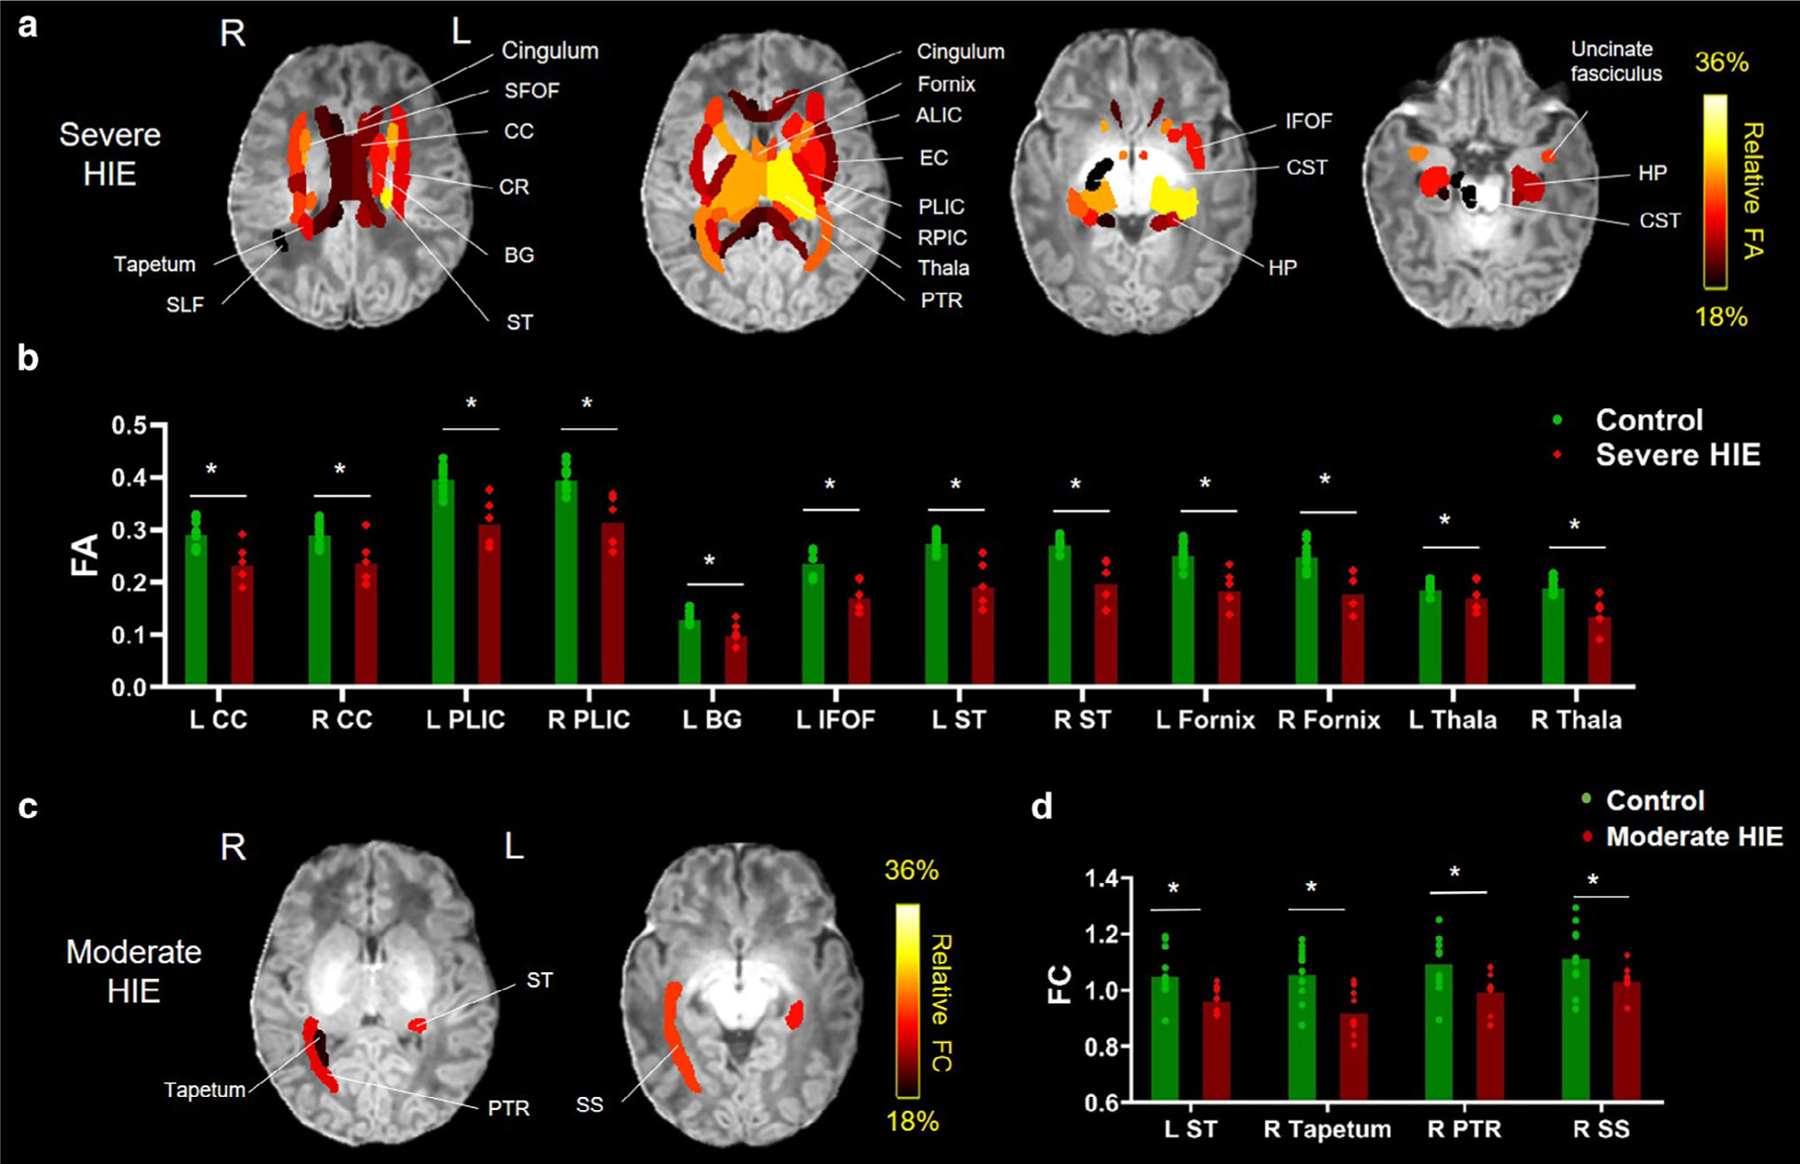
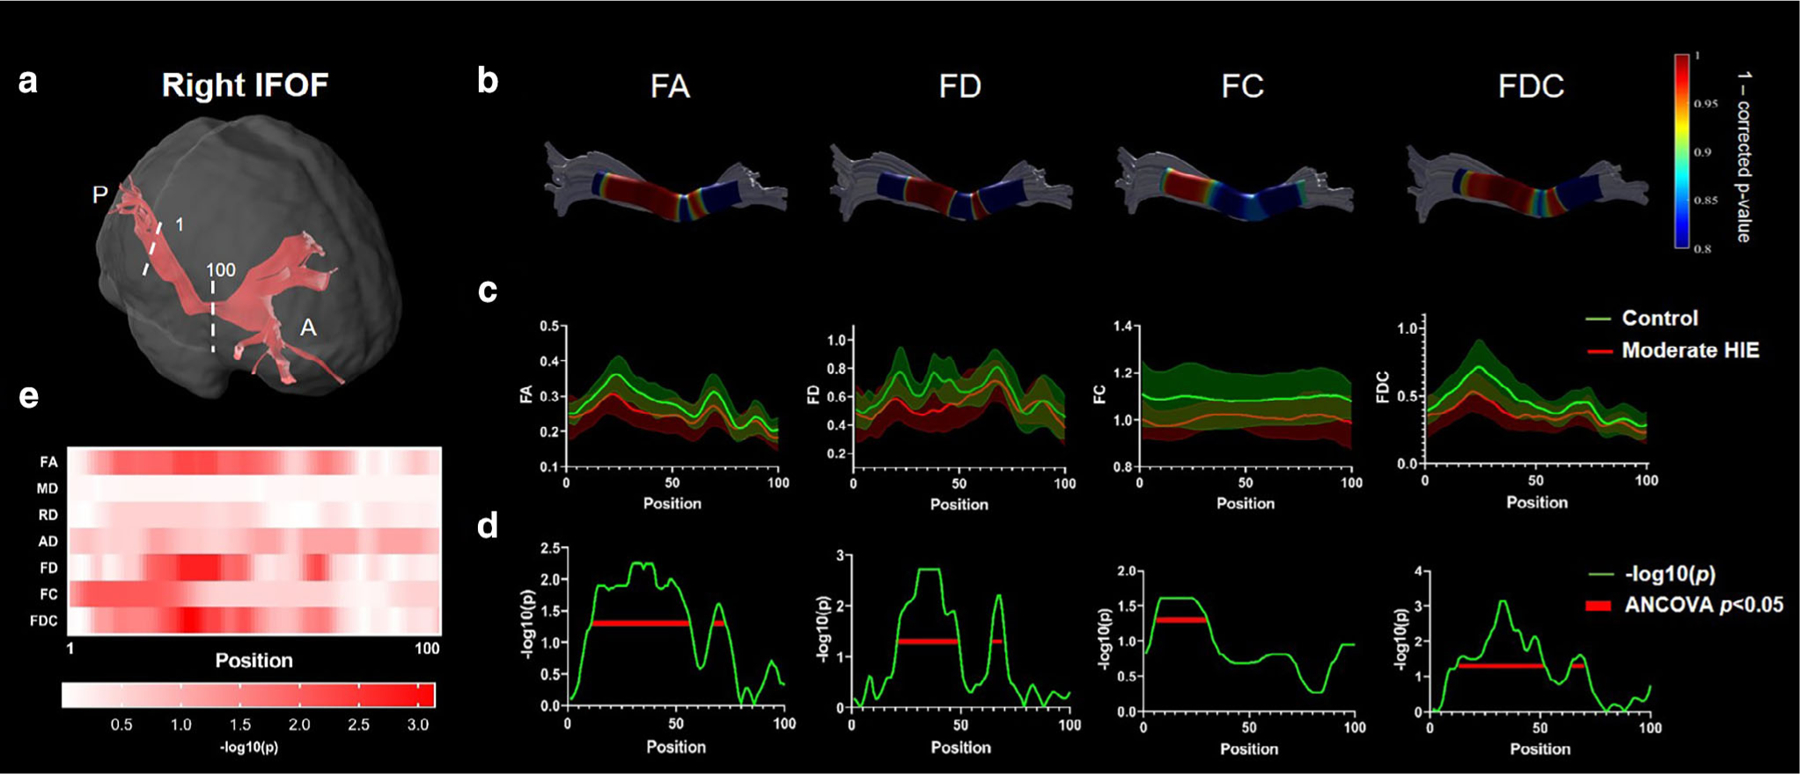
Results: For severe HIE, ROI-based analysis revealed widespread regions, including the deep nuclei and white matter with reduced FA, while in moderate injury, only FC was decreased around the posterior watershed zones. Tract-based analysis demonstrated significantly reduced FA, FD, and FC in the right inferior fronto-occipital fasciculus (IFOF), right inferior longitudinal fasciculus (ILF), and splenium of corpus callosum (SCC) in moderate HIE, and in right IFOF and left anterior thalamic radiation (ATR) in mild HIE. Correspondingly, we found altered fixels in the right middle-posterior IFOF and ILF, and in the central-to-right part of SCC in moderate HIE.
Data conclusion: For severe HIE, extensive microstructural injury was identified. For moderate-mild HIE, association fiber injury in posterior watershed area with a rightward lateralization was found.
Evidence level: 1 TECHNICAL EFFICACY: Stage 3.
Keywords: diffusion MRI; fixel; hypoxic-ischemic encephalopathy; microstructural alternation; region of interest; tract.
© 2022 International Society for Magnetic Resonance in Medicine.
Figures
Comment in
-
Editorial for "Microstructural Alterations in Projection and Association Fibers in Neonatal Hypoxia-Ischemia".J Magn Reson Imaging. 2023 Apr;57(4):1143. doi: 10.1002/jmri.28396. Epub 2022 Aug 15. J Magn Reson Imaging. 2023. PMID: 35969230 No abstract available.
Similar articles
-
Early detection of neonatal hypoxic-ischemic white matter injury: an MR diffusion tensor imaging study.Neuroreport. 2017 Sep 6;28(13):845-855. doi: 10.1097/WNR.0000000000000844. Neuroreport. 2017. PMID: 28704294 Free PMC article.
-
White matter fiber-specific degeneration in older adults with metabolic syndrome.Mol Metab. 2022 Aug;62:101527. doi: 10.1016/j.molmet.2022.101527. Epub 2022 Jun 9. Mol Metab. 2022. PMID: 35691528 Free PMC article.
-
Diffusion Tensor Imaging Detects Occult Cerebellar Injury in Severe Neonatal Hypoxic-Ischemic Encephalopathy.Dev Neurosci. 2017;39(1-4):207-214. doi: 10.1159/000454856. Epub 2017 Jan 18. Dev Neurosci. 2017. PMID: 28095379 Free PMC article.
-
Comparing Region of Interest versus Voxel-Wise Diffusion Tensor Imaging Analytic Methods in Mild and Moderate Traumatic Brain Injury: A Systematic Review and Meta-Analysis.J Neurotrauma. 2019 Apr 15;36(8):1222-1230. doi: 10.1089/neu.2018.5838. Epub 2018 Dec 19. J Neurotrauma. 2019. PMID: 30375271 Free PMC article.
-
Application of diffusion tensor imaging in the diagnosis of post-stroke aphasia: a meta-analysis and systematic review.Front Psychol. 2023 Sep 18;14:1140588. doi: 10.3389/fpsyg.2023.1140588. eCollection 2023. Front Psychol. 2023. PMID: 37790217 Free PMC article.
Cited by
-
Cortical structural degeneration and functional network connectivity changes in patients with subcortical vascular cognitive impairment.Neuroradiology. 2025 Jun;67(6):1469-1483. doi: 10.1007/s00234-025-03550-z. Epub 2025 Feb 3. Neuroradiology. 2025. PMID: 39899046
-
Emerging modalities for neuroprognostication in neonatal encephalopathy: harnessing the potential of artificial intelligence.Pediatr Res. 2025 Aug 19. doi: 10.1038/s41390-025-04336-y. Online ahead of print. Pediatr Res. 2025. PMID: 40830411 Review.
-
Vascular risk factors and neuroimaging heterogeneity across different white matter hyperintensities distribution patterns.Front Hum Neurosci. 2025 Jul 28;19:1633355. doi: 10.3389/fnhum.2025.1633355. eCollection 2025. Front Hum Neurosci. 2025. PMID: 40792178 Free PMC article.
-
Multidimensional structural analyses revealed a correlation between thalamic atrophy and white matter degeneration in idiopathic dystonia.Brain Commun. 2025 Jan 20;7(1):fcaf026. doi: 10.1093/braincomms/fcaf026. eCollection 2025. Brain Commun. 2025. PMID: 39882023 Free PMC article.
-
Quantification of Diffusion Magnetic Resonance Imaging for Prognostic Prediction of Neonatal Hypoxic-Ischemic Encephalopathy.Dev Neurosci. 2024;46(1):55-68. doi: 10.1159/000530938. Epub 2023 May 10. Dev Neurosci. 2024. PMID: 37231858 Free PMC article. Review.
References
-
- Finer N, Robertson C, Richards R, Pinnell L, Peters KJ. Hypoxic-ischemic encephalopathy in term neonates: Perinatal factors and outcome. J Pediatr 1981;98(1):112–117. - PubMed
-
- Badr LK, Purdy I. Brain injury in the infant: The old, the new, and the uncertain. J Perinat Neonatal Nurs 2006;20(2):163–175. - PubMed
-
- Sarnat HB, Sarnat MS. Neonatal encephalopathy following fetal distress: A clinical and electroencephalographic study. Arch Neurol 1976;33(10):696–705. - PubMed
-
- Walsh BH, Inder TE. MRI as a biomarker for mild neonatal encephalopathy. Early Hum Dev 2018;120:75–79. - PubMed
Publication types
MeSH terms
Grants and funding
LinkOut - more resources
Full Text Sources
Research Materials
Miscellaneous
