

Pediatric Cancer By Race, Ethnicity and Region in the United States
- PMID: 35861625
- PMCID: PMC9578755
- DOI: 10.1158/1055-9965.EPI-22-0317
Pediatric Cancer By Race, Ethnicity and Region in the United States
Abstract
Background: In a 2018 descriptive study, cancer incidence in children (age 0-19) in diagnosis years 2003 to 2014 was reported as being highest in New Hampshire and in the Northeast region.
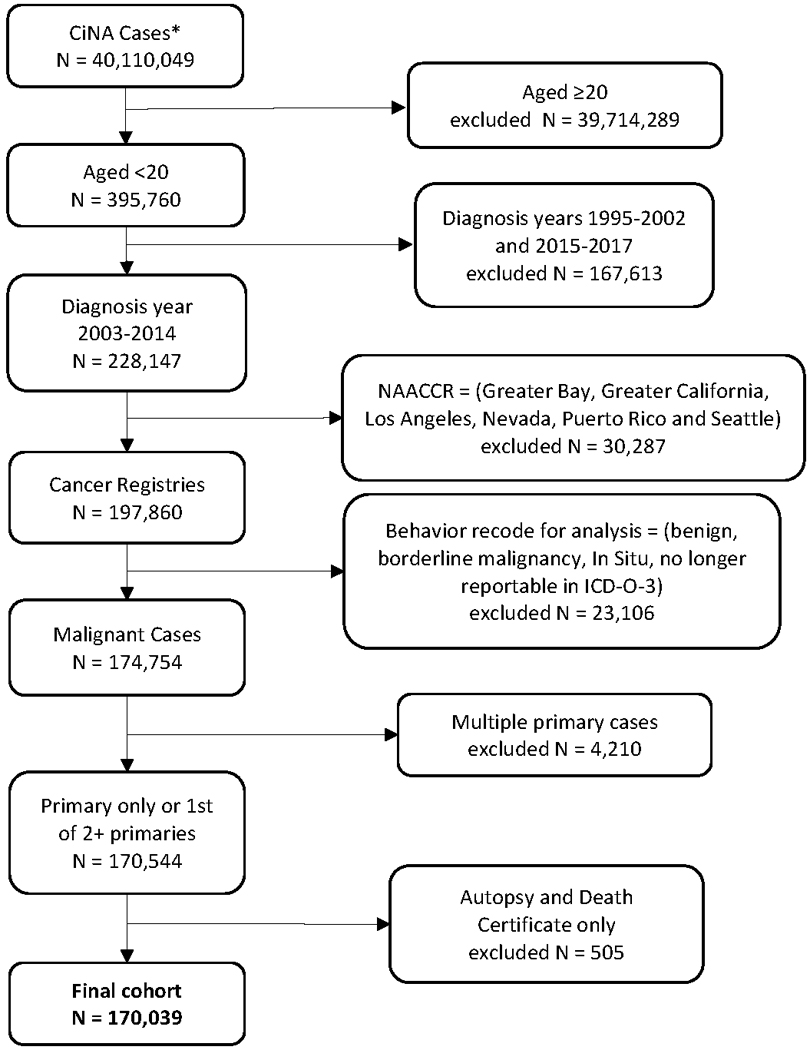
Methods: Using the Cancer in North America (CiNA) analytic file, we tested the hypotheses that incidence rates in the Northeast were higher than those in other regions of the United States either overall or by race/ethnicity group, and that rates in New Hampshire were higher than the Northeast region as a whole.
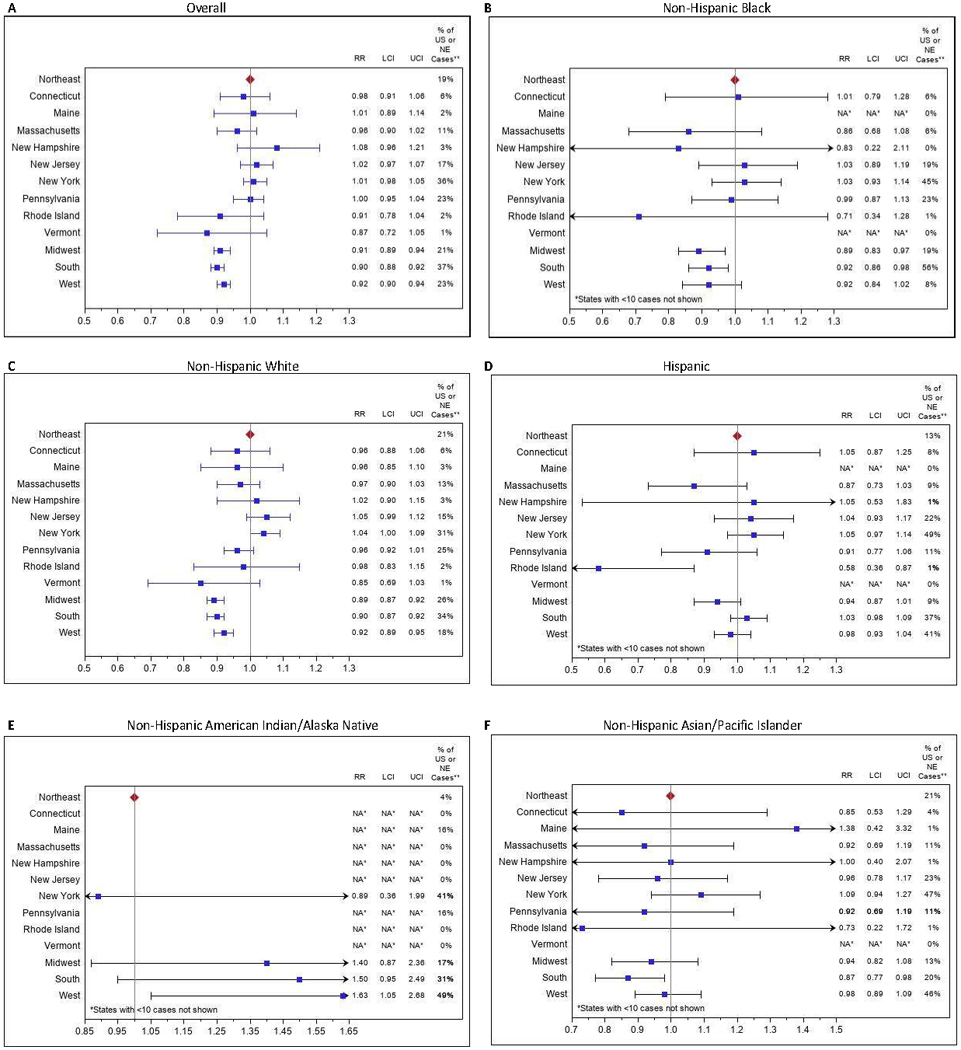
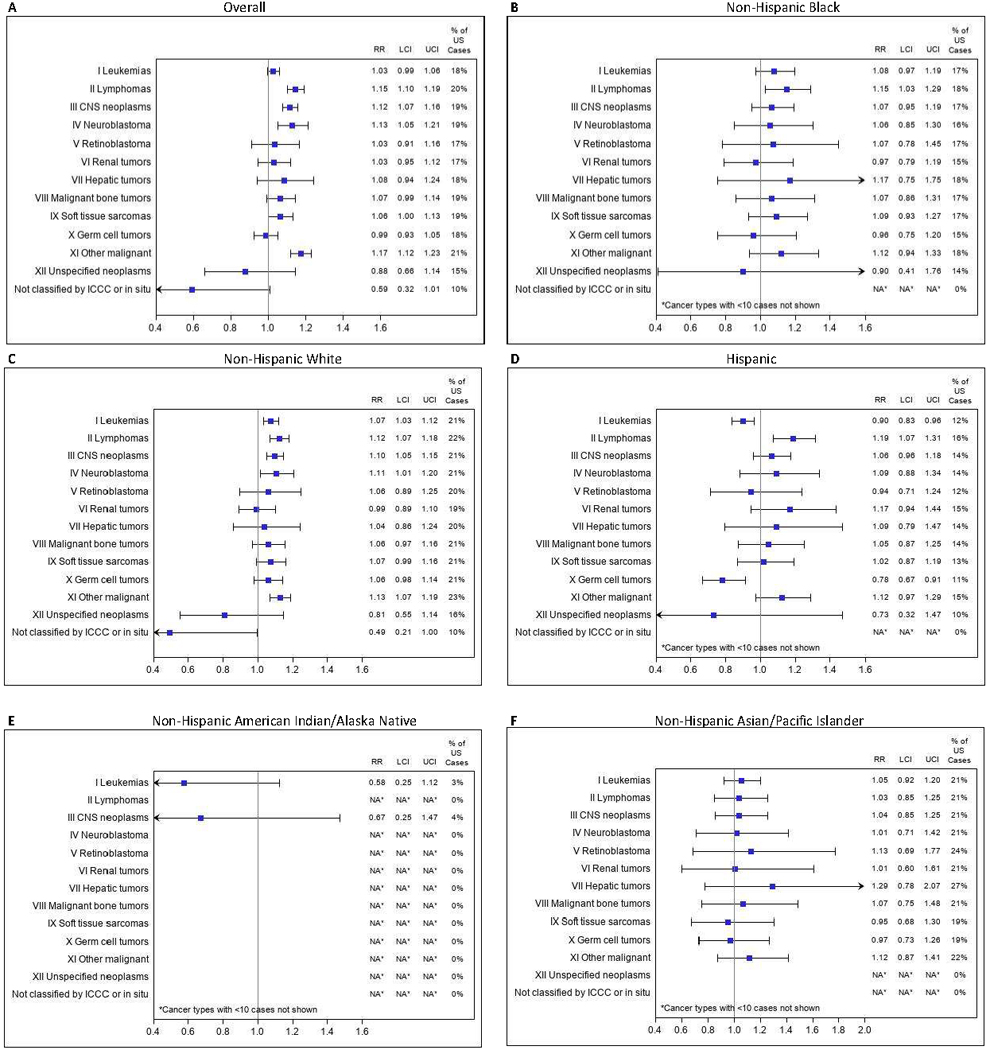
Results: In 2003 to 2014, pediatric cancer incidence was significantly higher in the Northeast than other regions of the United States overall and among non-Hispanic Whites and Blacks, but not among Hispanics and other racial minorities. However, there was no significant variability in incidence in the states within the Northeast overall or by race/ethnicity subgroup. Overall, statistically significantly higher incidence was seen in the Northeast for lymphomas [RR, 1.15; 99% confidence interval (CI), 1.10-1.19], central nervous system neoplasms (RR, 1.12; 99% CI, 1.07-1.16), and neuroblastoma (RR, 1.13; 99% CI, 1.05-1.21).
Conclusions: Pediatric cancer incidence is statistically significantly higher in the Northeast than in the rest of the United States, but within the Northeast, states have comparable incidence. Differences in cancer subtypes by ethnicity merit further investigation.
Impact: Our analyses clarify and extend previous reports by statistically confirming the hypothesis that the Northeast has the highest pediatric cancer rates in the country, by providing similar comparisons stratified by race/ethnicity, and by assessing variability within the Northeast.
©2022 American Association for Cancer Research.
Conflict of interest statement
Figures
Comment in
-
Pediatric Cancer in the Northeast United States-Letter.Cancer Epidemiol Biomarkers Prev. 2023 Jan 9;32(1):149. doi: 10.1158/1055-9965.EPI-22-1076. Cancer Epidemiol Biomarkers Prev. 2023. PMID: 36620895 No abstract available.
-
Pediatric Cancer in the Northeast United States-Reply.Cancer Epidemiol Biomarkers Prev. 2023 Jan 9;32(1):150. doi: 10.1158/1055-9965.EPI-22-1132. Cancer Epidemiol Biomarkers Prev. 2023. PMID: 36620896 No abstract available.
Similar articles
-
Examining the incidence of human papillomavirus-associated head and neck cancers by race and ethnicity in the U.S., 1995-2005.PLoS One. 2012;7(3):e32657. doi: 10.1371/journal.pone.0032657. Epub 2012 Mar 20. PLoS One. 2012. PMID: 22448226 Free PMC article.
-
Geographic Variation in Pediatric Cancer Incidence - United States, 2003-2014.MMWR Morb Mortal Wkly Rep. 2018 Jun 29;67(25):707-713. doi: 10.15585/mmwr.mm6725a2. MMWR Morb Mortal Wkly Rep. 2018. PMID: 29953430 Free PMC article.
-
Racial-ethnic disparities in mortality and kidney transplant outcomes among pediatric dialysis patients.Pediatr Nephrol. 2017 Apr;32(4):685-695. doi: 10.1007/s00467-016-3530-2. Epub 2016 Oct 29. Pediatr Nephrol. 2017. PMID: 27796622 Free PMC article.
-
Racial/ethnic disparities and incidence of malignant peripheral nerve sheath tumors: results from the Surveillance, Epidemiology, and End Results Program, 2000-2014.J Neurooncol. 2018 Aug;139(1):69-75. doi: 10.1007/s11060-018-2842-4. Epub 2018 Apr 16. J Neurooncol. 2018. PMID: 29663170 Free PMC article.
-
Is Our Science Representative? A Systematic Review of Racial and Ethnic Diversity in Orthopaedic Clinical Trials from 2000 to 2020.Clin Orthop Relat Res. 2022 May 1;480(5):848-858. doi: 10.1097/CORR.0000000000002050. Epub 2021 Dec 2. Clin Orthop Relat Res. 2022. PMID: 34855650 Free PMC article.
Cited by
-
Causes of Childhood Cancer: A Review of the Recent Literature: Part I-Childhood Factors.Cancers (Basel). 2024 Mar 27;16(7):1297. doi: 10.3390/cancers16071297. Cancers (Basel). 2024. PMID: 38610975 Free PMC article. Review.
-
Self protective health care in childhood cancer survivors from the perspective of survivors, parents, and professionals: a qualitative study.BMC Health Serv Res. 2024 Nov 5;24(1):1349. doi: 10.1186/s12913-024-11730-5. BMC Health Serv Res. 2024. PMID: 39501270 Free PMC article.
-
Cancer Epidemiology in the Northeastern United States (2013-2017).Cancer Res Commun. 2023 Aug 14;3(8):1538-1550. doi: 10.1158/2767-9764.CRC-23-0152. eCollection 2023 Aug. Cancer Res Commun. 2023. PMID: 37583435 Free PMC article.
-
Counts, incidence rates, and trends of pediatric cancer in the United States, 2003-2019.J Natl Cancer Inst. 2023 Nov 8;115(11):1337-1354. doi: 10.1093/jnci/djad115. J Natl Cancer Inst. 2023. PMID: 37433078 Free PMC article.
References
-
- Pediatric Seacoast Cancer Cluster Investigation: A Summary of Investigation Findings as of April 30, 2017: State of New Hampshire, Department of Health and Human Services, Division of Public Health Services; 2017.
-
- Investigation of Rhabdomyosarcoma (RMS) Cases in the Rye Area: New Hampshire Department of Health and Human Services, Division of Public Health Services; 2016.
-
- SEER*Stat Database: NAACCR Incidence Data - CiNA Analytic File, 1995–2017, for NHIAv2 Origin, Standard File, Rees (20–07) - Revaluation of MMWR Geo Variation of Pediatric Cancer (which includes data from CDC’s National Program of Cancer Registries (NPCR), CCCR’s Provincial and Territorial Registries, and the NCI’s Surveillance, Epidemiology and End Results (SEER) Registries), certified by the North American Association of Central Cancer Registries (NAACCR) as meeting high-quality incidence data standards for the specified time periods, submitted December 2019. NAACCR; 2021.
-
- Cancer in North America CiNA Data Products, 2018. at https://www.naaccr.org/cina-data-products-overview/.)
Publication types
MeSH terms
Grants and funding
LinkOut - more resources
Full Text Sources
Medical
