. 2022 Jul 5:101161CIRCRESAHA122320538.
doi: 10.1161/CIRCRESAHA.122.320538. Online ahead of print.

Flavin Containing Monooxygenase 2 Prevents Cardiac Fibrosis via CYP2J3-SMURF2 Axis

Affiliations

Flavin Containing Monooxygenase 2 Prevents Cardiac Fibrosis via CYP2J3-SMURF2 Axis

Cheng Ni et al. Circ Res. .

Abstract

Background: Cardiac fibrosis is a common pathological feature associated with adverse clinical outcome in postinjury remodeling and has no effective therapy. Using an unbiased transcriptome analysis, we identified FMO2 (flavin-containing monooxygenase 2) as a top-ranked gene dynamically expressed following myocardial infarction (MI) in hearts across different species including rodents, nonhuman primates, and human. However, the functional role of FMO2 in cardiac remodeling is largely unknown.

Methods: Single-nuclei transcriptome analysis was performed to identify FMO2 after MI; FMO2 ablation rats were generated both in genetic level using the CRISPR-cas9 (clustered regularly interspaced short palindromic repeats/clustered regularly interspaced short palindromic repeat-associated 9) technology and lentivirus-mediated manner. Gain-of-function experiments were conducted using postn-promoter FMO2, miR1a/miR133a-FMO2 lentivirus, and enzymatic activity mutant FMO2 lentivirus after MI.

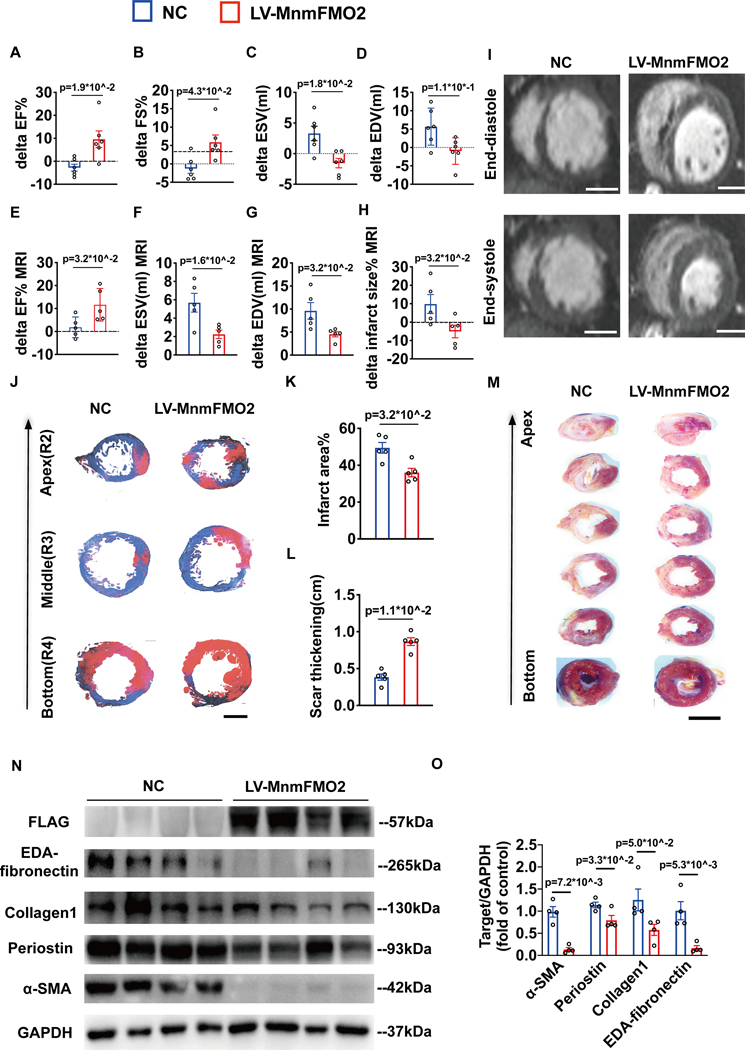
Results: A significant downregulation of FMO2 was consistently observed in hearts after MI in rodents, nonhuman primates, and patients. Single-nuclei transcriptome analysis showed cardiac expression of FMO2 was enriched in fibroblasts rather than myocytes. Elevated spontaneous tissue fibrosis was observed in the FMO2-null animals without external stress. In contrast, fibroblast-specific expression of FMO2 markedly reduced cardiac fibrosis following MI in rodents and nonhuman primates associated with diminished SMAD2/3 phosphorylation. Unexpectedly, the FMO2-mediated regulation in fibrosis and SMAD2/3 signaling was independent of its enzymatic activity. Rather, FMO2 was detected to interact with CYP2J3 (cytochrome p450 superfamily 2J3). Binding of FMO2 to CYP2J3 disrupted CYP2J3 interaction with SMURF2 (SMAD-specific E3 ubiquitin ligase 2) in cytosol, leading to increased cytoplasm to nuclear translocation of SMURF2 and consequent inhibition of SMAD2/3 signaling.

Conclusions: Loss of FMO2 is a conserved molecular signature in postinjury hearts. FMO2 possesses a previously uncharacterized enzyme-independent antifibrosis activity via the CYP2J3-SMURF2 axis. Restoring FMO2 expression exerts potent ameliorative effect against fibrotic remodeling in postinjury hearts from rodents to nonhuman primates. Therefore, FMO2 is a potential therapeutic target for treating cardiac fibrosis following injury.

Keywords: cytosol; downregulation; fibrosis; humans; myocardial infarction.


Figures

Figure 1.
Figure 1.. Myocardial injury triggers down-regulation of FMO2 (A-B).
FMO2 protein level in hearts (infarct zone) from post-MI SD rats (28 days post MI )(A) and quantitative analyses were plotted in (B), n=6 in each group; (C) UMAP plot showing 9 annotated cell types based on top enriched marker genes in the snRNA-seq data from 2 WT mouse hearts. (D) Feature Plot showing FMO2 scaled expression across the whole cell clusters in the dataset of C). Red dots labeling cells expressing FMO2 with up to 95% of the maximum level, and the top 5% high expressing cells were filtered in case of any unknown bias. (E) Violine Plot showing FMO2 scaled expression across the whole cell types in the mouse heart snRNA-seq data as shown in D). Default settings was used for the function in Seurat. (F) Western blotting conducted on cardiac fibroblast, cardiomyocyte and endothelial cells respectively isolated from sham or MI rats’ heart, FMO2 was determined to be mostly expressed in cardiac fibroblast in ex vivo heart. (G-H) Protein levels of FMO2 in hearts after myocardial infarction in mice with representative immunoblot images in (G) and quantitative analyses were plotted in (H), n=6 in each group. (I-J). FMO2 expression in hearts harvested from post-MI monkeys, quantitative analyses were plotted in (J), n=4 in each group. Student’s tests were conducted in (B), (H), and Mann-Whitney test was utilized in (J).
Figure 2.
Figure 2.. Loss of FMO2 incurs cardiac fibrosis accompanied by deteriorated cardiac function
(A). FMO2 protein level in rat heart at day 7, 14 and 28 after injection of the lentivial vector expressing FMO2 shRNA. (B-C). Left ventricular ejection fraction (B), left ventricular fraction shortening (C) measured by 2D echocardiography on rats received FMO2 shRNA and NC respectively at different time points (baseline, 14 and 28 days after injection), n=10 in each group. (D-G) Immunoblots for ECM proteins, including EDA-fibronectin, Collagen 1, periostin (D) as well as pro-fibrotic signaling (phosphorylated SMAD2/3) (F) in Sham, NC and LV-shFMO2 rat heart tissues (E) respectively. The summary data of were shown in (E) and (G), n=4 in each group, (H) Representative images of left ventricular stained with Sirius red showing degrees of fibrosis in rats treated with Sham, control (NC) and FMO2 shRNA vectors. (I) Quantitative summary of changes in fibrosis in the hearts treated with FMO2 shRNA compared with the rats treated with NC vectors, n=6 in each group, scale bar = 100μm. (J). Immunofluorescence staining for α-smooth muscle actin (α-SMA)–positive (red) and s100A4 positive (green) cardiac fibroblasts, scale bar = 100μm. (K) Quantification of α-SMA-s100A4 double positive cells per field. n=6 in each group. (L) Left ventricle ejection fraction (LVEF) and (M) fractional shortening (LVFS) of WT and FMO2−/− rats at 12 and 16 week after birth, n=8 in WT group, n=9 in FMO2−/− group. Error bar is SEM. (N). Picrosirius red staining showing different degrees of fibrosis in heart from WT and FMO2−/− rats. The summary data of fibrosis were shown in (O) for heart, n=8 in WT group, n=9 in FMO2−/− group, scale bar = 100μm. Error bar indicates SEM. (P-Q) Immunoblots for ECM proteins, including EDA-fibronectin, periostin, vimentin, and α-SMA, in WT (n=3) and FMO2−/− (n=4) rat heart tissues (P). Quantitative analyses were plotted in (Q). (R-S) Immunoblots for phosphorylation SMAD2/3 in WT and FMO2−/− group respectively (R). Quantitative analyses were plotted in (S), n=4 in each group. Two-way ANOVA followed by Sidak post hoc multiple comparisons test were conducted in (B-C). Kruskal-Wallis followed by Dunn post hoc multiple comparisons test were conducted in (E) and (G). Student’s tests were conducted in (I), (K), (L), (M), (O). Mann-Whitney test was utilized in (Q) and (S).
Figure 3.
Figure 3.. Therapeutic utilization of cardiac-fibroblast targeted FMO2 expression in ameliorating cardiac fibrosis after myocardial infarction
(A). Schematic experimental outline for intra-myocardial administration of non-myocyte targeted LV-FMO2 vector after MI surgery. (B). LVEF and (C) LVFS measured from 2-dimensional echocardiography in each experimental group including Sham, MI+DMEM, MI+NC, MI+miR133a/1a-TS-FMO2 (LV-nmFMO2), at different time points following MI, n=6 in sham and n=9 in MI+DMEM group, n=8 in MI+NC and n=11 in MI+LV-nmFMO2 group. (D) Representative images of picrosirius red staining from sequential heart sections on rats from each experimental group. (E) summary data on scar sizes, n=6 in each group. Scale bar = 1 cm. (F), Representative images of interstitial fibrosis in non-infarcted areas in heart from each experimental group. (G). Quantification of tissue fibrotic plotted as percent areas (means with SEM), n=6 per group. Scale bar = 100μm. (H). Schematic experimental outline for intra-myocardial administration of Postn-promoter FMO2 lentivirus following MI surgery. (I). LVEF and (J) LVFS measured from 2-dimensional echocardiography in each experimental group including Sham, MI+DMEM, MI+NC, Postn-promoter FMO2, at different time points following MI, n=6 in sham and n=8 in MI+DMEM group, n=7 in MI+NC and n=10 in Postn-promoter FMO2 group. (K) Representative images of picrosirius red staining from sequential heart section from rats of each experimental group. (L) Summary data of scar sizes, n=6 in each group. Scale bar = 1 cm. (M), Representative images of the interstitial fibrosis in non-infarcted area in each group. (N). Quantification of fibrosis was plotted as percentage of fibrotic areas (means with SEM), n=6 per group. Scale bar = 100μm. Two-way ANOVA followed by Sidak post hoc multiple comparisons test were conducted in (B-C) and (I-J). One-way ANOVA followed by Tukey post hoc multiple comparisons test were conducted in (E), (G), (L), (N).
Figure 4.
Figure 4.. Targeted expression of FMO2 in non-human primate heart after myocardial infarction significantly improves heart function.
(A-D) Changes in echocardiographic parameters between day-3 and 1-month post-LAD ligation in monkeys treated with a control lentiviral vector (NC) or the lentiviral vector expressing monkey miR133a/1a-TS-FMO2 (LV-MnmFMO2), including (A) ejection fraction (EF), (B) fractional shortening (FS), (C) end systolic volume (ESV), and (D) end-diastolic volume (EDV), as indicated, n=6 each group. (E-H) Changes in cardiac parameters between day 3 and 1 month post-LAD ligation measured by MRI in monkeys treated with a control lentiviral vector (NC) or the lentiviral vector expressing miR133a/1a-TS-FMO2 (LV-MnmFMO2), including (E) ejection fraction (EF), (F) end systolic volume (ESV), (G) end-diastolic volume (EDV), and (H) estimated infarct sizes as indicated, n=5 in each group. (I) Representative short-axis cine MRI images at end-diastolic and end-systolic phases of the cardiac cycle 1 month after MI. Scale bar = 1cm. (J). Representative images of MASSON trichrome staining on ventricular sections from monkeys treated with control vector (NC) and the lentiviral vector expressing miR133a/1a-TS-FMO2 (LV-MnmFMO2), scale bar = 1cm. Summary data of scar areas (K) and scar thickness (L), n=5 in each group. (M) Representative consecutive segments sliced from monkey hearts one month after MI and treated with control vector (NC) and the lentiviral vector expressing miR133a/1a-TS-FMO2 (LV-MnmFMO2). Scale bar = 2cm. (N-O) Expression of extracellular matrix proteins in heart tissues harvested from monkey hearts. n=4 in each group as indicated, GAPDH was served as a loading control. Statistical analyses were plotted in (O). Student’s tests were conducted in (A-D), Mann-Whitney test were utilized in (E-H), (K-L) and (O).
Figure 5.
Figure 5.. FMO2 exerts anti-fibrotic effect on TGF-β stimulated cardiac fibroblasts independent of its enzymatic activity.
(A). FMO2 protein detected in isolated neonatal cardiac fibroblast after TGF-β treatment at different concentration as indicated. (B) Fibrotic protein expression in cardiac fibroblasts (CF) isolated from WT adult rat heart or the FMO2−/− adult rat heart as indicated. (C) Quantitative bar graphs of fibrotic proteins, n=3 in each group. (D) Fibrotic protein expression in cardiac fibroblast isolated from FMO2−/− adult rat following TGF-β treatment with or without co-treatment of lenti-FMO2 (LV-FMO2) vector as labeled (E) Quantitative of fibrotic proteins were plotted, n=3 in each group. (F). Fibrotic protein levels in the wildtype CFs (WT) treated without or with TGF-β plus LV-FMO2 or LV-mut FMO2 mutant as indicated. (G) Quantitative results of fibrotic proteins from (F) were plotted, n=3 in each group. Student’s t test was utilized in (C), One-way ANOVA followed by Tukey post hoc multiple comparisons test were conducted in (E), (G).
Figure 6.
Figure 6.. FMO2 inhibits phosphorylated SMAD2/3 via interaction with CYP2J3.
(A-B). TGF-β downstream signaling molecules detected by western blot in cardiac fibroblasts (CFs) in response to TGF-β stimulation with or without FMO2 expression, showing a specific impact on phosphor-SMAD2/3 levels. A). Quantitative analyses were plotted in B), n=3 in each group. (C). Co-immunoprecipitation assay showing FMO2-CYP2J3 binding in CFs expressing FLAG-FMO2 and HA-CYP2J3 using anti-HA for immunoprecipitation followed by anti-FLAG immunoblotting. (D) Co-immunoprecipitation assay in CFs expressing FLAG-FMO2 and HA-CYP2J3 using anti-FLAG for immunoprecipitation followed by anti-HA immunoblotting. (E-F). Immunoblot of fibrotic proteins in TGF-β stimulated CFs with FMO2 expression and CYP2J3 knock-down by a lenti-vector (LV-shCYP2J3) as indicated E), Quantitative analyses were plotted in F), n=3 in each group. (G-H) TGF-β signal and phosphorylation of SMAD2/3 in CFs treated with TGF-β and lentivectors for FMO2 (LV-FMO2) and CYP2J3 shRNA (LV-shCYP2J3) as indicated G), Quantitative analyses were plotted in H), n=3 in each group. (I). Co-immunoprecipitation assay using wildtype CYP2J3 and wildtype and mutated FMO2. (J). Co-immunoprecipitation assays using wildtype FMO2 with wildtype and mutated CYP2J3. One-way ANOVA followed by Tukey post hoc multiple comparisons test were conducted in (B), (F), (H).
Figure 7.
Figure 7.. FMO2-CYP2J3 inhibits phosphorylation of SMAD2/3 via promoting SMURF2 nuclear translocation.
A). MG132 treatment in NRCF reversed the inhibition of phosphorylated SMAD2/3 exerted by FMO2 in the present of TGF-β stimulation. (B-C). Immunoblots display extracellular matrix protein synthesis in CFs treated with TGF-β, FMO2 overexpression, and SMURF2 knockdown (LV-shSMURF2) as indicated B). Quantitative analyses were plotted in C), n=3 in each group. (D-E). Immunoblots showing phosphorylation of SMAD2/3 in CFs treated as in B. D) Quantitative analyses were plotted in E), n=3 in each group. (F-G). Reciprocal co-immunoprecipitation assays between CYP2J3 and SMURF2 in CFs expressing HA-CYP2J3 and FLAG-SMURF2. (H-I). FMO2 over-expression reduced interaction between CYP2J3 and SMURF2 (J). Increased nuclear translocation of SMURF2 was observed in CFs by FMO2 overexpression under TGF-β stimulation as shown in western blots from the cytosolic and the nuclear fractions as indicated. Fold change of SMURF2 in each group as compared with SMURF2 in cytoplasm of WT were annotated under the band, n=3 in each group. (K-L). Immunoblots displayed alterations of extracellular protein synthesis (K) and phosphorylation of SMAD2/3 (L) in NRCFs expressing wildtype FMO2 or CYP2J3 binding site mutated FMO2 (△FMO2). One-way ANOVA followed by Tukey post hoc multiple comparisons test were conducted in (C), (E).
Figure 8.
Figure 8.. FMO2 expression and anti-fibrosis effect in human samples
A). Collagen1 staining in hearts from LV free wall of normal control and MI patients respectively. Scale bar = 100μm. (B). FMO2 expression in heart tissues from healthy controls and MI patients, n=3 in each group and (C) quantitative results. (D). Levels of extracellular matrix proteins in CF isolated from normal and post-MI human hearts, as well as CF from a MI heart transfected with lentiviral vectors for non-specific control (NC) and expressing human FMO2 (LV-hFMO2), and (E) quantitative results, n=3 in each group. (F). Levels of pro-fibrotic signaling in CF isolated from normal and post-MI human hearts, as well as CF from a MI heart transfected with lentiviral vectors for non-specific control (NC) and expressing human FMO2 (LV-hFMO2), and (G) quantitative results, n=3 in each group. (H). Cellular morphology and vimentin expression profile observed using immunofluorescence staining in CFs from normal, MI, MI+NC, MI+LV-hFMO2, scale bar = 100μm in immunostaining images, scale bar = 250μm in light visions. One-way ANOVA followed by Tukey post hoc multiple comparisons test were conducted in (E) and (G), Mann-Whitney test were utilized in (C).

References

    1. Cohn JN, Ferrari R, Sharpe N. Cardiac remodeling--concepts and clinical implications: a consensus paper from an international forum on cardiac remodeling. Behalf of an International Forum on Cardiac Remodeling. J Am Coll Cardiol. 2000;35:569–582. - PubMed
    1. Tallquist MD, Molkentin JD. Redefining the identity of cardiac fibroblasts. Nature Reviews Cardiology. 2017;14:484–491. doi: 10.1038/nrcardio.2017.57 - DOI - PMC - PubMed
    1. Mora AL, Rojas M, Pardo A, Selman M. Emerging therapies for idiopathic pulmonary fibrosis, a progressive age-related disease. Nat Rev Drug Discov. 2017;16:810. doi: 10.1038/nrd.2017.225 - DOI - PMC - PubMed
    1. Humphreys BD. Mechanisms of Renal Fibrosis. Annu Rev Physiol. 2018;80:309–326. doi: 10.1146/annurev-physiol-022516-034227 - DOI - PubMed
    1. Willyard C. Unlocking the secrets of scar-free skin healing. Nature. 2018;563:S86–S88. doi: 10.1038/d41586-018-07430-w - DOI - PubMed