. 2022 Sep 5;221(9):e202205058.
doi: 10.1083/jcb.202205058. Epub 2022 Jul 21.

Centriole growth is limited by the Cdk/Cyclin-dependent phosphorylation of Ana2/STIL

Affiliations

Centriole growth is limited by the Cdk/Cyclin-dependent phosphorylation of Ana2/STIL

Thomas L Steinacker et al. J Cell Biol. .

Abstract

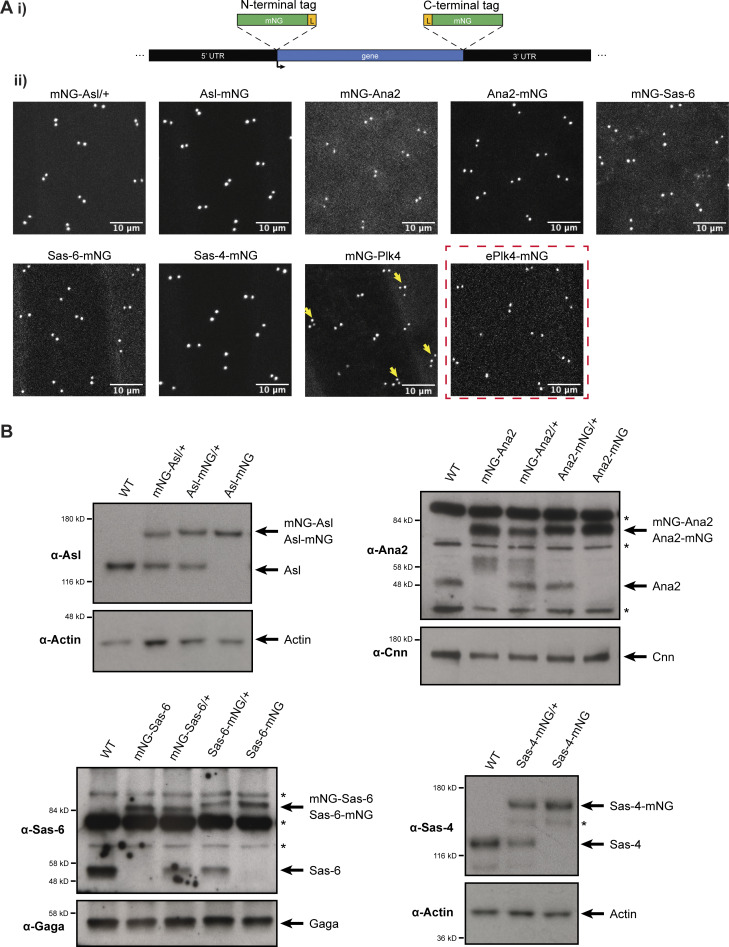
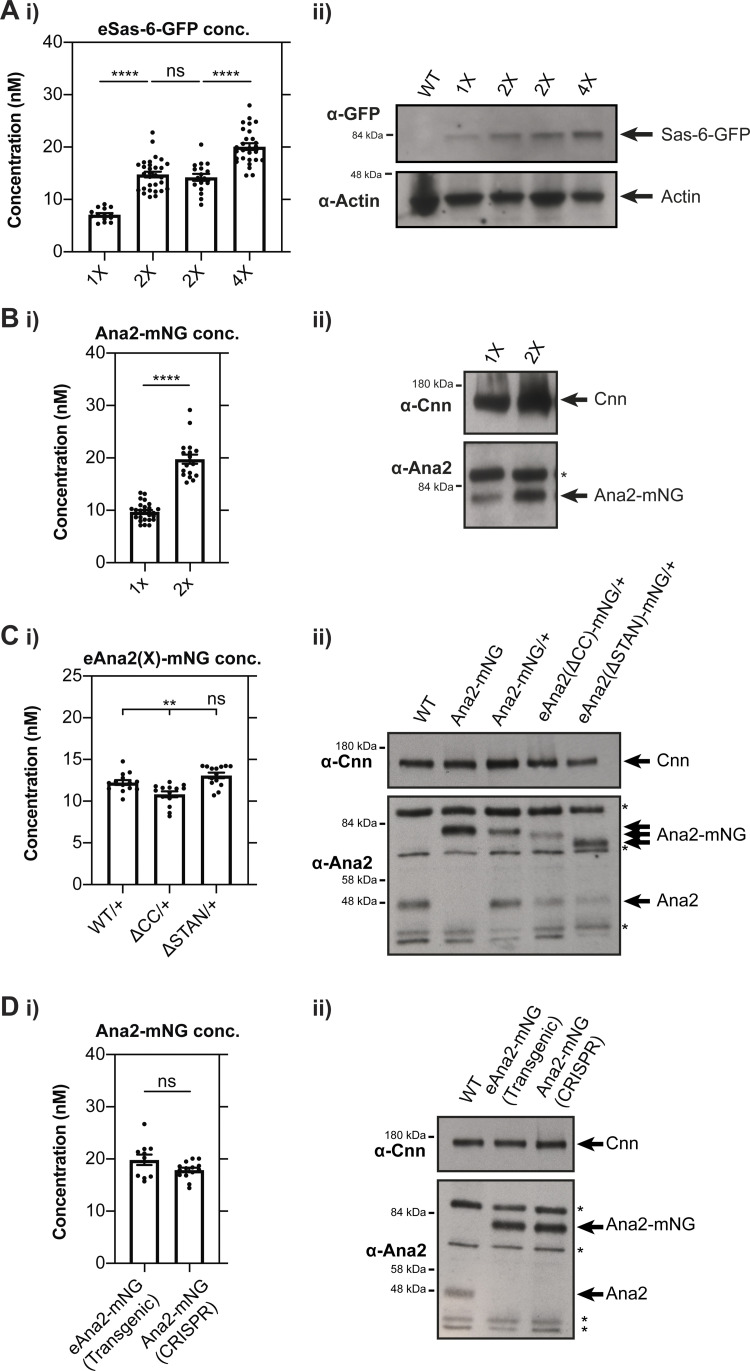
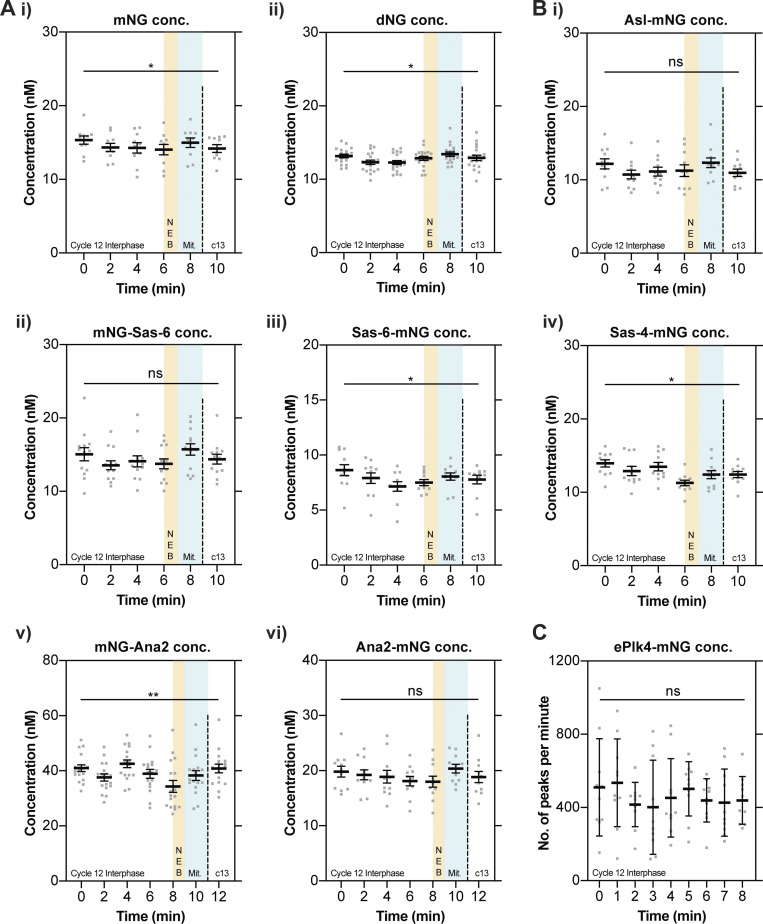
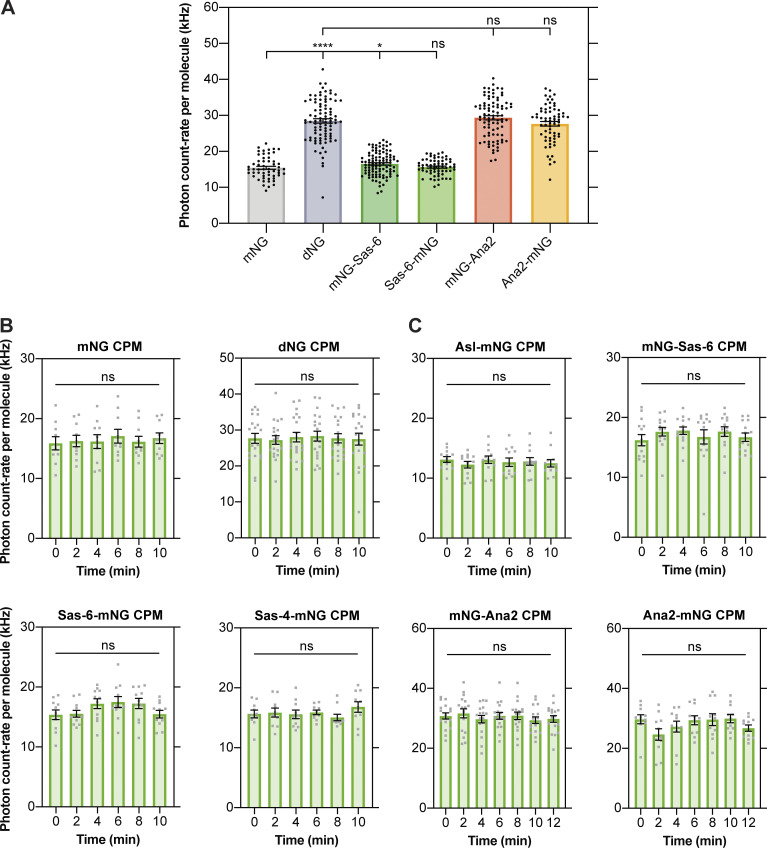
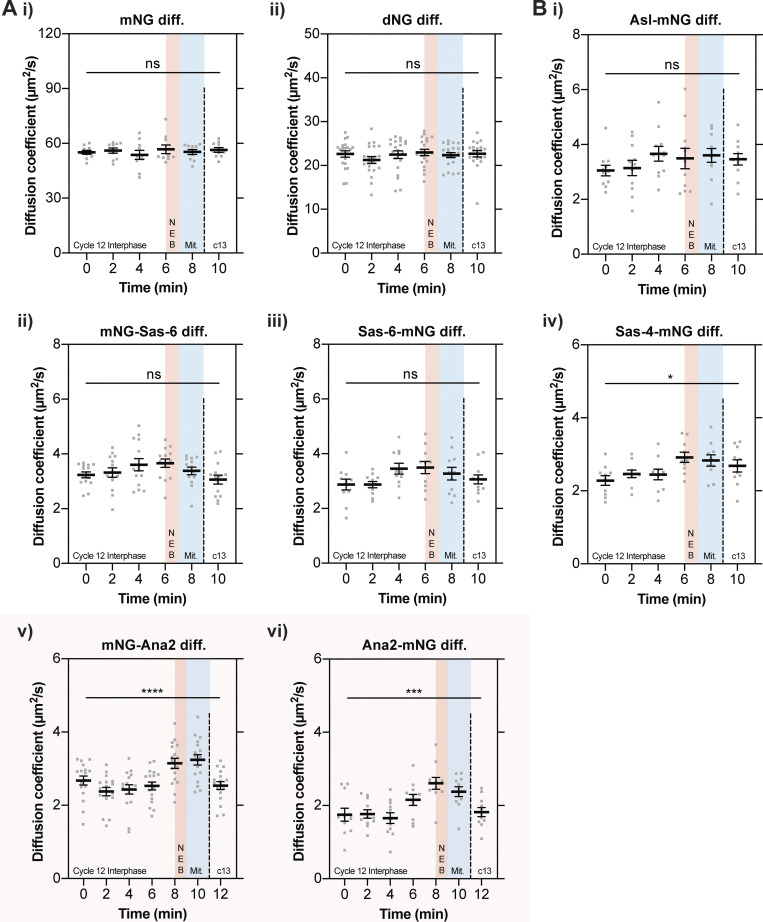
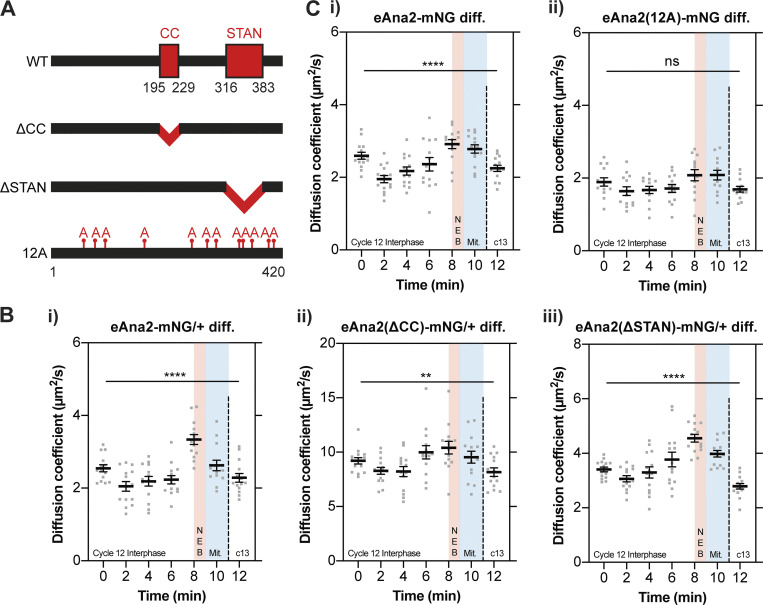
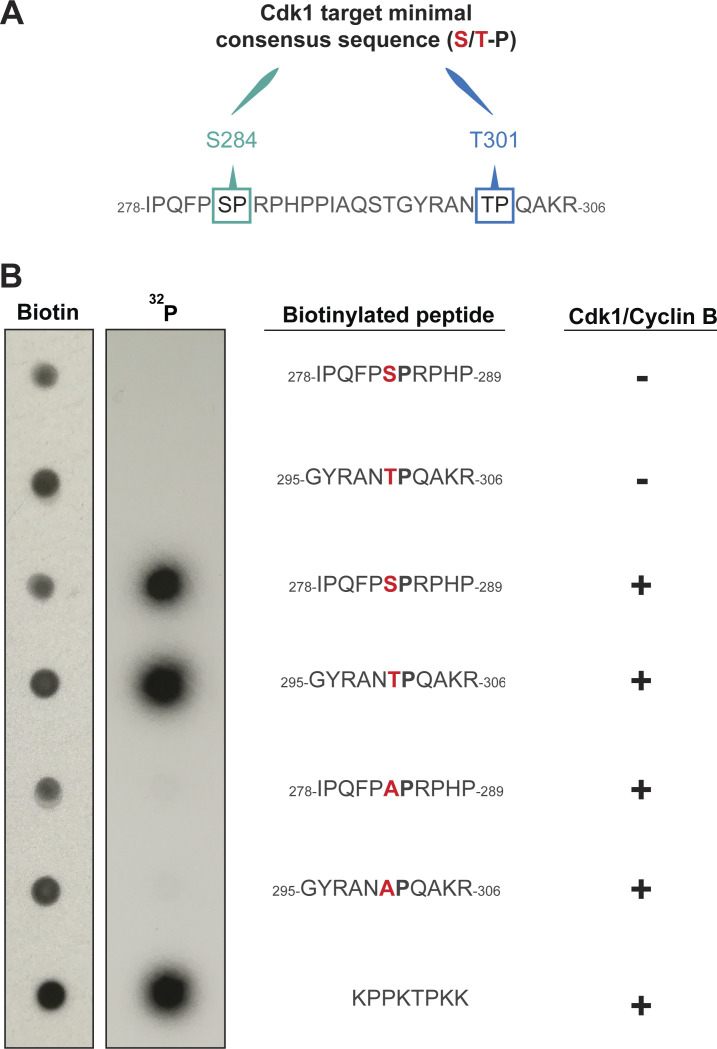
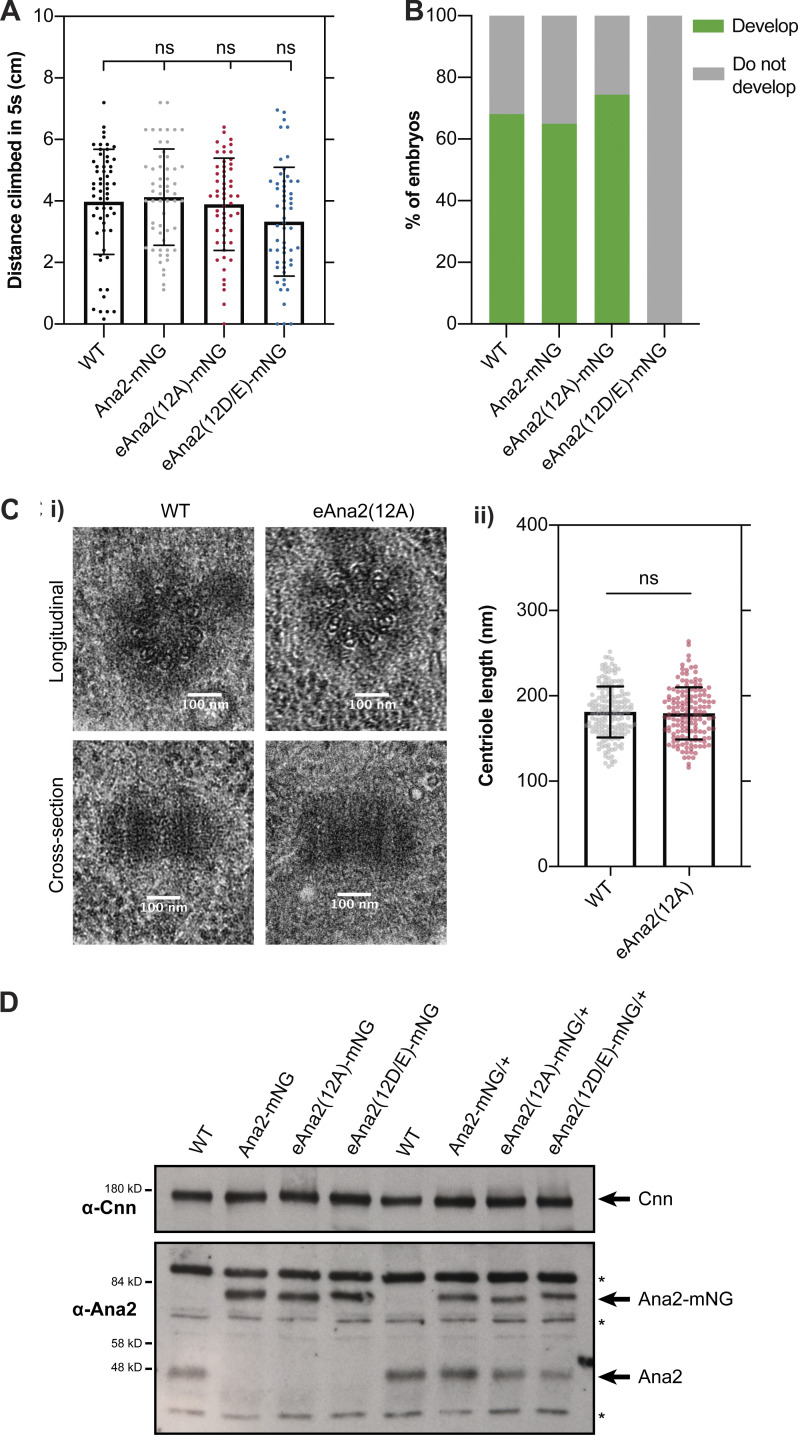
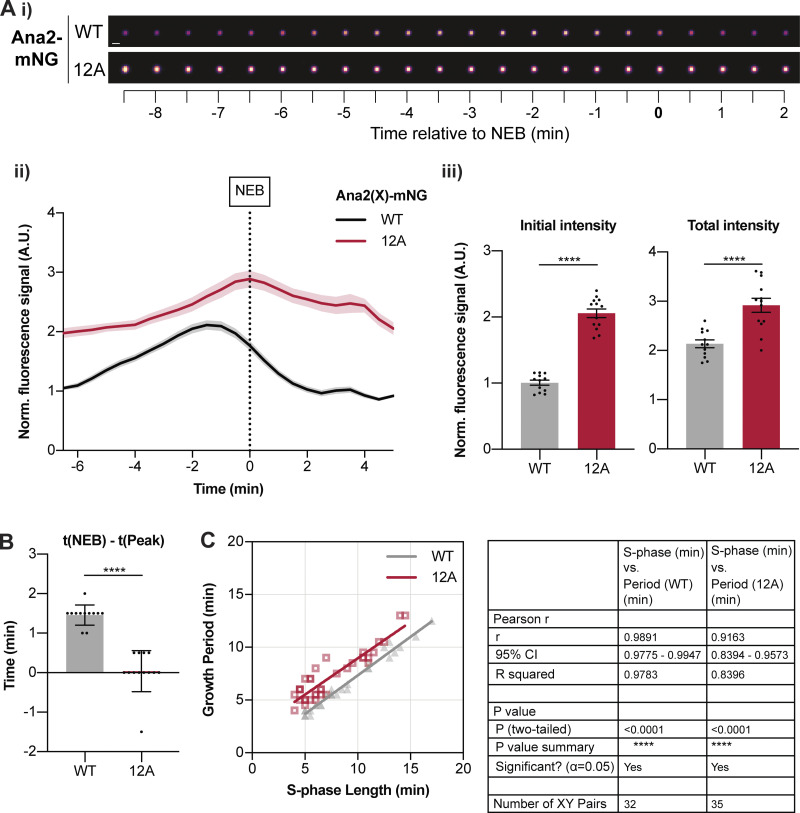
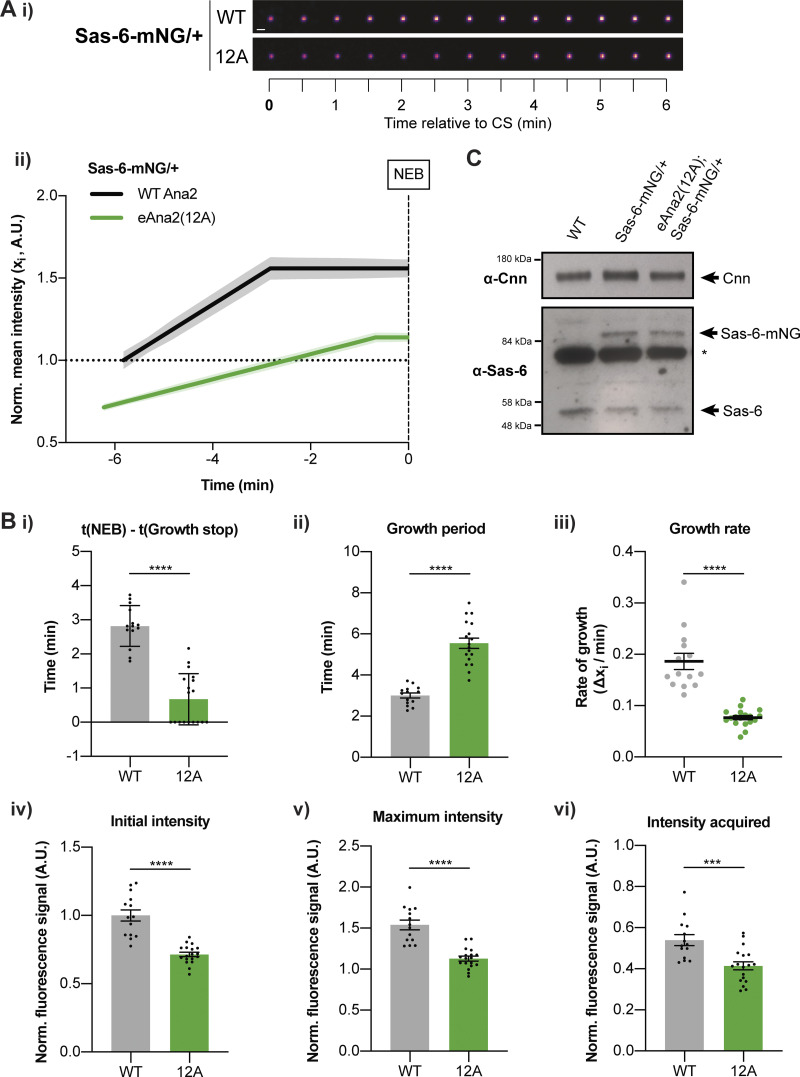
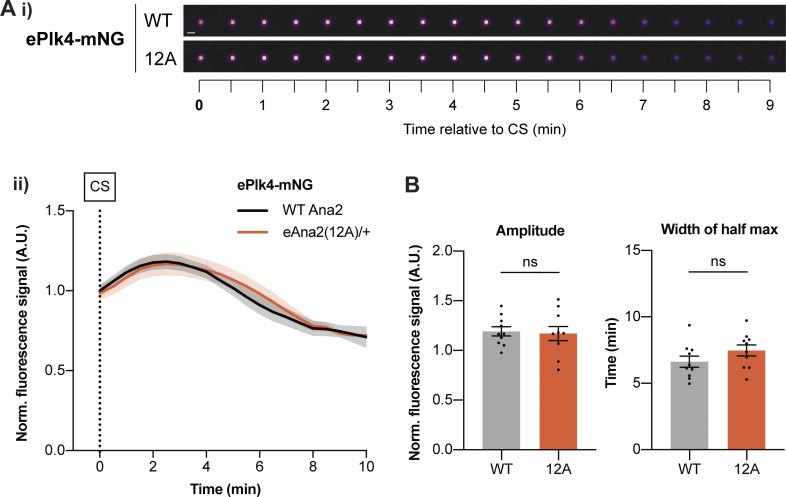
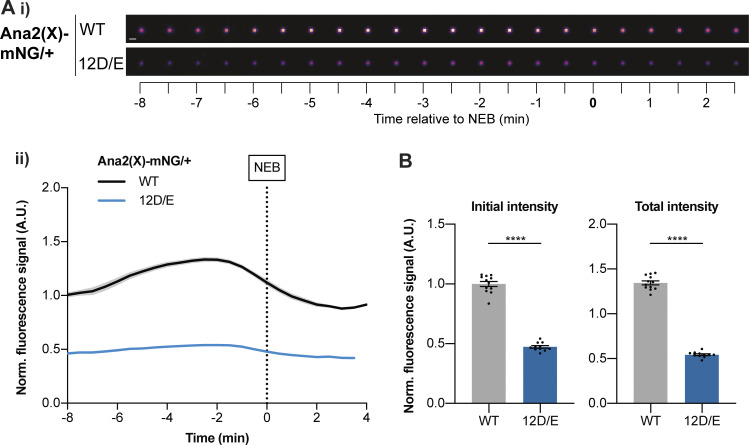
Centrioles duplicate once per cell cycle, but it is unclear how daughter centrioles assemble at the right time and place and grow to the right size. Here, we show that in Drosophila embryos the cytoplasmic concentrations of the key centriole assembly proteins Asl, Plk4, Ana2, Sas-6, and Sas-4 are low, but remain constant throughout the assembly process-indicating that none of them are limiting for centriole assembly. The cytoplasmic diffusion rate of Ana2/STIL, however, increased significantly toward the end of S-phase as Cdk/Cyclin activity in the embryo increased. A mutant form of Ana2 that cannot be phosphorylated by Cdk/Cyclins did not exhibit this diffusion change and allowed daughter centrioles to grow for an extended period. Thus, the Cdk/Cyclin-dependent phosphorylation of Ana2 seems to reduce the efficiency of daughter centriole assembly toward the end of S-phase. This helps to ensure that daughter centrioles stop growing at the correct time, and presumably also helps to explain why centrioles cannot duplicate during mitosis.


Figures

Figure 1.
Figure 1.
Generation of endogenously mNG-tagged centriolar proteins. (A i) Schematic illustration of the strategy to “knock-in” mNG at the N- or C-terminus of an endogenous locus; (L) is a short linker sequence. (ii) Images show the centriolar localization of the mNG-tagged CRISPR/Cas9-mediated knock-ins in living syncytial embryos (all images acquired in the early S-phase of nuclear cycle 12). N-terminally tagged mNG-Asl was not viable so it was expressed in a heterozygous (mNG-Asl/+) background. N-terminally tagged mNG-Plk4 consistently caused centriole overduplication (yellow arrows), so in subsequent experiments, we used a P-element insertion line of Plk4-mNG expressed from its endogenous promoter in the Plk4−/− mutant background, (ePlk4-mNG, red dashed box). (B) Western blots show the expression levels of CRISPR/Cas9 knock-in lines and their cognate untagged endogenous proteins in 0–2 h old embryos. Prominent non-specific bands are highlighted (*); Actin, Cnn, and the Gaga transcription factor are shown as loading controls. A representative blot is shown from at least two technical repeats.
Figure S1.
Figure S1.
FCS can be used to measure cytoplasmic protein concentrations in the early Drosophila embryo. (A i) Graph shows the FCS-measured concentration (mean ± SEM) of Sas-6-GFP expressed transgenically from its endogenous promoter in embryos laid by females expressing either: 1 copy of the transgene (1X); 2 copies of the transgene (2X—shown for two different transgenic lines); four copies of the transgene (4X). Each data point represents the average of 4–6× 10-s recordings from an individual embryo (N ≥ 14). (ii) Western blots of 0–2 h old embryos laid by the females described in A (i). (B i) Graph shows the FCS-measured concentration (mean ± SEM) of Ana2-mNG expressed from a CRISPR/Cas9 knock-in line as either a heterozygote (1X) or homozygote (2X). Each data point represents the average of 4–6× 10-s recordings from an individual embryo (N ≥ 18). (ii) Western blots of 0–2 h old embryos laid by the females described in B (i). (C i) Graph shows FCS-measured cytoplasmic concentrations (mean ± SEM) of WT Ana2-mNG, eAna2(∆CC)-mNG and eAna2(∆STAN)-mNG (all in an ana2+/− heterozygous background). Each data point represents the average of 4–6× 10-s recordings from an individual embryo (N = 14). (ii) Western blots of 0–2 h embryos showing the expression levels of endogenous Ana2, a homozygous WT Ana2-mNG knock-in line, and transgenic lines expressing either WT Ana2-mNG, eAna2(∆CC)-mNG and eAna2(∆STAN)-mNG (all in an ana2+/− heterozygous background). (D i) Graph compares FCS-measured cytoplasmic Ana2-mNG concentrations (mean ± SEM) in the transgenic WT eAna2-mNG (generated by P-element mediate transformation and expressed in an ana2-/- mutant background) and CRISPR/Cas9 knock-in Ana2-mNG lines. Each data point represents the average of 4–6× 10-s recordings from an individual embryo (N ≥ 11). (ii) Western blots of 0–2 h embryos comparing the expression levels of Ana2-mNG in the eAna2-mNG transgenic line and the Ana2-mNG knock-in line generated by CRISPR/Cas9. For Western blotting, actin or Cnn are shown as loading controls. Prominent non-specific bands are highlighted (*). A representative blot is shown from at least two technical repeats. Statistical significance was assessed using an unpaired t test with Welch’s correction (for Gaussian-distributed data) or a Mann-Whitney test (****, P < 0.0001; **, P < 0.01).
Figure 2.
Figure 2.
The cytoplasmic concentration of the core centriole duplication proteins does not change dramatically as daughter centrioles assemble during nuclear cycle 12. (A and B) Graphs show cytoplasmic FCS concentration measurements (mean ± SEM) of either mNG or dNG controls (A) or mNG-fusions to the core centriole duplication proteins (B). Measurements were taken every 2 min from the start of nuclear cycle 12. The timing window of NEB is depicted in yellow and mitosis in green. Each data point represents the average of 4–6× 10-s recordings from an individual embryo (N ≥ 10). (C) The graph shows ePlk4-mNG PeCoS measurements (mean ± SD) taken at 60-s intervals from the start of nuclear cycle 12. Each data point represents an individual 60 s PeCoS measurement (N = 10). Statistical significance was assessed using a paired one-way ANOVA test (for Gaussian-distributed data) or a Friedman test (**, P < 0.01; *, P < 0.05).
Figure S2.
Figure S2.
Sas-6 appears to be monomeric and Ana2 multimeric in the cytoplasm, but the homo-oligomeric state of Ana2 does not appear to change during the nuclear cycle. (A) Graph shows the average FCS-measured count-per-molecule (CPM) values (mean ± SEM) for monomeric and dimeric NeonGreen compared to mNG-Sas-6, Sas-6-mNG, mNG-Ana2 and Ana2-mNG at the beginning of nuclear cycle 12. Each data point represents the average of 4–6× 10-s recordings from an individual embryo (N ≥ 55). Statistical significance was assessed using an unpaired t test with Welch’s correction (****, P < 0.0001; *, P < 0.05). (B and C) Graphs show cytoplasmic FCS-measured CPM values (mean ± SEM) of mNG, dNG (B) and mNG fusions to the core centriole duplication proteins (C) during nuclear cycle 12. Measurements were taken every 2 min from the start of nuclear cycle 12. Each data point represents the average of 4–6× 10-s recordings from an individual embryo (N ≥ 10). Statistical significance was assessed using a paired one-way ANOVA test (for Gaussian-distributed data) or a Friedman test.
Figure 3.
Figure 3.
The cytoplasmic diffusion rate of Ana2 changes significantly as embryos exit S-phase. (A and B) Graphs show cytoplasmic FCS diffusion rate measurements (mean ± SEM) of either mNG or dNG controls (A) or mNG-fusions to the core centriole duplication proteins (B). Measurements were taken every 2 min from the start of nuclear cycle 12. The timing window of NEB is depicted in red, and of mitosis in blue. Each data point represents the average of 4–6× 10-s recordings from an individual embryo (N ≥ 10). The mNG-Ana2 and Ana2-mNG graphs are boxed in pink, as these proteins showed the most dramatic change in diffusion rates during the cycle. Statistical significance was assessed using a paired one-way ANOVA test (for Gaussian-distributed data) or a Friedman test (****, P < 0.0001; ***, P < 0.001; *, P < 0.05).
Figure 4.
Figure 4.
Ana2’s change in diffusion rate does not appear to depend on the CC or STAN domain, but this change is perturbed if Ana2 cannot be phosphorylated by Cdk/Cyclins. (A) Schematic illustration of the Ana2 protein and the deletion/mutant forms analyzed in this study: central coiled-coil (CC) domain (aa195-229); STil/ANa2 (STAN) domain (aa316-383); the 12 S/T residues in S/T-P motifs that were mutated to Alanine. (B and C) Graphs show cytoplasmic FCS diffusion measurements (mean ± SEM) in embryos laid by females of the following genotypes: B (i) eAna2-mNG/+; B (ii) eAna2(∆CC)-mNG/+; B (iii) eAna2(∆STAN)-mNG; C (i) eAna2-mNG; C (ii) eAna2(12A)-mNG. Measurements were taken every 2 min from the start of nuclear cycle 12. The timing window of NEB is depicted in red and mitosis in blue. Each data point represents the average of 4–6× 10-s recordings from an individual embryo (N ≥ 13). Statistical significance was assessed using a paired one-way ANOVA test (for Gaussian-distributed data) or a Friedman test (****, P < 0.0001; **, P < 0.01).
Figure S3.
Figure S3.
There are 12 S/T-P motifs in D. melanogaster Ana2. (A) Schematic illustrates the position and conservation of the S/T-P motifs in D. melanogaster Ana2 and indicates which of these have been shown to be phosphorylated by either Cdk/Cyclin B (this study) or a recombinant Plk4 kinase domain (Dzhindzhev et al., 2017) in vitro, or have been shown to be phosphorylated in either embryo (Dzhindzhev et al., 2017) or S2 cell extracts (McLamarrah et al., 2018) by MS. (B) A multiple sequence alignment (MSA) showing the conservation of S/T-P motifs (highlighted in red) in Ana2 from 15 different Drosophila species. Note that the numbering of the MSA in (B) does not precisely line up with the numbering in the schematic (A) due to the introduction of gaps in the D. melanogaster sequence shown in the MSA (B).
Figure S4.
Figure S4.
The S284 and T301 S/T-P motifs of Ana2 can be phosphorylated by recombinant Cdk1/Cyclin B kinase in vitro. (A) The sequence of Ana2 (aa278-306) highlighting the S/T-P motifs at S284 and T301. (B) The indicated biotinylated peptides were synthesised in vitro and incubated with 32P-ATP in the presence of recombinant human Cdk1/Cyclin B, or buffer alone. The reaction mixtures were spotted onto nitrocellulose membranes and autoradiographs were obtained before the membranes were probed with anti-biotin antibodies to confirm the approximately equal loading of the peptides. The peptides including S284 and T301 were phosphorylated specifically in the presence of the kinase to approximately the same extent as the positive control peptide, and this phosphorylation was essentially abolished if S284 or T301 was mutated to Alanine. We conclude that both sites are strongly and specifically phosphorylated by Cdk1/Cyclin B in vitro. A representative blot is shown from three technical repeats.
Figure S5.
Figure S5.
The Ana2(12A) mutant appears to fully rescue the ana2−/− mutant phenotype. (A) Graphs quantify the distance climbed by WT or ana2−/− mutant flies expressing either WT Ana2-mNG, eAna2(12A)-mNG or eAna2(12D/E)-mNG in the 5 s period after all the flies have been mechanically “banged” to the bottom of a vial. This is a standard assay to measure fly coordination. Note that ana2−/− mutant flies are completely uncoordinated, so they cannot climb any distance at all. All three alleles, WT, 12A and 12D/E rescue this phenotype, suggesting that centriole duplication and cilia formation are unperturbed in these “rescued” flies. Each individual point on the graph represents the average distance climbed by a single fly in an individual experiment. 10–15 flies were measured in 4–6 technical repeats for each genotype. Statistical significance was assessed using an unpaired t test with Welch’s correction. (B) Graph quantifies the percentage of embryos that hatch as larvae when laid by either WT females or ana2−/− mutant females expressing either WT Ana2-mNG, eAna2(12A)-mNG or eAna2(12D/E)-mNG. Note that these experiments were conducted when the laboratory was experiencing a general problem with Fly food, whereby many of our laboratory strains were laying embryos that did not hatch at their normal high frequencies (usually >85% for WT controls); ∼400 embryos were counted for each genotype. (C i) EM Images show exemplar centrioles in either WT or ana2−/− mutant expressing eAna2(12A) 3rd instar larval wing discs. We examined a total of ∼150 centrioles from five wing-discs of each genotype and identified no obvious morphological defects. (ii) Graph shows centriole length—scored blind in longitudinal EM sections, as depicted in the bottom panels in C (i)—in ana2−/− mutant 3rd instar larval wing discs expressing either WT Ana2 or eAna2(12A). Statistical significance was assessed using an unpaired t test with Welch’s correction. (D) Western blots of 0–2 h embryos comparing the expression levels of Ana2-mNG, eAna2(12A)-mNG and eAna2(12D/E)-mNG. Prominent non-specific bands are highlighted (*). Cnn is shown as a loading control, and a representative blot is shown from at least two technical repeats.
Figure 5.
Figure 5.
eAna2(12A)-mNG exhibits an abnormal pattern of centriolar recruitment. (A i) Images show the typical centriolar recruitment dynamics of WT Ana2-mNG or eAna2(12A)-mNG in an embryo during nuclear cycle 12—aligned to nuclear envelope breakdown (NEB; t = 0). Images were obtained by superimposing all the centrioles at each time point and averaging their fluorescence (scale bar = 1 µm). (ii) Graph shows the normalized (mean ± SEM) centriolar fluorescence levels of WT Ana2-mNG (black) and eAna2(12A)-mNG (red) during nuclear cycle 12 aligned to nuclear envelope breakdown (NEB; t = 0). N > 12 embryos; n ∼ 100–150 centriole pairs per embryo. (iii) Bar charts quantify the normalised initial and maximal centriolar intensity (mean ± SEM). Each data point represents the average value of all centrioles measured in an individual embryo. (B) Quantification of the time (mean ± SD) at which Ana2 levels start to decrease at the centriole relative to NEB/mitosis. Statistical significance was assessed using an unpaired t test with Welch’s correction (for Gaussian-distributed data) or a Mann-Whitney test (****, P < 0.0001). (C) Scatterplot shows the correlation (obtained by linear regression of the data) between Ana2’s growth period and S-phase length during nuclear cycles 11–13. N ≥ 10 embryos for each cycle, n ∼ 70–90 (c11), n ∼ 100–150 (c12), and n ∼ 200–300 (c13) centriole pairs per embryo. Correlation strength was assessed using the Pearson’s correlation coefficient.
Figure 6.
Figure 6.
Centrioles grow more slowly, but for a longer period, in the presence of eAna2(12A). (A i) Images show the typical centriolar recruitment dynamics of Sas-6-mNG in a WT embryo or an embryo expressing eAna2(12A) during nuclear cycle 12—aligned to centriole separation at the start of S-phase (CS; t = 0). Images were obtained by superimposing all the centrioles at each time point and averaging their fluorescence (scale bar = 1 µm). (ii) Graph shows the normalized (mean ± SEM) Sas-6-mNG centriole recruitment dynamics during nuclear cycle 12 in the presence of WT Ana2 (black) and eAna2(12A) (green) aligned to nuclear envelope breakdown (NEB; t = 0). N > 14 embryos, n ∼ 100–150 centriole pairs per embryo. (B) Bar charts quantify and compare several centriole growth parameters (mean ± SEM) extracted from the data shown in (A ii). The values were derived from the fitted regression curve of the mean Sas-6-mNG intensity of each individual embryo. Each datapoint represents the average value of all the centriole pairs measured in each embryo. Statistical significance was assessed using an unpaired t test with Welch’s correction (****, P < 0.0001; ***, P < 0.001). (C) Western blot shows Sas-6 levels in WT embryos and embryos expressing one copy of Sas-6-mNG in either a WT or eAna2(12A) background. A prominent non-specific band is highlighted (*); Cnn is shown as loading control. A representative blot is shown from two technical repeats.
Figure 7.
Figure 7.
The centriolar Plk4 oscillation is not dramatically perturbed in the presence of eAna2(12A). (A i) Images show the typical centriolar recruitment dynamics of ePlk4-mNG in a WT embryo or an embryo expressing one copy of untagged eAna2(12A) in the presence of one copy of the endogenous WT ana2 gene during nuclear cycle 12—aligned to centriole separation at the start of S-phase (CS; t = 0). Images were obtained by superimposing all the centrioles at each time point and averaging their fluorescence (scale bar = 1 µm). (ii) Graph shows the normalized (mean ± SEM) centriolar recruitment dynamics of ePlk4-mNG in the presence of either only untagged endogenous Ana2 (black) or one copy of untagged eAna2(12A) expressed in the presence of one copy of the endogenous WT ana2 gene (orange) during nuclear cycle 12. Data was aligned to centriole separation (CS) at the start of S-phase. N = 10 embryos, n ∼ 100 centriole pairs per embryo. (B) Bar charts quantify the amplitude (maximal intensity) and period (full width at half maximum intensity) (mean ± SEM) of the Plk4-mNG oscillation. Each data point represents the average value of all the centrioles measured in an individual embryo. Statistical significance was assessed using an unpaired t test with Welch’s correction.
Figure 8.
Figure 8.
eAna2(12D/E)-mNG is not recruited to centrioles efficiently. (A i) Images show the typical centriolar recruitment dynamics of WT Ana2-mNG or eAna2(12D/E)-mNG in an embryo also expressing one copy of the endogenous untagged ana2 gene during nuclear cycle 12—aligned to nuclear envelope breakdown (NEB; t = 0). Images were obtained by superimposing all the centrioles at each time point and averaging their fluorescence (scale bar = 1 µm). Note that the centrioles in the embryo expressing eAna2(12D/E)-mNG were very dim so their brightness has been enhanced by 2X relative to the WT control. (ii) Graph shows normalized (mean ± SEM) centriolar recruitment dynamics of either WT Ana2-mNG (black) or eAna2(12D/E)-mNG (blue) expressed in the presence of 1 copy of the endogenous untagged ana2 gene during nuclear cycle 12. Data were aligned to nuclear envelope breakdown (NEB; t = 0). N ≥ 11 embryos, n ∼ 100–150 centriole pairs per embryo. (B) Bar charts quantify the normalised initial and maximal fluorescence intensity (mean ± SEM). Each data point represents the average value of all centrioles measured in an individual embryo. Statistical significance was assessed using an unpaired t test with Welch’s correction (****, P < 0.0001).

Similar articles

Cited by

References

    1. Alvarez Rodrigo, I., Steinacker T.L., Saurya S., Conduit P.T., Baumbach J., Novak Z.A., Aydogan M.G., Wainman A., and Raff J.W.. 2019. Evidence that a positive feedback loop drives centrosome maturation in fly embryos. Elife. 8:e50130. 10.7554/eLife.50130 - DOI - PMC - PubMed
    1. Alvarez-Rodrigo, I., Wainman A., Saurya S., and Raff J.W.. 2021. Ana1 helps recruit Polo to centrioles to promote mitotic PCM assembly and centriole elongation. J. Cell Sci. 134:jcs258987. 10.1242/jcs.258987 - DOI - PMC - PubMed
    1. Arquint, C., Gabryjonczyk A.-M., Imseng S., Böhm R., Sauer E., Hiller S., Nigg E.A., and Maier T.. 2015. STIL binding to Polo-box 3 of PLK4 regulates centriole duplication. Elife. 4:1948. 10.7554/eLife.07888 - DOI - PMC - PubMed
    1. Arquint, C., and Nigg E.A.. 2016. The PLK4-STIL-SAS-6 module at the core of centriole duplication. Biochem. Soc. Trans. 44:1253–1263. 10.1042/BST20160116 - DOI - PMC - PubMed
    1. Aydogan, M.G., Steinacker T.L., Mofatteh M., Wilmott Z.M., Zhou F.Y., Gartenmann L., Wainman A., Saurya S., Novak Z.A., Wong S.-S., et al. . 2020. An autonomous oscillation times and executes centriole biogenesis. Cell. 181:1566–1581.e27. 10.1016/j.cell.2020.05.018 - DOI - PMC - PubMed

Publication types

MeSH terms